Normal view

There are new articles available, click to refresh the page.
Today — 14 September 2026Main stream

Lexar Showcases World’s Thinnest Portable SSD At IFA 2026, Measuring Just 3.8mm Thick And 1mm At The Edge

13 September 2026 at 15:37

A Lexar portable SSD marked '512GB' is connected to an orange smartphone with a case nearby.

Lexar unveiled its thinnest portable SSD yet, which measures 3.8mm at its thickest point, but is hardly 1 mm thick on the edges. New Lexar Muse Ultra-Slim Portable SSD Tapers Down to Just 1mm Thickness at the Edges, Designed Specifically for Mobile Creators Lexar says that, unlike conventional portable SSDs, which need more space, its Muse delivers an ultra-thin form factor, making it convenient for mobile creators. Lexar unveiled the Muse at IFA 2026 in Berlin, claiming it to be the world's thinnest portable SSD ever made. As per the company, the Muse SSD measures just 3.8 mm at its […]

Read full article at https://wccftech.com/lexar-showcases-worlds-thinnest-portable-ssd-at-ifa-2026/

Yesterday — 13 September 2026Main stream

An MSI Z790 Motherboard Listed On eBay As “For Parts/Not Working” Became A Lucky Find As Customer Found A 2TB NVMe Gen 4 SSD That Also Booted Into Windows

12 September 2026 at 08:00

An MSI Z790 motherboard purchased from eBay was hiding a 2TB NVMe Gen 4 SSD

A customer who considered himself unlucky when it came to PC hardware purchases is not just enjoying a working MSI PRO Z790-P WIFI from eBay that was only listed for its parts because it was seemingly not working, but there was also a 2TB PCIe NVMe Gen 4 SSD hiding in one of the populated M.2 slots. Best of all, the motherboard successfully booted into Windows. The customer not only got a high-end motherboard at a throwaway price, but also saved $300 thanks to the included 2TB NVMe Gen 4 SSD At the very least, Redditor “TheQxx” mentioned in his […]

Read full article at https://wccftech.com/msi-z790-motherboard-ebay-for-parts-hidden-2tb-gen4-ssd-boots-windows/

Before yesterdayMain stream

SANDISK NAS 800 Review: PCIe Gen 5 Performance Meets Top Endurance

By: Dong Ngo
9 September 2026 at 16:52
The SANDISK NAS 800, unveiled late last month as part of Sandisk’s new storage portfolio, is the first PCIe Gen 5 internal solid-state drive (SSD) purpose-built for network-attached storage (NAS) servers. It’s also currently the only one of its kind, as Seagate seems to have phased out its NAS SSDs. ...

Continue Reading

Acer’s Predator GM7000 PCIe NVMe Gen 4 SSD With 2TB Capacity & DRAM Cache Drops To $314.99 On Amazon, Experience Insane Performance At 10% Off

8 September 2026 at 13:13

Acer Predator GM7000 2TB SSD drops to $314.99 on Amazon

The GM7000 might appear to be an ordinary PCIe NVMe Gen 4 SSD in a standard M.2 2280 form factor, but that’s because you haven’t heard about its in-depth specifications. Not only does Acer’s 2TB drive feature a DRAM cache, it’s also 10 percent off on Amazon, bringing this premium solid-state drive’s price down to $314.99. The DRAM cache on the GM7000 allows the SSD to maintain peak performance during heavy workloads, resulting in maintaining sustained performance Utilizing the PCIe Gen 4 x4 interface alongside the NVMe 1.4 protocol, the Predator GM7000 can reach blazing-fast sequential read speeds of up […]

Read full article at https://wccftech.com/acer-predator-gm7000-2tb-pcie-gen4-ssd-amazon-deal/

Micron 6600 ION 245TB: Swap the Hard Drives, Power an NVL72 for Free

3 September 2026 at 17:00

For two decades, the SSD-versus-HDD conversation ended the same way: flash wins on performance, disk wins on price per terabyte, and the size of that price gap settled the argument in favor of bulk storage. As storage technology has matured and AI has taken over, that framing is clearly out of date. The largest data center operators are no longer capacity-constrained by what they can afford to buy; they are constrained by what they can power, cool, and physically fit. When we reviewed the 245TB capacity Micron 6600 ION SSD earlier this year, the drive’s benchmark results told one story, but the more consequential one was the math around watts and rack units. In our measurements, a single Micron 6600 ION SSD did the work of eight nearline hard drives, and the flash configuration writing at full tilt drew less power than the HDD configuration at rest. Extend that swap across an exabyte, and the footprint collapses from 22 racks of best-case HDD density to 6 racks of flash, handing 16 rack positions back to the compute plan. A drive that puts nearly a quarter petabyte into a single slot changes how exabytes are planned, and in today’s facilities, both the watts and the racks are spoken for years in advance.

Micron has promoted the 245TB capacity 6600 ION aggressively since it began shipping in May, and we have the test data to check the claims. The FIO and power work here, alongside the GPU Direct Storage and DLIO checkpointing results in our full review of the drive, supports a specific version of the pitch: for read-heavy bulk storage at scale, the drive delivers density and efficiency that nearline HDDs cannot approach, with trade-offs that are predictable when the workload matches the design.

Key Takeaways

  • One drive replaced eight: A single 245TB Micron 6600 ION stood in for eight Seagate Exos M 30TB drives in RAID5 in the same Dell R5715, with the HDD backplane and RAID controller pulled from the chassis.
  • Flash writing draws less than disk idling: 170.2W under sequential writes against 173.5W for the HDD configuration at rest. Every measured state freed between 49.7W and 63.8W, blending to 55W per unit.
  • Watts convert directly to compute: 44.0kW freed per rack of flash servers. At 2,182 drives, less than three racks, the swap frees the 120kW that operates a complete GB200 NVL72.
  • Efficiency, not just draw: 72.7 MB/s per watt against 10.4 for the HDD array, or 3.8 watt-hours to read a terabyte against 26.7, roughly 7x on sequential reads.
  • An exabyte in 6 racks instead of 22: 4.2 times the capacity per rack with both sides at best-case density, returning 16 rack positions and roughly 320 square feet of white space per exabyte.

Data Center Economics Are Being Rewritten

The International Energy Agency projects data center electricity consumption will more than double to roughly 945 TWh by 2030, with AI the largest driver, and in the facilities absorbing that growth, power, space, and cooling have replaced budget as the binding constraints. In a power-capped building, every watt and every rack position allocated to storage is capacity that cannot be used for revenue-generating GPUs.

The 245TB capacity Micron 6600 ION SSD was built for that arithmetic. Nearline HDDs still win on acquisition cost per terabyte, and for cold archives and rarely accessed data, that advantage remains decisive. But operators planning at exabyte scale are pricing something different: the cost to own and operate that capacity over its service life within a fixed power and space envelope. Measured that way, the drive’s density converts directly into recovered watts, rack positions, and cooling headroom, which is to say, into the compute the facility can now hold. Travis Vigil, Dell Technologies’ senior vice president of ISG product management, made the vendor version of the TCO case at launch, calling the 6600 ION “a meaningful reduction in total cost of ownership for customers building out AI and large-scale data center environments.” IDC’s Jeff Janukowicz, research vice president for solid state drives and enabling technologies, described the same shift at launch: “Rapid AI dataset growth is shifting storage economics from individual drives to rack-level efficiency. Operators need more usable capacity per rack while staying within strict power and cooling constraints.” The following sections provide our own measurements to support that argument.

Micron 6600 ION 245TB Overview

The 6600 ION 245TB is currently the highest-capacity commercially available SSD, shipping since May 5, 2026, in E3.L 9.5mm and U.2 15mm form factors. It is built on Micron’s ninth-generation G9 QLC NAND with a six-plane architecture that pushes NAND I/O to 3.6 GB/s, the fastest QLC currently shipping in a data center SSD. The controller rides a PCIe Gen5 x4 interface, and the drive carries the compliance list a procurement team expects: OCP 2.6, NVMe 2.0d, TAA eligibility, and FIPS 140-3 Level 2 certifiability with CNSA 2.0 and SPDM 1.2 support.

The spec sheet makes the design intent straightforward. Sequential reads are rated at 13,700 MB/s against 3,000 MB/s writes, and random reads at 1.78 million IOPS against 42,000 random write IOPS. The top-capacity model uses a 16K indirection unit rather than 4K, which is why endurance is 1.0 SDWPD for 128KB sequential writes but 0.3 RDWPD for 16K random writes. This is a read-optimized high-capacity SSD.

Specification Micron 6600 ION 245TB
Platform Overview
Capacity 245TB
Form Factors E3.L (9.5mm)
U.2 (15mm)
Interface PCIe Gen5 x4, NVMe 2.0d
NAND Micron G9 QLC, six-plane, 3.6 GB/s NAND I/O
Performance
Sequential Read 13,700 MB/s
Sequential Write 3,000 MB/s
Random Read 1,780,000 IOPS
Random Write (4K/16K) 42,000 IOPS
Latency (QD1, Read/Write) 100µs / 20µs
Power and Endurance
Max Power ≤30W
Idle Power ≤5W
Endurance 1.0 SDWPD (128KB sequential)
0.3 RDWPD (16K random)
MTTF / UBER 2.5 million hours @ 50°C
<1 sector per 1017 bits read
Features
Compliance OCP 2.6
NVMe 2.0d
NVMe-MI 1.2d
TAA
Security FIPS 140-3 L2 certifiable
CNSA 2.0
SPDM 1.2
Micron SEE, SED options

What Our Testing Showed

We tested the performance and power of the Micron 6600 ION 245TB in a Dell R5715, alongside a configuration of eight 30TB HDDs in RAID5. The platform was specifically chosen as it included 3.5″ HDD support, as well as a PERC12 RAID to put the drives on their best foot forward in terms of performance.

Because the R5715’s platform overhead is the same in both configurations, the per-workload delta between the Micron 6600 ION and eight HDDs in RAID5 represents the storage-attributable power difference. We used our Quarch Mains Power Analysis Module to measure the server’s power draw. Idle power measurements include all server components at rest; the gap reflects the difference in drive power, standby electronics, and fan response between the two configurations. Active workload deltas follow the same logic: the server’s non-storage draw changes only marginally between workloads, so the active savings is the storage subsystem, as well as some CPU uplift in areas where the SSD is driving higher I/O through the system.

Configurations Tested

  • HDD RAID5: Eight Seagate Exos M 30TB drives installed via the R5715’s standard HDD backplane, connected to the onboard RAID controller and configured as a RAID5 group presenting 210TB of usable capacity. The backplane, controller, and all eight drives were fully populated and operational during measurement.
  • NVMe SSD: The HDD backplane was removed from the chassis entirely. A dedicated E3.L riser was installed in its place, and the Micron 6600 ION 245TB was seated into that riser and connected via PCIe Gen5 x4 NVMe, presenting the full 245TB as a single namespace. No spinning drives, RAID controller activity, or backplane electronics were present during SSD measurement.

On paper, the 245TB capacity Micron 6600 ION SSD is rated at an idle power draw of less than 5W and a maximum power draw of under 30W. The Seagate Exos M 30TB HDDs, by comparison, include an idle power rating of 6.9W and a max operating rating of 9.5W.

FIO workloads

  • Sequential 128K: Read and write tested independently. We focused on single-threaded sequential transfers for both SSDs and HDDs, reflecting the scan and ingest patterns that dominate high-capacity data lake tiers.

Each workload ran for 3 minutes, with power and performance data averaged over that duration.

Workload Power Consumption Comparison

Bar chart of measured system power for three workloads, each showing the HDD RAID5 configuration and the Micron 6600 ION configuration with the savings called out: idle 173.5 versus 115.9 watts, saving 57.6; sequential read 224.7 versus 175.0 watts, saving 49.7; sequential write 234.0 versus 170.2 watts, saving 63.8.

At rest, the gap is immediate and structural:

  • Idle draw: 115.9W for the 6600 ION configuration against 173.5W for eight Exos M HDDs on their backplane with the RAID controller.
  • The gap: 57.6 watts. The HDD configuration draws 50% more power at rest, or, put another way, the flash configuration cuts idle power draw by a third.
  • Normalized to capacity: 0.47 W/TB at idle against the HDD array’s 0.72 W/TB on raw capacity parity, a 35% reduction in power per terabyte.

That idle figure matters more than it first appears. Storage isn’t always saturated, particularly in large-scale object storage, archival, and AI data lake environments where data is ingested in bursts and read intermittently.

Under load, the separation holds across both directions of traffic:

  • Sequential read: 175.0W for the 6600 ION configuration against 224.7W for the HDD array.
  • Sequential write: 170.2W against 234.0W.
  • No overlap: the flash configuration under its heaviest measured load drew 49.7W less than the HDD array under its lightest.
  • The headline number: sequential write draw of 170.2W sits below the HDD array sitting completely idle at 173.5W.

A quarter petabyte of flash writing at full speed uses less system power than eight idle hard drives.

Power is draw at an instant; energy is draw multiplied by time. That distinction matters here, because the flash configuration does not merely draw less, it finishes sooner. Our review of the 245TB Micron 6600 ION measured 12,729.8 MB/s in 128K sequential reads, while our review of the Seagate Exos M 30TB measured 292MB/s from a single drive. Granting the HDD array perfect linear scaling across all eight spindles, a best case no RAID5 group reaches in practice, the disk side is bounded near 2,336 MB/s. Set those against the power we measured during the sequential read runs and the efficiency gap opens well past the wattage gap:

  • Throughput per watt: 72.7 MB/s per watt for the 6600 ION configuration against 10.4 MB/s per watt for the HDD array.
  • Energy to read one terabyte: roughly 3.8 watt-hours on flash against roughly 26.7 watt-hours on disk.
  • Either way, about 7x, and that is a floor, since it credits the hard drives with scaling they do not deliver.

The throughput figures come from our respective product reviews rather than from the power runs above, so the ratio is derived rather than measured end to end, and it describes sequential reads, the pattern this drive was built for.

Micron reports a much larger advantage from its own testing, citing up to 84x better energy efficiency for AI preprocessing. Micron isolates drive-level power, which strips out the roughly 116W of shared platform draw sitting under both of our configurations, compares against sixteen hard drives rather than eight, and uses AI pipeline access patterns that punish spinning media harder than sequential reads do. Our 7x is the system-level floor; Micron’s ceiling can be much higher depending on the workflow applied.

The Watts-and-Racks Math

The relevant framing for storage power consumption is not the electricity bill; rather, data center power budgets are finite, grid access is increasingly constrained, and cooling capacity is a hard ceiling on what can be deployed. Every watt a storage system consumes is a watt that cannot go to a GPU. In environments where Blackwell deployments are throttled by available power rather than by procurement limits or software readiness, storage efficiency is a compute-capacity decision.

Our system-level measurements provide the basis. Each comparison unit, one 6600 ION (245TB) replacing eight Seagate Exos M drives in a RAID5 group (210TB usable), shows a measurable power delta across all tested states, ranging from 49.7W (sequential read, 1T) to 63.8W (sequential write, 1T). To get a single representative number, we weighted the three measured states by a duty cycle typical of an AI data lake tier: 40% idle, 45% sequential reads, and 15% sequential writes dominated by ingest and checkpoint traffic, consistent with published characterizations of training-tier storage from Meta and others. That blend lands at 55W freed per unit. The weighting barely matters, which is the point: because every measured state frees roughly 50W to 64W, any realistic mix of idle, read, and write time lands within a few watts of the same answer.

Applying that 55W average to real deployments: a 2U flash storage server holds 40 E3.L drives, and a standard 42U rack holds 20 such servers with 2U left for networking. Mapping the freed power against the current GPU lineup: the H200 SXM carries a 700W TDP, the B200 SXM (Blackwell) 1,000W, the B300 SXM (Blackwell Ultra) 1,400W, and the GB200 NVL72, which packs 72 Blackwell GPUs and 36 Grace CPUs into a single liquid-cooled rack, draws approximately 120kW at full load per NVIDIA’s system documentation.

Chart showing power freed by replacing HDDs with Micron 6600 ION 245TB SSDs: one flash server frees 2.2kW, enough for three H200 GPUs; one rack frees 44.0kW; at the threshold, 2,182 SSDs across 2.73 racks free 120kW, powering a full GB200 NVL72.

The threshold tipping point highlights how compelling the power savings can be at scale. Replacing 17,456 spinning drives with 2,182 Micron 6600 ION SSDs, less than three racks of dense flash servers, frees 120kW at the 55W average: enough to operate one complete GB200 NVL72 within the same facility power allocation. That system delivers 1.44 exaFLOPS of FP4 compute across 72 Blackwell GPUs with 13.5TB of unified HBM3e memory. The storage freed that headroom by consuming less power while doing the same job.

The 55W average spans the full range of measured states. In the best case (sequential write 1T, 63.8W), the NVL72 threshold is 1,881 SSDs, about 2.4 racks. In the worst case (sequential read 1T, 49.7W), it rises to 2,414 SSDs, about 3.0 racks. The 55W blend lands the threshold at 2,182 SSDs (2.73 racks), and no realistic workload mix moves it far.

Every figure above is an IT-level delta, which keeps the comparison honest: GPUs have their own cooling overhead, so converting freed watts into GPUs at the IT level is an apples-to-apples comparison. At the facility level, the savings only grow. With a PUE of 1.2 to 1.5, the 44.0kW of IT load removed per rack represents 53 to 66kW of total facility load, since cooling overhead tracks the IT watts it no longer has to reject. The HDD drive counts also use raw capacity parity; serving the same usable capacity through RAID5 would require roughly 17% more hard drives, raising the HDD-side power in every row.

Jeremy Werner, Micron’s senior vice president and general manager for the core data center business unit, framed the trajectory at launch: “AI workloads are driving massive growth in shared data, continuing the shift of data center storage share from HDDs toward SSDs.”

One Exabyte in 6 Racks: The Floorspace Dividend

Power is only half of the constraint set. The other half is physical: how much capacity fits in a rack, and how many racks an exabyte occupies. The fair way to frame this is best case against best case. For disk, that is Seagate’s Exos 4U106, the densest HDD enclosure shipping, filled with 44TB drives, the largest announced. 10 enclosures fill a 42U rack with 1,060 drives and 46.6PB of raw capacity. For flash, the best case is the E3.L form factor the 6600 ION was built around: 2U servers holding 40 drives each, 20 per rack, 800 drives, and 196.6PB. Rack against rack, each side at its densest, hard drives deliver 46.6PB while the 245TB SSDs deliver 196.6PB, 4.2 times the capacity in the same footprint.

One exabyte deployed two ways: 22 racks of 44TB HDDs in best-case Seagate Exos 4U106 density versus six racks of Micron 6600 ION 245TB SSDs, 4.2 times the capacity per rack and roughly 73 percent less floorspace.

If anything, the comparison is as favorable as possible to disk. A fully loaded 4U106 is a deep, top-loading enclosure that weighs over 200 pounds populated; many facilities cap HDD racks well below 10 enclosures on floor-loading grounds alone. We also gave the hard drives a capacity point that is still ramping while the 245TB SSD is shipping today.

Stretch the math to a deployed exabyte, and the difference becomes a floor-plan decision. On 44TB disk at best-case density, one exabyte requires roughly 22,730 drives across 22 racks. On 245TB flash, it lands in about 4,070 drives across 6 racks, roughly 73% less floor space. That is 16 rack positions handed back before counting the switching, cabling, and cooling distribution that those racks drag along.

Data center planners typically model net white space at roughly 20 square feet per rack once aisles, power distribution, and cooling clearances are allocated, a planning proxy drawn from the Department of Energy’s best-practices guidance for data center design. By that measure, the 16 rack positions returned per exabyte represent about 320 square feet of white space that never has to be built, leased, or provisioned, and at 10EB the arithmetic clears 3,200 square feet. For facility planners, that is the most valuable kind of capacity: deferral. An expansion that slips a year or is canceled outright returns its budget and its construction timeline to the compute plan.

The savings extend past the concrete. Every rack that is never deployed removes a top-of-rack switch, its power distribution units, and the structured cabling that ties it into the fabric, along with the management overhead it carries for its service life. Network architects see fewer ports to light and fewer devices to patch, operations teams see fewer field units to monitor and replace, and finance sees rack-linked line items, from colocation space to cooling distribution, that simply never appear. Micron’s own space- and power-economics analysis for the 6600 ION reaches the same conclusion from modeled rack math: capacity that grows within existing racks preserves both space and power headroom, while HDD-based growth adds racks, servers, and supporting infrastructure in lockstep.

The reason those 16 racks matter is that rack positions have become the scarcest commodity in the industry. CBRE’s Global Data Center Trends report for 2026 puts Northern Virginia vacancy at 0.3%, Atlanta at 1.0%, and 80% of all capacity under construction in the top four US markets already preleased before it opens. Absorption hit a record 2,236MW globally in the past year, while rents climbed double digits in several major markets. An operator cannot simply buy more floorspace; it doesn’t exist to buy, and new capacity is spoken for years before the concrete is poured. Space recovered within an existing footprint is the only inventory available immediately and at no marginal cost.

Floorspace and power converge on the same conclusion from different directions. A rack that no longer holds nearline disk is not merely emptier; it is available. In a build where every rack position is provisioned for power and cooling before the first server arrives, handing 16 positions back to the compute plan is worth more than the real estate itself. The watts follow the racks, and in current AI facilities, both are spoken for years in advance.

Final Thoughts

The 245TB Micron 6600 ION is the highest-capacity SSD shipping today, engineered around a single job: put a quarter petabyte in one slot and hold it there at under 30 watts. This is a read-optimized design, so sequential writes cap at 3,000 MB/s and the 16K indirection unit sets random write endurance accordingly. That is a specific lane, something SSDs have gotten better at identifying over the years. When performance is the goal, Micron has a part for that: the Gen6 9650 is rated at 14,000 MB/s sequential writes and up to 900,000 random write IOPS, more than twenty times the ION on random writes. For the read-heavy bulk capacity AI data lakes are built on, that combination changes the arithmetic of the facilities it goes into.

Our measurements bear that out at a scale we did not expect going in. One of these drives displaced eight nearline hard drives in the same server, and the flash configuration writing at full speed drew less system power than the disk configuration sitting idle. Extended across a rack, the swap frees 44.0kW. Extended to 2,182 drives, it frees the 120kW that operates a GB200 NVL72. The floorspace math moves in the exact same way: an exabyte lands in 6 racks instead of 22, returning 16 rack positions and roughly 320 square feet of white space per exabyte to the compute plan.

None of this makes hard drives obsolete. Acquisition cost per terabyte still favors disk, and for cold archives and rarely accessed data, that advantage remains decisive. What has changed is the set of workloads where that comparison is the right one. In a facility where the power budget and the floor plan are both spoken for years in advance, storage stops being a line item measured in dollars per terabyte and becomes infrastructure competing directly with GPUs for the same finite resources. Measured that way, a drive that gives back watts and rack units is not a storage purchase; it is a compute purchase made in the storage tier.

Micron 6600 ION Product Page

This report is sponsored by Micron. All views and opinions expressed in this report are based on our unbiased view of the product(s) under consideration.

The post Micron 6600 ION 245TB: Swap the Hard Drives, Power an NVL72 for Free appeared first on StorageReview.com.

KIOXIA CM9-R 15.36TB Review: BiCS8 Flash Hits Full Speed at Low Queue Depths

2 September 2026 at 16:13
KIOXIA CM9-R 15.36TB E3.S SSD standing upright on the StorageReview lab bench with the drive rack behind it KIOXIA CM9-R 15.36TB E3.S SSD standing upright on the StorageReview lab bench with the drive rack behind it

The KIOXIA CM9-R is the first enterprise SSD family built on eighth-generation BiCS FLASH, and the 15.36TB E3.S model in our lab is the volume sweet spot of the range: 3,400K random read IOPS and 14,800 MB/s of sequential read from a drive with a 25W typical active rating. Gen5 enterprise drives routinely push into the high 20s to hit their headline figures, and KIOXIA’s pitch for the CM9 generation is that BiCS8’s CBA (CMOS directly Bonded to Array) design delivers top-of-class throughput without the power tax.

KIOXIA CM9-R 15.36TB E3.S SSD standing upright on the StorageReview lab bench with the drive rack behind it

The KIOXIA CM9-R 15.36TB in E3.S: BiCS FLASH, generation 8, with a 25W typical rating.

The CM9-R is the 1 DWPD read-intensive arm of the family; a 3 DWPD CM9-V mixed-use line runs alongside it. Capacities span 1.92TB to 30.72TB in E3.S, with a 61.44TB flagship reserved for the 2.5-inch U.2 version. Below 7.68TB, the series carries BiCS generation 5 flash; the 7.68TB, 15.36TB, and 30.72TB models are where generation 8 lives, and our 15.36TB review unit (KCM9XRJE15T3) sits at the exact capacity point where the series posts its best write specs: 11,000 MB/s sequential write and 540K random write IOPS, both series highs shared with no other capacity.

The drive is PCIe 5.0 x4 with dual-port x2 support for high-availability topologies, NVMe 2.0 and NVMe-MI 1.2c compliant, and supports the OCP Datacenter NVMe SSD v2.5 specification (not all requirements). Power-loss protection and end-to-end data protection are standard, with SIE, SED, and FIPS 140-3 SED security variants available in the model matrix.

KIOXIA CM9-R E3.S SSD label side at an angle showing the EDSFF connector

E3.S 7.5mm trim with the EDSFF connector; the same series runs up to 61.44 TB in 2.5-inch form factor.

KIOXIA CM9-R Specifications

Specification KIOXIA CM9-R 15.36TB (E3.S)
Platform Overview
Model KCM9XRJE15T3 (SIE)
KCM9DRJE15T3 (SED)
KCM9FRJE15T3 (FIPS SED)
Capacity 15,360 GB
Form Factor E3.S, 7.5 mm
Interface PCIe 5.0 (single x4, dual x2), NVMe 2.0, NVMe-MI 1.2c
NAND KIOXIA BiCS FLASH generation 8 3D TLC (CBA)
Performance (single port x4, up to)
Sequential Read (128 KiB) 14,800 MB/s
Sequential Write (128 KiB) 11,000 MB/s
Random Read (4 KiB) 3,400K IOPS
Random Write (4 KiB) 540K IOPS
Read / Write Latency (4 KiB QD1, typ.) 65 µs / 10 µs
Power and Endurance
Power (Active / Ready) 25 W typ. / 5 W typ.
Endurance 1 DWPD
MTTF / Warranty 2,500,000 hours / 5 years
Features
Protection Power Loss Protection
End-to-End Data Protection
Dual-port for HA
Compliance OCP Datacenter NVMe SSD v2.5 (partial)


KIOXIA CM9-R E3.S SSD lying flat on the bench, regulatory label side up

Testing Background and Comparables

We use a Dell PowerEdge R760 running Ubuntu 22.04.2 LTS as our test platform for all workloads in this review. Equipped with a Serial Cables Gen5 JBOF, it offers wide compatibility with U.2, E1.S, E3.S, and M.2 SSDs. Our system configuration is outlined below:

  • 2 x Intel Xeon Gold 6430 (32-Core, 2.1GHz)
  • 16 x 64GB DDR5-4400
  • 480GB Dell BOSS SSD
  • Serial Cables Gen5 JBOF
  • NVIDIA L4

Drives Compared

The pairing with KIOXIA’s own CD9P-R matters most: the CD9P-R showed what BiCS8 does at data center positioning, and the CM9-R is the enterprise flagship version of the same flash.

FIO Performance

128K Sequential Write (IODepth 16 / NumJobs 1)

FIO 128K sequential write bandwidth bar chart comparing the Solidigm D7-PS1030, KIOXIA CM9-R, and six other Gen5 enterprise SSDs FIO 128K sequential write average latency bar chart for the Solidigm D7-PS1030, KIOXIA CM9-R, and six other Gen5 enterprise SSDs

The CM9-R opened its FIO run with a strong steady-state 128K sequential write result: 8,668.1 MB/s at 230.4 µs, third in the group behind only the Micron 9550 MAX (10,957.9 MB/s) and 9550 Pro (10,354.6 MB/s), and comfortably clear of the rest of the field, which clustered between 6,370 and 7,127 MB/s. Against its own CD9P-R sibling at 6,912.4 MB/s, the enterprise drive had a 25% advantage, a meaningful gap given that both use the same BiCS8 flash.

128K Sequential Read (IODepth 64 / NumJobs 1)

FIO 128K sequential read bandwidth bar chart comparing the Solidigm D7-PS1030, KIOXIA CM9-R, and six other Gen5 enterprise SSDs FIO 128K sequential read average latency bar chart for the Solidigm D7-PS1030, KIOXIA CM9-R, and six other Gen5 enterprise SSDs

The read side is the one result in our dataset that’s far from the drive’s rating. At IODepth 64 on a single worker, the CM9-R delivered 9,974.6 MB/s at 801.7 µs, last in the group and well short of both the 14,800 MB/s spec and the 14,235.9 MB/s its CD9P-R sibling posted in the identical configuration. This is a single-job test, and the sweeps below show the CM9-R reading at full pace when work is spread across jobs. However, buyers with single-stream large-block read patterns should note this behavior and test their own pipeline.

64K Random Write

FIO 64K random write bandwidth line chart across queue depth and job combinations for the Solidigm D7-PS1030, KIOXIA CM9-R, and six other Gen5 enterprise SSDs FIO 64K random write average latency line chart for the Solidigm D7-PS1030, KIOXIA CM9-R, and six other Gen5 enterprise SSDs

The 64K random write sweep placed the CM9-R second in the group, peaking at 9,635.3 MB/s (IODepth 8 / NumJobs 2, at just 103.4 µs), behind only the Micron 9550 MAX at 10,878.1 MB/s. The low-queue-depth entry was the best in the field outright: 3,334.8 MB/s at 18.4 µs at IODepth 1 / NumJobs 1, ahead of the Solidigm PS1030 (2,901.7 MB/s at 21.1 µs) and everything else. The latency ceiling remained controlled, topping out at 1,942.5 µs across the sweep, while several competitors exceeded 2,300 µs and the PS1010 spiked to nearly 6,000 µs.

64K Random Read

FIO 64K random read bandwidth line chart across queue depth and job combinations for the Solidigm D7-PS1030, KIOXIA CM9-R, and six other Gen5 enterprise SSDs FIO 64K random read average latency line chart for the Solidigm D7-PS1030, KIOXIA CM9-R, and six other Gen5 enterprise SSDs

At 64K reads, the CM9-R posted the best single-stream opening in the group, 1,359.0 MB/s at 45.6 µs at IODepth 1 / NumJobs 1, edging out even the CD9P-R (1,334.0 MB/s), with the rest of the field starting at roughly half that. Just as striking is how little concurrency it needed: the drive reached its 13,402.4 MB/s peak at IODepth 4 / NumJobs 8 with only 148.7 µs of latency, while most of the field needed IODepth 32 configurations to reach theirs. The deep-queue crown went to the Solidigm PS1030 at 14,162.9 MB/s, but nothing in the group serves 64K reads at low concurrency as well as the two KIOXIA drives.

16K Sequential Write

One programming note: our 16K coverage is now sequential rather than random, a workload we first broke out in our Micron 9550 MAX review and are carrying across the group, since mid-size sequential streams dominate real deployments, particularly AI pipelines that move ordered data in runs rather than scattering random hits.

FIO 16K sequential write bandwidth line chart across queue depth and job combinations for the Solidigm D7-PS1030, KIOXIA CM9-R, and six other Gen5 enterprise SSDs FIO 16K sequential write average latency line chart for the Solidigm D7-PS1030, KIOXIA CM9-R, and six other Gen5 enterprise SSDs

The change suits the CM9-R. Its 10,812.2 MB/s peak was second only to the Micron 9550 MAX at 10,970.8 MB/s, but where the 9550 MAX needed IODepth 32 / NumJobs 4 and 181.9 µs to reach its number, the CM9-R hit its peak at IODepth 1 / NumJobs 16 with 22.8 µs of latency, the same low-queue-depth signature that defines this drive everywhere else. Single-worker latency of 10.4 µs was again the best in the group, and the drive cleared 10,400 MB/s at three separate points spanning IODepth 1 to 32.

16K Sequential Read

FIO 16K sequential read bandwidth line chart across queue depth and job combinations for the Solidigm D7-PS1030, KIOXIA CM9-R, and six other Gen5 enterprise SSDs FIO 16K sequential read average latency line chart for the Solidigm D7-PS1030, KIOXIA CM9-R, and six other Gen5 enterprise SSDs

On reads, the CM9-R posted 13,393.2 MB/s at IODepth 32 / NumJobs 8, second to its CD9P-R sibling at 13,819.7 MB/s, and it delivered effectively the same figure, 13,390.1 MB/s, at IODepth 16 / NumJobs 8 with half the latency, 149.0 versus 298.3 µs. One honest wrinkle: unlike the random tests, single-stream 16K sequential reads favored the Sandisk SN861 (12.5 µs) and the Micron (13.9 to 21.3 µs) over the KIOXIA pair, which were near 32 µs. Once parallelism was introduced, the CM9-R scaled well, achieving 12,400 MB/s at IODepth 4 / NumJobs 16.

4K Random Write

FIO 4K random write IOPS line chart across queue depth and job combinations for the Solidigm D7-PS1030, KIOXIA CM9-R, and six other Gen5 enterprise SSDs FIO 4K random write average latency line chart for the Solidigm D7-PS1030, KIOXIA CM9-R, and six other Gen5 enterprise SSDs

The CM9-R reached 1,502.9K IOPS at IODepth 8 / NumJobs 16 with just 84.6 µs of latency, fourth in the group behind the Micron 7600 MAX (1,781.2K), Solidigm PS1030 (1,595.8K), and 9550 MAX (1,544.2K), and nearly 2.8x its 540K rated figure, which KIOXIA specs at a fixed queue depth. At queue depth 1, it led the entire field with 115.8K IOPS and 8.2 µs, the fastest small-block write response we measured among drives in this group.

4K Random Read

FIO 4K random read IOPS line chart across queue depth and job combinations for the Solidigm D7-PS1030, KIOXIA CM9-R, and six other Gen5 enterprise SSDs FIO 4K random read average latency line chart for the Solidigm D7-PS1030, KIOXIA CM9-R, and six other Gen5 enterprise SSDs

The deep-queue 4K read sweep is the CM9-R’s weakest chart: 1,973.4K IOPS at its IODepth 16 / NumJobs 16 peak, seventh of eight, ahead of only the Micron 7600 MAX, and well below the Sandisk SN861’s group-leading 2,555.6K. Note the rating context: KIOXIA’s 3,400K IOPS spec is measured at queue depths beyond our sweep’s IODepth 32 / NumJobs 16 ceiling, so we treat the gap as a difference in test configuration rather than a shortfall, but drives like the SN861 and PS1030 found substantially more within the same sweep. The other half of the chart belongs to the CM9-R: 33.6K IOPS at 29.3 µs at queue depth 1, the lowest 4K read latency in the group, fractionally ahead of the CD9P-R, which made the same trait its signature in June.

GDSIO Performance

GDSIO sequential read throughput line chart across 16K, 128K, and 1M block sizes for the Solidigm D7-PS1030, KIOXIA CM9-R, and six other Gen5 enterprise SSDs GDSIO sequential read average latency line chart across 16K, 128K, and 1M block sizes for the Solidigm D7-PS1030, KIOXIA CM9-R, and six other Gen5 enterprise SSDs

GPU Direct Storage reads are where the CM9-R’s thread scaling shows the same character as its CD9P-R sibling demonstrated in June. The two KIOXIA drives led the 16K block-size segment throughout, and the CM9-R’s peak 16K result of 136.4K IOPS was the best in the entire group, ahead of the CD9P-R’s 134.2K and far clear of the Solidigm pair at the bottom (the PS1030 managed 101.2K). In the 1M segment, the CM9-R peaked at 6.06 GiB/s, second only to the CD9P-R’s 6.16 GiB/s, with the Solidigm PS1010 and Micron 9550 MAX at 6.05 GiB/s behind it. Single-thread 16K read latency of 44.5 µs sat mid-group, effectively identical to the CD9P-R; the Sandisk SN861 held the single-thread edge at 26.1 µs.

GDSIO sequential write throughput line chart across 16K, 128K, and 1M block sizes for the Solidigm D7-PS1030, KIOXIA CM9-R, and six other Gen5 enterprise SSDs GDSIO sequential write average latency line chart across 16K, 128K, and 1M block sizes for the Solidigm D7-PS1030, KIOXIA CM9-R, and six other Gen5 enterprise SSDs

The write sweep is where the CM9-R quietly sets itself apart. Its 5.51 GiB/s peak (1M block, 16 threads) was second to the Micron 9550 MAX’s 5.69 GiB/s on paper, but the shape of the two lines is the real story: the 9550 MAX dipped to roughly 2.2 GiB/s at 1M/64 in its documented volatility window, while the CM9-R held the most stable line in the group across the entire 1M segment. It also avoided the 128K high-thread collapse exhibited by both Solidigm drives. Single-thread 16K write latency of 21.4 µs tied the CD9P-R for the group’s best. For sustained GPU-adjacent write streams, this was the most predictable drive on the bench.

DLIO Checkpoint Performance

Our DLIO checkpoint test writes recurring training checkpoints across three passes, and it is a test of consistency as much as speed; lower times are better, and the gap between pass one and pass three shows how a drive behaves once its FTL is working under sustained pressure. One note on this data: checkpoint counts scale with drive capacity, so larger drives, such as the 15.36TB CM9-R, log more checkpoints per run, and per-checkpoint results are not aligned point-for-point across drives. That is why the table below presents pass averages, which normalize each drive’s run into a directly comparable figure; lower is better. On the first pass, the entire comparison group falls within a tight 459- 465-second range, with the CM9-R at 462.8 seconds. The separation comes later. By pass three, the CM9-R settles at 580.9 seconds, mid-pack toward the rear of the group: quicker than the Solidigm PS1030’s 599.2 seconds, but behind the Sandisk SN861 (553.3), Micron 9550 MAX (555.3), and its own CD9P-R sibling (570.6).

Drive Pass 1 Average (seconds) Pass 2 Average (seconds) Pass 3 Average (seconds)
Sandisk DC SN861 7.68TB 461.3 558.6 553.3
Micron 9550 MAX 12.8TB 462.8 558.9 555.3
Micron 9550 Pro 7.68TB 461.4 577.9 559.7
Solidigm PS1010 7.68TB 458.8 561.1 564.6
Micron 7600 MAX 6.4TB 464.2 581.5 567.3
KIOXIA CD9P-R 7.68TB 464.7 575.6 570.6
KIOXIA CM9-R 15.36TB 462.8 571.9 580.9
Solidigm PS1030 12.8TB 462.3 578.0 599.2


The pass-three position deserves interpretation rather than alarm. A 1 DWPD read-intensive drive is not bought for sustained checkpoint writes, and the FIO results carry the drive’s actual argument: the group’s best low-queue-depth latency on both reads and writes, delivered consistently. Notably, the CM9-R degraded gradually and predictably across its passes rather than swinging, showing the same steadiness as its GDS write line, which is what checkpoint scheduling cares about once a drive is in the rotation. Buyers who need the checkpoint burst should look at the Micron 9550 family or wait for the CM9-V mixed-use sibling.

Conclusion

The KIOXIA CM9-R 15.36TB is the first enterprise-class SSD with BiCS8, tested at the capacity point where the series delivers its best write performance, and our data gives it clear framing: the lowest low-queue-depth latency in the comparison group across every workload we ran. At queue depth 1, it led the field outright in 4K reads (33.6K IOPS at 29.3 µs), 4K writes (115.8K IOPS at 8.2 µs), 16K sequential writes (10.4 µs single-worker), and 64K reads (1,359.0 MB/s at 45.6 µs), and it reached its 64K read peak at a fraction of the concurrency its rivals required. In GPU Direct Storage, it produced the group’s best small-block read IOPS at 136.4K and the most stable sustained write line on the bench, peaking at 5.51 GiB/s, without the high-thread volatility seen in several competitors.

Rear label side of the KIOXIA CM9-R E3.S SSD standing on the StorageReview bench in front of the lab rack

The group’s lowest queue-depth-1 latency across all workloads we ran was 25W (typical).

The deep-queue 4K read peak of 1,973.4K IOPS sat seventh of eight in our sweep (KIOXIA’s 3,400K rating is measured at queue depths beyond our test ceiling, but rivals found more inside the same sweep), and the single-worker 128K sequential read of 9,974.6 MB/s was the one result off from its rating.

For latency-sensitive read tiers, OLTP frontends, virtualized estates on dual-port HA infrastructure, and read-heavy AI serving where response time at real-world queue depths matters more than synthetic deep-queue peaks, the CM9-R is the strongest argument yet that BiCS8’s CBA design changes the class. Sustained heavy-write pipelines should look to the CM9-V or the mixed-use drives in this group. Everyone else gets the drive that answers fastest when it matters, in a capacity stack that runs to 30.72TB in E3.S and 61.44TB in 2.5-inch.
The CM9-R’s queue-depth-1 sweep also earned it a leaderboard spot: it now holds Best for Latency-Critical Workloads on our Best Enterprise SSDs page.

KIOXIA CM9-R E3.S Product Page

The post KIOXIA CM9-R 15.36TB Review: BiCS8 Flash Hits Full Speed at Low Queue Depths appeared first on StorageReview.com.

Solidigm D7-PS1030 Review: 3 DWPD Gen5 That Earned Its Keep in the KV Cache Tier

31 August 2026 at 20:20
Solidigm D7-PS1030 12.8TB E3.S SSD standing upright in the StorageReview lab Solidigm D7-PS1030 12.8TB E3.S SSD standing upright in the StorageReview lab

The Solidigm D7-PS1030 is the mid-endurance arm of the company’s first PCIe 5.0 data center family, pairing the platform it shares with the D7-PS1010 with a 3 DWPD rating and a random write ceiling of up to 800K IOPS, double the 400K of its standard-endurance sibling. The family ranges from 1.6TB to 12.8TB across E3.S and U.2, using 176-layer TLC NAND, with rated performance up to 14,500 MB/s sequential read and 10,000 MB/s sequential write. Solidigm targets write-centric and mixed workloads: OLTP, metadata logging, HPC, and AI/ML pipelines where write pressure never lets up. Our review unit is the 12.8TB E3.S model.

Solidigm D7-PS1030 12.8TB E3.S SSD standing upright in the StorageReview lab

The Solidigm D7-PS1030 12.8TB in an E3.S 7.5mm body.

This is not our first time with this drive; however, it is the first time a single drive has been benchmarked. Eight of these same 12.8TB units carried the flash tier in our KV cache offload work on the Dell PowerEdge XE7740, where the array sustained 1.9GB/s of continuous KV writes around the clock, a duty cycle that works out to roughly 3.2 drive writes per day per drive under mirroring, or about 1.6 DWPD striped as RAID0. That is exactly the bracket the PS1030’s 3 DWPD rating is built to straddle: KV offload is a workload where endurance, not capacity or peak speed, is the defining constraint of the tier. The read-intensive class that dominates Gen5 headlines would burn through its 1 DWPD budget quickly with that duty.

Solidigm D7-PS1030 12.8TB E3.S SSD standing in front of the Dell PowerEdge XE7740 in the StorageReview lab

The PS1030 in front of the Dell PowerEdge XE7740 that hosted our KV cache offload testing.

At 12.8TB, Solidigm rates the drive at 2.75 million 4K random read IOPS and a full 800K random write IOPS, with the family’s 3.1M random read peak living lower in the capacity stack. Active power is 23W typical and 5W idle, in line with the Gen5 field, with five configurable power states from 5W to 25W for operators working against a fixed rack budget. Solidigm also makes two additional claims worth noting: up to 70% better energy efficiency than comparable drives, and up to 90% IOPS consistency across the life of the drive. Endurance can also be spent faster over shorter horizons; the same media supports 4.98 DWPD over a three-year period, and the 12.8TB model is rated for 70PB written either way. Reliability specs are in line with the class: 2.5-million-hour MTBF, a five-year warranty, and a UBER Solidigm test to 1E-18. Security options include TCG Opal 2.02 SED trim, FIPS 140-3 Level 2-certifiable hardware, OCP-standard secure boot and firmware signing, plus device attestation and key revocation.

Solidigm D7-PS1030 E3.S drive in its caddy showing the EDSFF edge connector

In the E3.S Dell caddy.

Solidigm D7-PS1030 Specifications

Specification Solidigm D7-PS1030 (12.8TB E3.S, family range noted)
Platform Overview
Capacities 1.6TB
3.2TB
6.4TB
12.8TB (as tested)
Form Factors E3.S 7.5mm (as tested)
U.2 15mm
Interface / Protocol PCIe 5.0 x4, NVMe
NAND Solidigm 176-layer TLC 3D NAND
Performance (Up To, Vendor Rated)
Sequential Read (128K) 14,500 MB/s (family)
Sequential Write (128K) 10,000 MB/s (family)
Random Read (4K) 2,750K IOPS (12.8TB)
Up to 3,100K IOPS (family peak)
Random Write (4K) 800K IOPS
Power and Endurance
Power (Active / Idle) 23W typ. / 5W typ.
Five configurable power states, 5W to 25W
Endurance 3.0 DWPD (5-year basis)
4.98 DWPD (3-year basis)
70 PBW at 12.8TB
Reliability and Security
MTBF / UBER 2,500,000 hours
Tested to 1E-18
Security TCG Opal 2.02 (SED variant)
FIPS 140-3 Level 2 certifiable
OCP-standard Secure Boot and firmware signing
Device attestation, key revocation
Warranty 5 Years


Two Solidigm D7-PS1030 drives, one mounted in an E3.S sled, in front of the StorageReview server rack

PS1030 units in E3.S; the family also ships in U.2.

Solidigm D7-PS1030 Performance

The context for the charts that follow is that the PS1030 lands in our comparison field as the mixed-use counterweight to the read-intensive drives that have driven recent Gen5 coverage. Against the KIOXIA CD9P-R we reviewed in June, the PS1030 gives up rated sequential read (14,500 vs 14,800 MB/s) but nearly doubles rated random write (800K vs 450K IOPS) and triples the write budget (3 vs 1 DWPD). Its closest philosophical rival in the group is the Micron 7600 MAX, the other 3 DWPD drive in the field, with the Micron 9550 MAX bringing the performance-tier mixed-use fight at the same 12.8TB capacity as our unit.

Drive Testing Platform

We use a Dell PowerEdge R760 running Ubuntu 22.04.2 LTS as our test platform for all workloads in this review. Equipped with a Serial Cables Gen5 JBOF, it offers wide compatibility with U.2, E1.S, E3.S, and M.2 SSDs. Our system configuration is outlined below:

  • 2 x Intel Xeon Gold 6430 (32-Core, 2.1GHz)
  • 16 x 64GB DDR5-4400
  • 480GB Dell BOSS SSD
  • Serial Cables Gen5 JBOF
  • NVIDIA L4

Drives Compared

DLIO Checkpointing Benchmark

To evaluate SSD real-world performance in AI training environments, we utilized the Data and Learning Input/Output (DLIO) benchmark tool. Developed by Argonne National Laboratory, DLIO is specifically designed to test I/O patterns in deep learning workloads. It provides insights into how storage systems handle challenges such as checkpointing, data ingestion, and model training.

The table below shows each drive’s average checkpoint completion time across three passes; lower is better. One note on this data: the number of checkpoints in a run scales with each drive’s capacity, so larger drives log more checkpoints, and per-checkpoint results are not aligned point for point across drives of different sizes. That is why we publish pass averages, which normalize each drive’s run into a directly comparable figure. When training machine learning models, checkpoints are essential for periodically saving the model’s state, preventing loss of progress during interruptions or power failures. This storage demand requires robust performance, especially under sustained or intensive workloads. We used the DLIO benchmark version 2.0 from the August 13, 2024, release.

To ensure our benchmarking reflected real-world scenarios, we based our testing on the LLAMA 3.1 405B model architecture. We implemented checkpointing using torch.save() to capture model parameters, optimizer states, and layer states. Our setup simulated an eight-GPU system, implementing a hybrid parallelism strategy with 4-way tensor parallelism and 2-way pipeline parallel processing distributed across the eight GPUs. This configuration yielded a checkpoint size of 1,636GB, reflecting the requirements of training modern large language models.

Drive Pass 1 Average (seconds) Pass 2 Average (seconds) Pass 3 Average (seconds)
SanDisk DC SN861 7.68TB 461.3 558.6 553.3
Micron 9550 MAX 12.8TB 462.8 558.9 555.3
Micron 9550 Pro 7.68TB 461.4 577.9 559.7
Solidigm PS1010 7.68TB 458.8 561.1 564.6
Micron 7600 MAX 6.4TB 464.2 581.5 567.3
KIOXIA CD9P-R 7.68TB 464.7 575.6 570.6
KIOXIA CM9-R 15.36TB 462.8 571.9 580.9
Solidigm PS1030 12.8TB 462.3 578.0 599.2


Looking at the pass averages, the Solidigm PS1030 opened right in the pack at 462.3 seconds in Pass 1, where the entire comparison group landed within a seven-second band of roughly 459 to 465 seconds. The separation came later. In Pass 2 the PS1030 stepped up to 578.0 seconds, in the upper portion of a field that ranged from the SanDisk SN861’s 558.6 to the Micron 7600 MAX’s 581.5 seconds, and by Pass 3 it had drifted to 599.2 seconds, the highest average in the comparison group, with the rest of the field settling between the SN861’s 553.3 and the KIOXIA CM9-R’s 580.9 seconds.

Solidigm PS1030 DLIO Checkpoints

The PS1030’s own checkpoint log shows the shape of that drift. The PS1030 opened at 465.3 seconds and held near 461 seconds through checkpoint 5 before stepping up. Once it transitioned, it ranged from roughly 553 to 593 seconds, closed checkpoint 12 at 614.7 seconds, and its latest checkpoints reached as high as 629.0 seconds. The result is consistent with the drive’s one established weakness rather than a new one: DLIO checkpointing is exactly the kind of large sequential write burst that the 128K single-worker FIO test flagged. The gap is real but bounded, about 5% against the KIOXIA CD9P-R on Pass 3 averages, and the PS1030 scaled predictably across passes rather than swinging.

FIO Performance Benchmark

To measure the storage performance of each SSD across common industry metrics, we leverage FIO. Each drive undergoes the same testing process, which includes a preconditioning step of two full drive fills with a sequential write workload, followed by steady-state performance measurement. As each workload type being measured changes, we run another preconditioning fill of that new transfer size.

In this section, we focus on the following FIO benchmarks:

  • 128K Sequential
  • 64K Random
  • 16K Sequential
  • 4K Random

128K Sequential Write (IODepth 16 / NumJobs 1)

FIO 128K sequential write bandwidth bar chart comparing the Solidigm D7-PS1030, KIOXIA CM9-R, and six other Gen5 enterprise SSDs FIO 128K sequential write average latency bar chart for the Solidigm D7-PS1030, KIOXIA CM9-R, and six other Gen5 enterprise SSDs

The steady-state 128K sequential write test is the one area where the PS1030 shows some weakness compared to the other SSDs. The drive posted 6,370.3 MB/s at 313.7 µs, the lowest bandwidth and highest latency in the group, trailing even the read-intensive KIOXIA CD9P-R at 6,912.4 MB/s. The Micron 9550 MAX led at 10,957.9 MB/s, with the 9550 Pro at 10,354.6 MB/s, and the KIOXIA CM9-R took a clear third at 8,668.1 MB/s. The PS1030’s sibling, the PS1010 (7,126.5 MB/s), and the SanDisk DC SN861 (7,116.5 MB/s) occupied the middle, with the Micron 7600 MAX at 6,960.6 MB/s.

Worth keeping in frame: this is a single-job workload, and the PS1030’s write architecture is built to spread work, not to win one stream. The random write sections below show the same drive moving far more data once parallelism is introduced, which matches the access pattern that its target workloads generate.

128K Sequential Read (IODepth 64 / NumJobs 1)

FIO 128K sequential read bandwidth bar chart comparing the Solidigm D7-PS1030, KIOXIA CM9-R, and six other Gen5 enterprise SSDs FIO 128K sequential read average latency bar chart for the Solidigm D7-PS1030, KIOXIA CM9-R, and six other Gen5 enterprise SSDs

The read side flipped the script. The PS1030 delivered 14,156.4 MB/s at 564.8 µs, effectively tied with its PS1010 sibling (14,163.3 MB/s) and within 0.6% of the group-leading CD9P-R (14,235.9 MB/s). The Micron 9550 Pro (14,050.1 MB/s) and 9550 MAX (14,047.5 MB/s) completed the pack of five drives, saturating the Gen5 interface within a 200 MB/s band. The SN861 followed at 12,631.2 MB/s, the 7600 MAX at 11,240.5 MB/s, and the CM9-R, so strong in the write test, came in last here at 9,974.6 MB/s in this single-job configuration. For a drive sold on its write budget, giving up nothing on big-block reads is the quiet win in this chart.

64K Random Write

FIO 64K random write bandwidth line chart across queue depth and job combinations for the Solidigm D7-PS1030, KIOXIA CM9-R, and six other Gen5 enterprise SSDs FIO 64K random write average latency line chart for the Solidigm D7-PS1030, KIOXIA CM9-R, and six other Gen5 enterprise SSDs

The 64K random write sweep is where the PS1030’s character shows. The drive peaked at 7,224.0 MB/s, fourth in the group behind the Micron 9550 MAX (10,878.1 MB/s), KIOXIA CM9-R (9,635.3 MB/s), and Micron 9550 Pro (9,069.4 MB/s), and ahead of the Micron 7600 MAX (6,960.5 MB/s) and the rest of the field. What sets the PS1030 apart is where that peak occurred: at IODepth 2 / NumJobs 2, with just 34.3 µs of latency, while most of the field needed deep queues to reach their best numbers. The drive saturates almost immediately and then stays flat for the rest of the sweep, which is exactly the profile you want for a steady-state write tier running at moderate concurrency around the clock. The gap to its sibling is also the endurance tier earning its keep on performance terms: the PS1010 peaked at 5,873.9 MB/s, 23% below the PS1030.

On latency, the PS1030 opened at 21.1 µs at IODepth 1 / NumJobs 1, second only to the CM9-R’s 18.4 µs, and its worst point in the entire sweep was 2,831 µs, less than half the PS1010’s 5,987 µs spike. The 9550 MAX remained the most controlled at high concurrency, topping out at 1,714 µs.

64K Random Read

FIO 64K random read bandwidth line chart across queue depth and job combinations for the Solidigm D7-PS1030, KIOXIA CM9-R, and six other Gen5 enterprise SSDs FIO 64K random read average latency line chart for the Solidigm D7-PS1030, KIOXIA CM9-R, and six other Gen5 enterprise SSDs

The PS1030 took the group’s best 64K random read peak at 14,162.9 MB/s (IODepth 32 / NumJobs 8), a hair ahead of the Micron 9550 Pro (14,049.9 MB/s), 9550 MAX (14,049.7 MB/s), and PS1010 (14,013.6 MB/s), with the CM9-R at 13,402.4 MB/s and the CD9P-R at 12,036.0 MB/s further back. The low-queue-depth story belongs to the KIOXIA drives, as it did in our CD9P-R review: the CM9-R opened at 1,359.0 MB/s and the CD9P-R at 1,334.0 MB/s at IODepth 1 / NumJobs 1, roughly 45 µs latency territory, while the PS1030 started at 768.4 MB/s and 81.0 µs, mid-pack. The PS1030 ranks at the top of this chart for scaling, not for single-stream response.

16K Sequential Write

A note on the test itself: beginning with this comparison group, our 16K coverage is sequential rather than random, a workload we first broke out in our Micron 9550 MAX review. Mid-size sequential streams better represent what these drives do in production, especially in AI pipelines, which stream ordered training data in, stage intermediate results out, and feed inference tiers in runs rather than scattering random hits across the drive.

FIO 16K sequential write bandwidth line chart across queue depth and job combinations for the Solidigm D7-PS1030, KIOXIA CM9-R, and six other Gen5 enterprise SSDs FIO 16K sequential write average latency line chart for the Solidigm D7-PS1030, KIOXIA CM9-R, and six other Gen5 enterprise SSDs

The results reshuffle the field compared to the random sweeps. The Micron 9550 MAX led at 10,970.8 MB/s (IODepth 32 / NumJobs 4), with the KIOXIA CM9-R nearly matching it at 10,812.2 MB/s and the 9550 Pro third at 9,772.8 MB/s. The PS1030 peaked at 5,977.7 MB/s (IODepth 8 / NumJobs 4), seventh in the group, ahead of the SanDisk DC SN861 at 5,772.5 MB/s and just under its PS1010 sibling at 6,271.7 MB/s. The shape of the sweep, though, is the same signature the random tests showed: the PS1030 was already at 5,856.7 MB/s by IODepth 2 / NumJobs 4 with 21.1 µs of latency, then held a flat band between roughly 4,700 and 6,000 MB/s across the rest of the matrix. Its single-worker latency of 10.9 µs sat in the leading cluster with the CM9-R (10.4 µs) and CD9P-R (11.0 µs), well under the Microns at 15.1 to 17.8 µs. The ceiling is modest for a drive with a write-focused brief, but it arrives at minimal queue depth and microsecond-class latency, the operating point where a sustained cache or staging tier lives, and the same profile that carried this drive through weeks of continuous sequential write streams in our KV cache deployment.

16K Sequential Read

FIO 16K sequential read bandwidth line chart across queue depth and job combinations for the Solidigm D7-PS1030, KIOXIA CM9-R, and six other Gen5 enterprise SSDs FIO 16K sequential read average latency line chart for the Solidigm D7-PS1030, KIOXIA CM9-R, and six other Gen5 enterprise SSDs

On the read side, the KIOXIA CD9P-R led at 13,819.7 MB/s, with the CM9-R at 13,393.2 MB/s and the Micron 9550 Pro at 13,273.5 MB/s close behind. The PS1030 peaked at 11,142.8 MB/s (IODepth 16 / NumJobs 8) at 179.1 µs, seventh in the group, ahead of only the SN861 at 10,995.0 MB/s and just behind its sibling at 11,656.3 MB/s, about a fifth off the group lead. The single-stream picture also inverts the random-read story: on ordered 16K reads, the SN861 opened at 12.5 µs and the Microns between 13.9 and 21.3 µs, while the Solidigm platform started near 59 µs, the same low-concurrency read trait both PS-series drives showed at 64K. Mid-size reads remain the corner of the matrix where this platform gives the most away; the streaming-read side of an AI pipeline is better served by the read-intensive class, which is not the argument this drive was built to win.

4K Random Write

FIO 4K random write IOPS line chart across queue depth and job combinations for the Solidigm D7-PS1030, KIOXIA CM9-R, and six other Gen5 enterprise SSDs FIO 4K random write average latency line chart for the Solidigm D7-PS1030, KIOXIA CM9-R, and six other Gen5 enterprise SSDs

The headline chart for a 3 DWPD drive, and the PS1030 delivered. Its peak of 1,595.8K IOPS at IODepth 16 / NumJobs 8 was second in the group, behind only the fellow 3 DWPD Micron 7600 MAX at 1,781.2K, and ahead of the 9550 MAX (1,544.2K), PS1010 (1,504.7K), CM9-R (1,502.9K), 9550 Pro (1,467.6K), SN861 (1,438.3K), and CD9P-R (1,273.1K). That measured peak is also double the drive’s 800K rated figure, which Solidigm specs at a fixed queue depth; steady-state sweeps find more.

Latency behavior seals the argument. The PS1030 opened at 8.8 µs at IODepth 1, in the leading cluster with the CM9-R (8.2 µs) and PS1010 (8.3 µs), reached its peak throughput at just 79.8 µs, and never exceeded 359.6 µs anywhere in the sweep. The PS1010, by contrast, needed IODepth 32 / NumJobs 16 to reach a peak of 339.7 µs, on the way to a 735.6 µs worst case. For the OLTP logs and KV-cache-style traffic this drive is aimed at, small writes in the single-digit microseconds, with a sub-400 µs ceiling, are the profile that matters.

4K Random Read

FIO 4K random read IOPS line chart across queue depth and job combinations for the Solidigm D7-PS1030, KIOXIA CM9-R, and six other Gen5 enterprise SSDs FIO 4K random read average latency line chart for the Solidigm D7-PS1030, KIOXIA CM9-R, and six other Gen5 enterprise SSDs

The PS1030 backed up its write showing with the group’s second-best 4K random read peak: 2,255.8K IOPS at IODepth 16 / NumJobs 16 and 112.8 µs, behind the SanDisk SN861’s 2,555.6K IOPS and ahead of the Micron 9550 MAX (2,217.6K IOPS) and CD9P-R (2,165.0K IOPS). At IODepth 1 / NumJobs 1, the KIOXIA low-latency signature led again: the CM9-R at 29.3 µs and CD9P-R at 30.4 µs, but the PS1030’s 56.8 µs was the best of the rest, edging its sibling and both 9550s (roughly 65 µs) and the SN861 (67.8 µs). A mixed-use drive that lands second in both 4K read and 4K write peaks in a field this read-heavy is covering both halves of its job description.

GPU Direct Storage

One of the tests we conducted on this testbench was the Magnum IO GPU Direct Storage (GDS) test. GDS is a feature developed by NVIDIA that allows GPUs to bypass the CPU when accessing data stored on NVMe drives or other high-speed storage devices. Instead of routing data through the CPU and system memory, GDS enables direct communication between the GPU and the storage device, significantly reducing latency and improving data throughput.

How GPU Direct Storage Works

Traditionally, when a GPU processes data stored on an NVMe drive, the data must first travel through the CPU and system memory before reaching the GPU. This process introduces bottlenecks, as the CPU acts as an intermediary, adding latency and consuming valuable system resources. GPU Direct Storage eliminates this inefficiency by enabling the GPU to access data directly from the storage device via the PCIe bus. This direct path reduces data-movement overhead, enabling faster, more efficient data transfers.

AI workloads, especially those involving deep learning, are highly data-intensive. Training large neural networks requires processing terabytes of data, and any delay in data transfer can lead to underutilized GPUs and longer training times. GPU Direct Storage addresses this challenge by ensuring that data is delivered to the GPU as quickly as possible, minimizing idle time and maximizing computational efficiency.

In addition, GDS is particularly beneficial for workloads that involve streaming large datasets, such as video processing, natural language processing, or real-time inference. By reducing the reliance on the CPU, GDS accelerates data movement and frees up CPU resources for other tasks, further enhancing overall system performance.

GDSIO Sequential Read Throughput

GDSIO sequential read throughput line chart across 16K, 128K, and 1M block sizes for the Solidigm D7-PS1030, KIOXIA CM9-R, and six other Gen5 enterprise SSDs GDSIO sequential read average latency line chart across 16K, 128K, and 1M block sizes for the Solidigm D7-PS1030, KIOXIA CM9-R, and six other Gen5 enterprise SSDs

In the 16K block-size segment, the PS1030 opened at approximately 0.2 GiB/s on a single thread, the lowest entry point in the group, consistent with its 71.6 µs single-thread GDS read latency (its sibling posted 71.1 µs, the same platform trait we flagged in the CD9P-R review). It scaled steadily into the pack through the mid-range, finishing the segment around 1.6 GiB/s at 16K/128 while the KIOXIA pair held the segment lead near 2.0 GiB/s. The KIOXIA drives’ thread-scaling advantage carried through the 128K segment as well, with the CD9P-R and CM9-R pulling away through 128K/16 while the PS1030 tracked the main group, reaching approximately 4.7 GiB/s at 128K/64 and 5.0 GiB/s at 128K/128.

In the 1M segment, the field converged. The PS1030 climbed to its peak of 5.95 GiB/s (1M/32), within 3.5% of the group-best 6.16 GiB/s from the CD9P-R, with the CM9-R at 6.06, the PS1010 and 9550 MAX at 6.05, and the 9550 Pro at 5.97 GiB/s. The 7600 MAX came in last at 5.59 GiB/s. At peak 16K IOPS, the KIOXIA pair led (136.4K for the CM9-R, 134.2K for the CD9P-R), while the PS1030’s 101.2K was the group’s lowest; small-block GPU-direct reads are simply not this platform’s strength.

GDSIO Sequential Write Throughput

GDSIO sequential write throughput line chart across 16K, 128K, and 1M block sizes for the Solidigm D7-PS1030, KIOXIA CM9-R, and six other Gen5 enterprise SSDs GDSIO sequential write average latency line chart across 16K, 128K, and 1M block sizes for the Solidigm D7-PS1030, KIOXIA CM9-R, and six other Gen5 enterprise SSDs

The write sweep is the chart PS1030 buyers should study, because it contains both the drive’s best manners and its one real anomaly. In the 16K segment, all eight drives tracked together in the 0.5 to 1.5 GiB/s band, and the PS1030’s single-thread write latency of 22.3 µs sat in the leading cluster with the two KIOXIA drives (21.4 µs each) and its sibling (21.9 µs). In the 128K segment, the PS1030 scaled cleanly to approximately 3.95 GiB/s at 128K/32, then fell off a cliff: roughly 2.35 GiB/s at 128K/64 and 1.55 GiB/s at 128K/128, less than a third of the segment leaders’ performance. This is the same high-thread-count write collapse we documented on the PS1010 in the CD9P-R review, reproduced almost point-for-point on the PS1030 (the PS1010 fell to 2.5, then 1.65 GiB/s at the same marks). Whatever sits behind it lives in the platform, not the endurance tier, and it remains the most significant blemish in the dataset.

The 1M segment softened but did not erase the pattern. The PS1030 peaked at 4.22 GiB/s (1M/8), ahead of only its sibling’s 4.17 GiB/s, and drifted down to roughly 3.35 GiB/s at 1M/128 while the CM9-R held the most stable line in the group toward its 5.51 GiB/s peak, and the 9550 MAX hit the highest peak at 5.69 GiB/s with its own documented volatility, dipping near 2.2 GiB/s at 1M/64. The 9550 Pro (5.54), 7600 MAX (5.44), CD9P-R (4.86), and SN861 (4.59 GiB/s) filled out the order. The saving grace for the PS1030’s target buyer: KV cache and log-style tiers write at moderate thread counts per drive, where the PS1030 behaves impeccably, not at the 64-plus GPU-direct write threads where the collapse lives. Our own KV cache deployment ran eight of these drives for weeks without the array ever approaching the bottleneck. But anyone planning heavy multi-threaded GDS write streaming onto this platform should benchmark their exact pattern first.

Conclusion

The Solidigm D7-PS1030 does what a mid-endurance Gen5 drive is supposed to do, and the data shows a drive with a distinct skill set. Its signature is parallel small-block work: second in the group in both 4K random write (1,595.8K IOPS, behind only the fellow 3 DWPD Micron 7600 MAX) and 4K random read (2,255.8K IOPS), the group’s best 64K random read at 14,162.9 MB/s, and full Gen5 line rate on 128K sequential reads at 14,156.4 MB/s. Just as interesting is how it gets there: peaks at IODepth 2 or NumJobs 8 with latency in the tens of microseconds, where competitors need deep queues and pay for them in latency. The drive saturates early, holds flat, and keeps its worst-case write latency at half that of its PS1010 sibling.

Dell PowerEdge XE7740 E3.S drive tray loaded with Solidigm D7-PS1030 SSDs, two drives standing upright, in the StorageReview lab

The XE7740 bay that hosted the eight-drive PS1030 tier in our KV cache offload work.

There are trade-offs, however. Single-worker 128K sequential writes landed last in the group at 6,370.3 MB/s, and DLIO checkpointing, which stresses exactly that pattern, ran to the group’s highest Pass 3 average at 599.2 seconds. The 16K sequential tests also trailed the field on both sides, with the write peak of 5,977.7 MB/s and read peak of 11,142.8 MB/s each landing seventh of eight. The GDSIO write sweep reproduced the PS1010’s high-thread 128K drop nearly point-for-point, confirming it as a platform behavior rather than a one-off, and small-block GPU-direct reads favor the KIOXIA drives by a wide margin. None of this undermines the drive’s brief, but it does highlight it: the PS1030 is not the drive for single-stream ingest.

What it is built for, it has already proven in longer form than any bench run. Eight of these drives spent weeks as the KV cache offload tier in our XE7740 inference work, absorbing 1.9 GB/s of sustained, around-the-clock writes at a duty cycle that brushed past their 3 DWPD rating, and the tier never became the bottleneck. The bench data explains why that worked: early-saturating write behavior, single-digit-microsecond 4K write latency at low queue depths, and a controlled latency ceiling are exactly the traits a continuously written cache or log tier rewards. Endurance-bound, latency-sensitive, moderately concurrent write workloads, KV cache offload, OLTP logging, and metadata tiers are where the PS1030 belongs, and where its 3 DWPD budget and 4.98 DWPD three-year option let it run duty cycles that would disqualify the read-intensive class.

Solidigm D7-PS1030 Product Page

The post Solidigm D7-PS1030 Review: 3 DWPD Gen5 That Earned Its Keep in the KV Cache Tier appeared first on StorageReview.com.

Samsung’s Newest 990 SSD lineup In The 1TB & 2TB Capacities Are Now Up To 36% Off On Amazon And Can Reach Speeds Of Up To 7,150MB/s, Starting from $199.99

26 August 2026 at 18:25

Samsung's 990 SSD lineup is up to 36 percent off on Amazon

A new addition to Samsung’s M.2 NVMe SSD lineup after the 990 EVO series is the 990 EVO Plus, which offers the same advantages for those looking for Gen 4 drives, but none of the premium that you are forced to fork over. In the middle of the DRAM shortage, solid-state drives have become ludicrously expensive, but you can still get the 1TB and 2TB capacities, starting from $199.99 on Amazon, with the discount going as high as 36 percent. To maintain performance, both of Samsung’s 1TB and 2TB 990 SSDs utilize HMB technology While getting your hands on a […]

Read full article at https://wccftech.com/samsung-990-ssd-1tb-2tb-amazon-deal-discount/

Samsung’s First USB4 Portable SSDs, P7 and P9, Offer Top Performance, Rugged Design, and Up to 8TB of Storage

By: Dong Ngo
26 August 2026 at 18:47
When it comes to portable SSDs, Samsung has been one of the biggest names, especially since Micron retired its Crucial consumer brand. However, up to now, the company has offered mostly USB 3.2 drives ranging from Gen 1 to Gen 2×2, with the latest being the T9. That’s about to ...

Continue Reading

One Crucial 4TB SSD Customer Stands Ground And Refuses Lousy $200 Refund Offered By Company; Perseverance Finally Results In A “Direct 1:1 Replacement”

25 August 2026 at 23:27

Crucial 4TB SSD customer refuses $200 refund and gets a replacement solid-state drive in the end

As Micron has made plans to exit the consumer SSD and RAM business, its Crucial brand is expected to fade into oblivion, meaning that customers will be left high and dry when seeking warranty replacements for their solid-state drives. One 4TB Crucial X9 external SSD ended up failing, prompting the owner to seek a replacement through the company’s RMA service. The storage manufacturer might have approved the RMA, but instead of offering a replacement drive, it offered the customer a $199.99 refund. Not wanting to settle for pennies, the owner wouldn’t budge until a replacement drive was shipped, and sure […]

Read full article at https://wccftech.com/crucial-4tb-ssd-customer-refuses-200-dollar-refund-gets-replacement/

SanDisk launches new high‑endurance NAS SSD lineup

20 August 2026 at 12:00

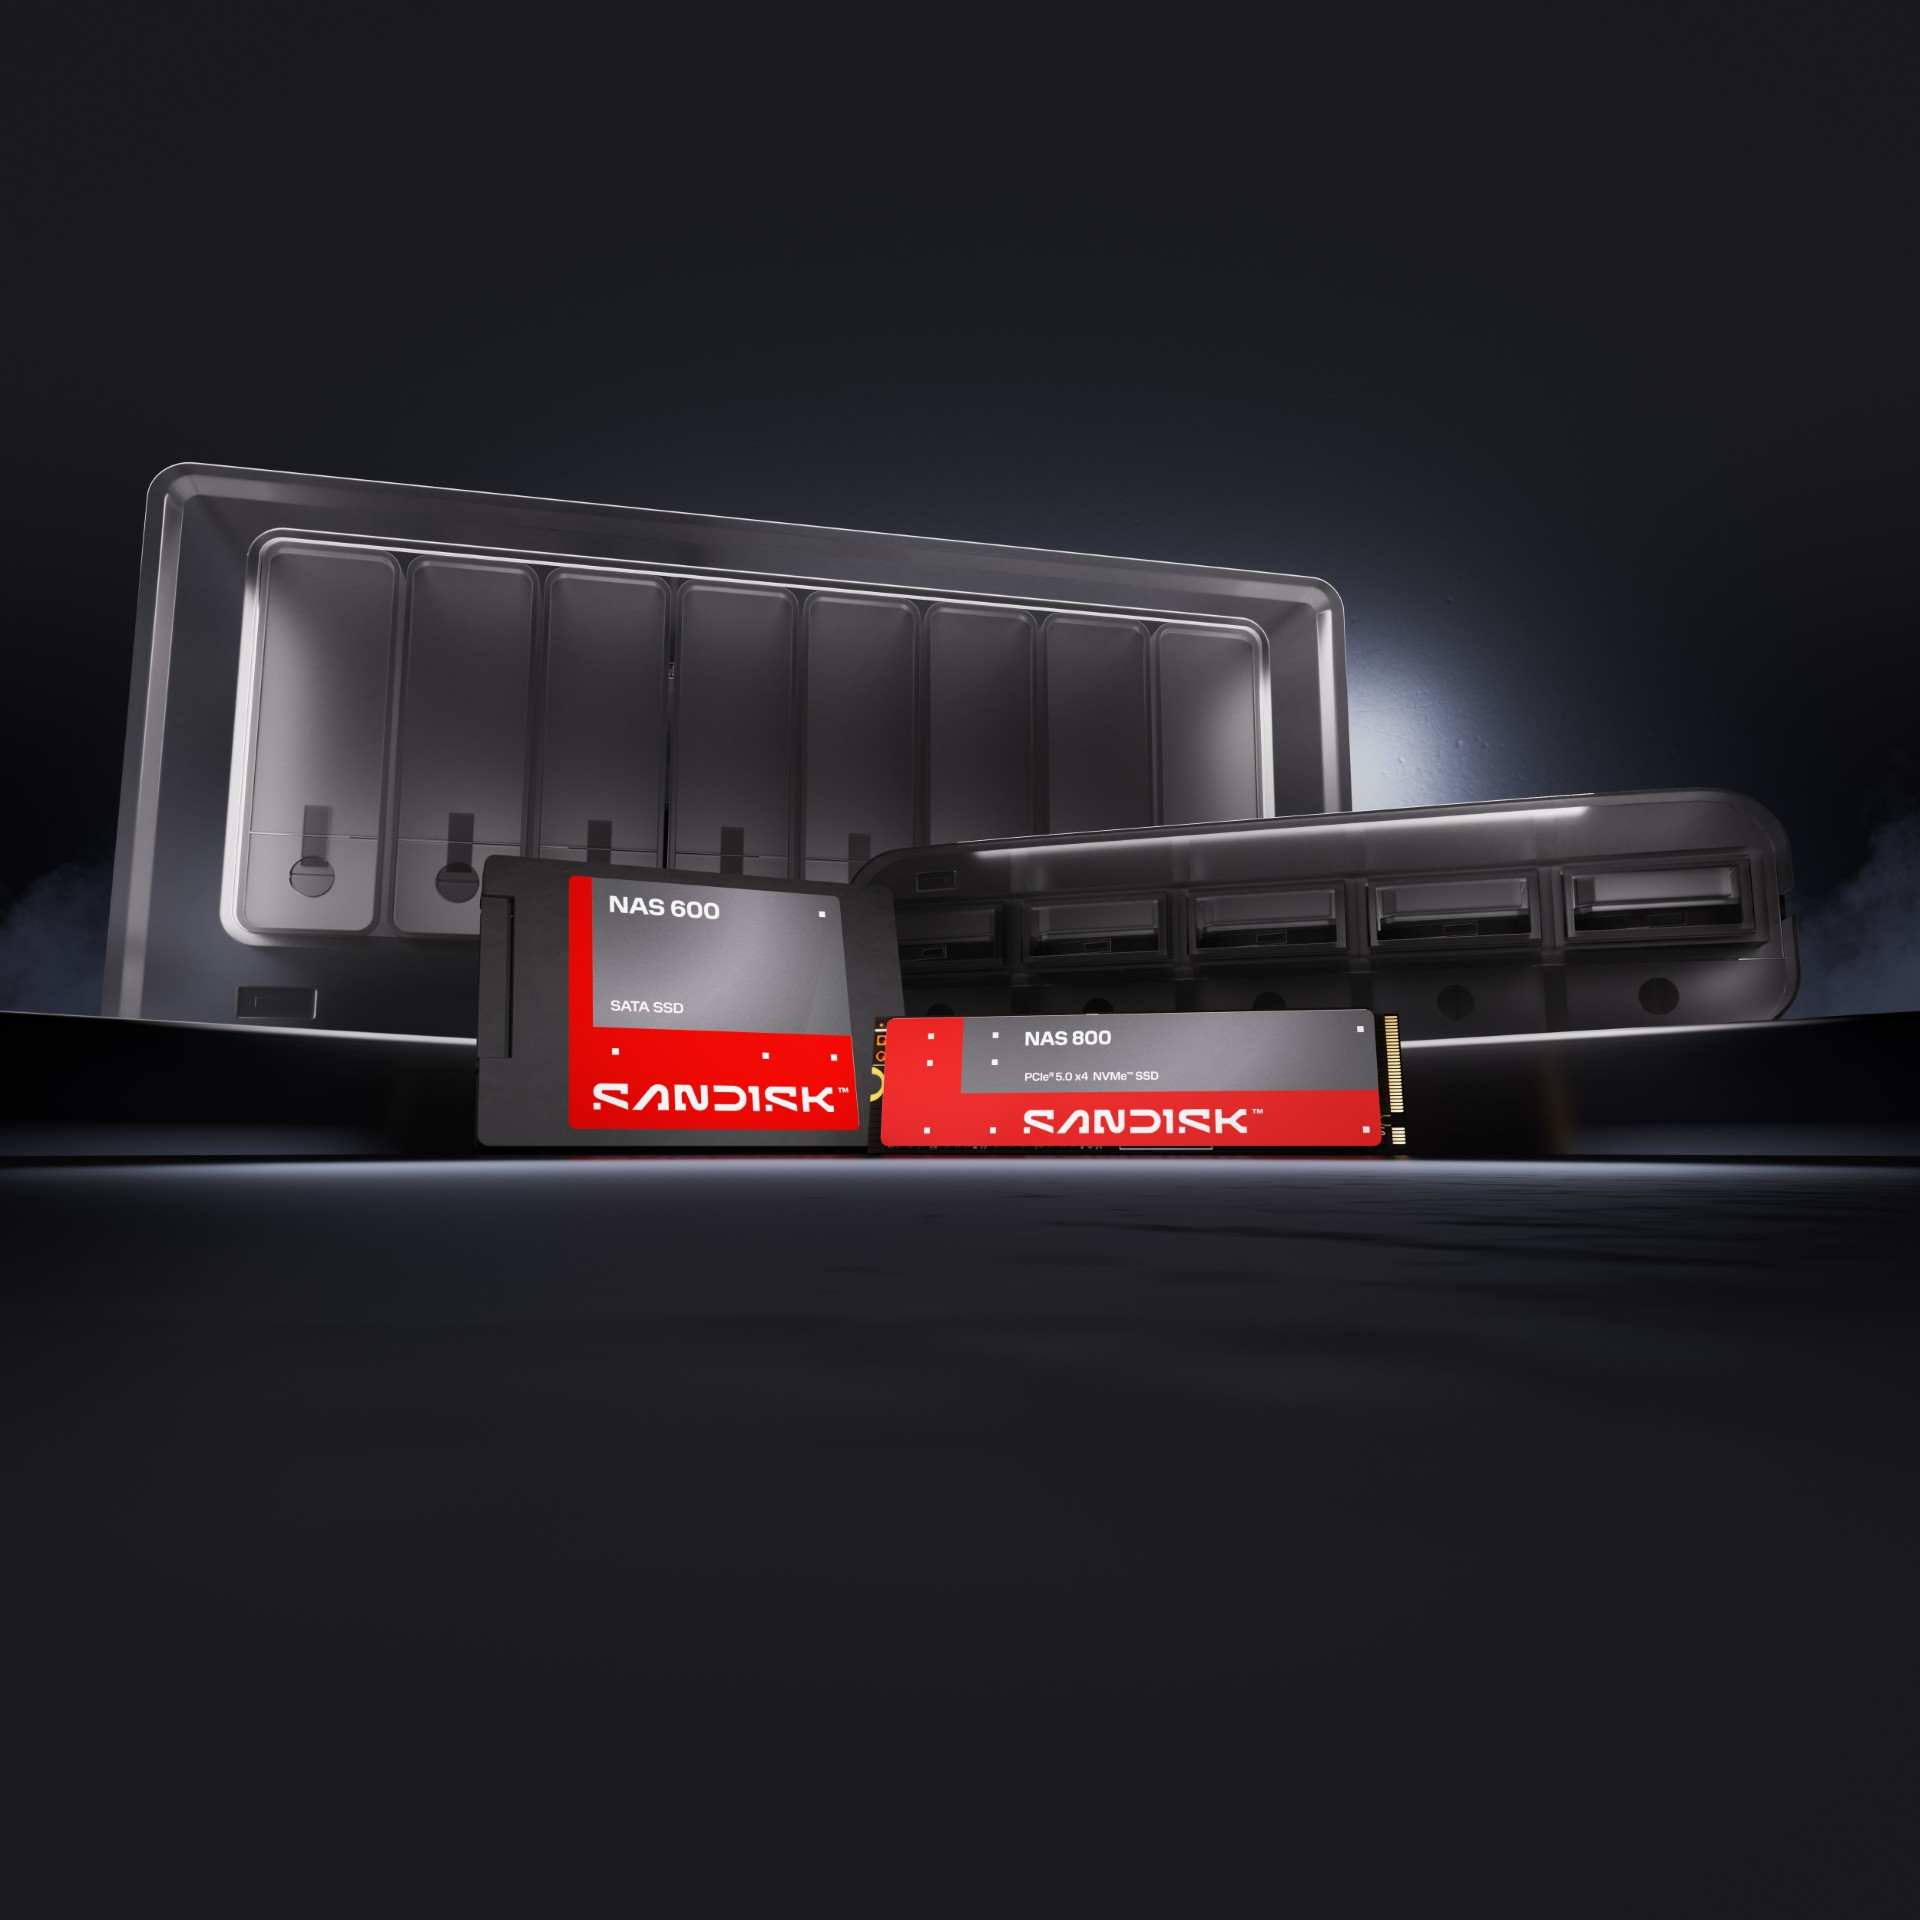
SanDisk has introduced a new NAS‑focused SSD portfolio aimed at prosumers and small businesses upgrading older NAS hardware or moving towards all‑flash deployments. The SanDisk NAS 600 SATA SSD and NAS 800 NVMe SSD are built for higher endurance, consistent performance and multi‑user workloads.

The NAS 600 SATA SSD targets users replacing HDDs or adding solid‑state caching to hybrid NAS systems. SanDisk lists endurance ratings up to 2500TBW on the 4TB model, with sequential read speeds up to 560MB/s. The 2.5‑inch SATA form factor fits NAS bays that support 2.5‑inch SSDs, offering quieter operation and more responsive performance for collaborative environments. Capacities range from 500GB to 4TB.

The NAS 800 NVMe SSD is designed for all‑flash or hybrid NAS setups running demanding workloads. Built on PCIe 5.0, it offers endurance ratings up to 14PBW (7.68TB model), up to 2.3M/2M random read/write IOPS and sequential speeds up to 14,900MB/s reads and 13,200MB/s writes. The drive uses the M.2 2280 form factor and will be available in capacities from 960GB to 7.68TB.

Both drives will be available this September through SanDisk.com and select retailers. UK pricing has not yet been confirmed, but US pricing starts at $179.99 for the NAS 600 SATA SSD (500GB) and $309.99 for the NAS 800 NVMe SSD (960GB).

KitGuru Says: SSD pricing has shifted a lot over the past year, and endurance‑focused NAS models continue to sit at the higher end of the market.

The post SanDisk launches new high‑endurance NAS SSD lineup first appeared on KitGuru.

SANDISK NAS Portfolio, Unveiled: Exciting SSDs for Network-Attached Storage

By: Dong Ngo
20 August 2026 at 18:07
Sandisk today announced its latest solid-state drives (SSDs), the first since it was split off from Western Digital: the SANDISK NAS 600 SATA SSD and SANDISK NAS 800 NVMe SSD. The two are part of the company’s all-new SANDISK NAS portfolio. While this is exciting news, keep in mind that ...

Continue Reading

Sandisk NAS 800 Brings PCIe 5.0 and 14,900MB/s to NAS, With the SATA NAS 600 Covering Legacy Bays

20 August 2026 at 18:53
Sandisk NAS 800 NVMe SSD, PCIe 5.0 M.2 2280 drive for all-flash NAS Sandisk NAS 800 NVMe SSD, PCIe 5.0 M.2 2280 drive for all-flash NAS

Sandisk has introduced two SSD families designed specifically for network-attached storage, covering both SATA-based systems and higher-performance NVMe NAS deployments. The Sandisk NAS 600 SATA SSD offers capacities up to 4TB and endurance up to 2,500 TBW, while the Sandisk NAS 800 NVMe SSD, a PCIe 5.0 drive, scales to 7.68TB with sequential read speeds up to 14,900MB/s and endurance up to 14 PBW.

The two drives address very different parts of the NAS market. The NAS 600 uses the familiar 2.5-inch SATA form factor and can replace hard drives or serve as a cache or storage tier in existing SATA-based systems. The NAS 800 is an M.2 2280 NVMe drive designed for all-flash and hybrid NAS configurations that require substantially higher throughput and I/O performance.

Both drives feature five-year limited warranties and are designed for extended operation in NAS environments.

Specification SANDISK NAS 600 SATA SSD SANDISK NAS 800 NVMe SSD
Form Factor 2.5″ SATA/7mm M.2 2280
Interface SATA III 6Gb/s PCIe 5.0 (NVMe)
Capacity 500GB, 1TB, 2TB, 4TB 960GB, 1.92TB, 3.84TB, 7.68TB
Endurance Up to 2,500 TBW [4TB model] Up to 14 PBW [7.68TB model]
Sequential Read/Write (MB/s) Up to 560/520MB/s [4TB model] Up to 14,900/13,200MB/s [1.92TB model]
Random Read/Write (IOPS) Up to 86K/77K IOPS [4TB model] Up to 2.3M/2M IOPS [3.84TB model]
MTTF 2.25M hours 1.75M hours
Warranty 5-year limited 5-year limited

Sandisk NAS 600 SATA SSD for HDD-Based NAS Upgrades

The Sandisk NAS 600 SATA SSD provides a direct solid-state option for NAS systems with conventional 2.5-inch SATA drive bays. Its 2.5-inch/7mm design means it can be installed in compatible systems without requiring an NVMe-capable NAS or M.2 storage slots. Sandisk is offering the NAS 600 in 500GB, 1TB, 2TB, and 4TB capacities. Performance tops out at sequential read and write speeds of 560MB/s and 520MB/s, respectively, on the 4TB model. Random performance reaches up to 86K IOPS reads and 77K IOPS writes.

SanDisk NAS 600 2

The 4TB NAS 600 is rated for up to 2,500 TBW and has an MTTF of 2.25 million hours. The higher endurance is designed for the frequent reads and writes common in NAS environments, including backups, file sharing, and media workloads.

Sandisk NAS 600 SATA SSD, 2.5-inch flash upgrade for NAS drive bays

The drive can serve several roles depending on the NAS configuration. In addition to replacing hard drives with solid-state storage, it can be used as an SSD cache or as part of a storage tier. This gives existing SATA-based NAS owners another option for adding flash storage without replacing the NAS itself.

Sandisk NAS 800 NVMe SSD for Higher-Performance NAS Workloads

The Sandisk NAS 800 NVMe SSD moves into a very different performance class, using a PCIe 5.0 M.2 2280 design and Sandisk TLC 3D NAND. Capacities include 960GB, 1.92TB, 3.84TB, and 7.68TB, providing all-flash and hybrid NAS configurations with ample capacity per M.2 slot.

Sandisk NAS 800 NVMe SSD, PCIe 5.0 M.2 2280 drive for all-flash NAS

Sequential read performance reaches up to 14,900MB/s, while sequential writes reach 13,200MB/s on the 1.92TB model. Random read and write performance tops out at 2.3 million and 2 million IOPS, respectively, on the 3.84TB model. This gives the NAS 800 a broader range of potential uses than caching alone. Sandisk lists primary storage and storage tiering alongside caching, with workloads including collaborative content creation, databases, virtualization, and AI applications.

The NAS 800 also has a substantially higher endurance rating than the SATA model, reaching up to 14 PBW with the 7.68TB version. Its MTTF rating is 1.75 million hours, and the drive features the same five-year limited warranty as the NAS 600.

Sandisk NAS 800 NVMe SSD M.2 2280 drive, rear label view

Sandisk rates the NAS 800 for continuous 24/7 NAS operation across a 0°C to 70°C operating range (85°C is its non-operating ceiling) and says the drive has been tested for compatibility across a range of NAS systems.

With the NAS 600 and NAS 800, Sandisk now covers both SATA-based NAS upgrades and higher-performance all-flash and hybrid systems. The NAS 600 gives existing SATA NAS users a flash option for primary storage, caching, or tiering, while the NAS 800 adds substantially higher throughput and endurance for more demanding NVMe-based storage workloads.

Availability

The Sandisk NAS 600 SATA and NAS 800 NVMe SSDs are slated for release sometime in September. Sandisk’s own store already lists pricing ahead of availability, showing the 500GB NAS 600 at $179.99 and the 7.68TB NAS 800 at $2,199.99, both marked down from list prices of $224.99 and $2,749.99. The NAS push also caps a busy month for Sandisk, which just taped out its first HBF memory die on the datacenter side.

The post Sandisk NAS 800 Brings PCIe 5.0 and 14,900MB/s to NAS, With the SATA NAS 600 Covering Legacy Bays appeared first on StorageReview.com.

A 4TB Samsung 870 EVO SATA III SSD Owner Shows How Good We Had It, In Less Than Three Years, The Price For The Exact Same Drive Has Jumped By 6x

18 August 2026 at 18:52

A 4TB Samsung 870 EVO owner shows how rapidly SSD prices have jumped

Getting your hands on a high-capacity and speedy 4TB SSD in 2026 for under $200 is a distant dream, as even 2TB drives are often priced at $300. In short, the DRAM shortage has ensured that the consumer market will remain miserable for quite some time, and to rub salt into the wound, one owner of Samsung’s 870 EVO in the 4TB capacity reveals that the drive he purchased for $169.99 back in 2023 is now available for six times the premium. The new price of the 870 EVO SSD is shown to touch $1,100, showing just how dire the situation […]

Read full article at https://wccftech.com/samsung-870-evo-4tb-ssd-price-hike-6x/

ASRock DeskMeet X300 Custom Build Puts Steam Machine To Shame As It Pushes Frame Rates Over 60 At 1440p For The Same Price

18 August 2026 at 15:42

A person holds a black DeskMeet mini PC featuring HDMI and several USB ports on the front panel.

Once again, a custom PC build beats the Steam Machine convincingly despite the rising costs. HUB Demonstrates How a $1050 DeskMeet X300-Based Custom PC Can Outperform Steam Machine for the Same Price Steam Machine itself isn't a bad product, but its high price makes it a poor value for gamers who are looking to maximize gaming performance on a budget. Since the disclosure of its official pricing, the device has been criticized and mocked, as users have come up with superior specifications for custom PC builds that can easily outperform this device. Since then, the price of components has witnessed […]

Read full article at https://wccftech.com/asrock-deskmeet-x300-custom-build-puts-steam-machine-to-shame/

Lexar Thor Ultra Brings Fast PCIe 5.0 SSD Performance

By: Bahleem
18 August 2026 at 11:50

Lexar has introduced its new Lexar Thor Ultra series of PCIe 5.0 NVMe SSDs, offering high speeds and several storage options for users who want faster PC performance.

The new Lexar Thor Ultra SSDs will be available in 512 GB, 1 TB, 2 TB, and 4 TB capacities. They use the M.2 2280 design and connect through a PCIe 5.0 x4 interface.

According to Lexar, the 1 TB, 2 TB, and 4 TB models can reach sequential read speeds of up to 11 GB/s and sequential write speeds of up to 10 GB/s. The smaller 512 GB version is slightly slower, with speeds of up to 9.9 GB/s for reading and 5 GB/s for writing.

Lexar Thor Ultra 1

Random performance can reach up to 2.2 million IOPS for reads and 1.9 million IOPS for writes, although the exact numbers depend on the storage capacity.

Lexar has also focused on endurance. The 512 GB model is rated for 350 TBW, while the 1 TB, 2 TB, and 4 TB versions are rated for 750 TBW, 1,500 TBW, and 3,000 TBW respectively.

The Thor Ultra SSDs use a 6 nm DRAM-less controller along with HMB and Dynamic SLC Cache. Lexar says its power management system is designed to keep temperatures under control and reduce the chances of thermal throttling during heavy workloads.

The company rates the drives for 1.5 million hours of MTBF and includes a five-year limited warranty, whichever comes first.

Lexar will also provide its DiskMaster Manage software with the SSDs. It can be used to update firmware, check drive health, improve performance, and manage data protection features.

Lexar Thor Ultra PCIe 5.0 SSD pricing

Lexar has not yet revealed the prices or release dates for the Thor Ultra series.

Sandisk Tapes Out Its First HBF Memory Die, Targets 2027 for Inference Product Samples

18 August 2026 at 19:25
Sandisk slide comparing HBF and HBM for AI inference, charting token output for 1 and 4 HBF GPUs against 8 HBM GPUs, with 8x capex efficiency and 2x GPU efficiency callouts Sandisk slide comparing HBF and HBM for AI inference, charting token output for 1 and 4 HBF GPUs against 8 HBM GPUs, with 8x capex efficiency and 2x GPU efficiency callouts

Sandisk has taped out the first High Bandwidth Flash memory die. The company put it on a slide at its 2026 Investor Day on August 13, under the header HBF Roadmap, next to what the slide labels an actual die picture. The second half of that slide covers the first HBF inference product samples: coming soon, 2027.

Sandisk Investor Day slide showing the first HBF memory die taped out with an actual die photograph, alongside first HBF inference product samples marked coming soon 2027

A tapeout is a substantial milestone with any new silicon. It means the design is finished and committed to a mask set, which is the point where an architecture stops being a slide and starts being silicon. It is also several steps short of a product. The wafers have to come back from the fab, the die has to hit its target specs, yield has to climb to something economic, and the die then has to survive stacking into 8-high and 16-high configurations with a working logic die and controller underneath. After that comes thermal and endurance qualification, the accelerator software work to actually address the memory, and customer qualification cycles that run in quarters. Sandisk is telling investors that the first of those steps is done.

What Sandisk Says HBF Delivers

HBF stacks NAND rather than DRAM and puts it in an HBM-style package next to the accelerator. Per Sandisk’s own HBF fact sheet, the first generation targets 512GB per stack, built from sixteen 256Gb die, at 1.6TB/s of read bandwidth. Sandisk claims that lands at up to 8 to 16 times the capacity of HBM at a similar cost, in a package that closely matches HBM4’s footprint, stack height, and power profile. Because it is NAND, it is non-volatile and spends no power on refresh.

The roadmap on the fact sheet runs further. A second generation targets more than 2TB/s and up to 1TB per stack at 0.8 times the first generation’s power, and a third pushes past 3.2TB/s and up to 1.5TB per stack at 0.64 times the power. The Investor Day deck frames the target workloads plainly: mixture-of-experts LLMs, long context lengths, and large KV caches, with the architecture developed using input from major cloud and AI customers.

Sandisk slide explaining HBF as its answer to the memory wall, showing the stacked HBF die architecture beside an xPU and listing same read bandwidth as HBM with up to 8 to 16x capacity

The deck also lays out three deployments. HBF can augment HBM, filling some of the stack positions around an xPU while HBM keeps the rest. It can replace HBM stacks outright in a similar footprint. Or it can sit disaggregated, holding decode weights and KV cache while a smaller HBM tier acts as cache. That flexibility matters more than it sounds, because it lets HBF into a socket without requiring an accelerator vendor to abandon HBM.

The Internal Numbers Sandisk Put On Screen

Sandisk showed an inference token output comparison covering one HBF GPU, four HBF GPUs, and eight HBM GPUs. From it, the company draws two claims, both labeled as based on internal testing. The first is an 8x capex efficiency figure, defined as the minimum configuration required to run the model: one HBF GPU against eight HBM GPUs. The second is a 2x GPU efficiency figure: four HBF GPUs delivering the same token output as eight HBM GPUs. The fact sheet adds a related simulation result: HBF landing within 2.2% of unlimited-capacity HBM when reading pretrained weights for Llama 3.1 405B.

Sandisk slide comparing HBF and HBM for AI inference, charting token output for 1 and 4 HBF GPUs against 8 HBM GPUs, with 8x capex efficiency and 2x GPU efficiency callouts

These are vendor numbers on unreleased silicon, and the chart in question carries no axis values for tokens per second. They describe the concept though: if a model fits in memory that is eight to sixteen times larger for the same bandwidth and roughly the same power, you need fewer accelerators to hold it, and the ones you have spend less time waiting.

Where the Timeline Stands

For planning purposes, two Sandisk statements bracket the schedule. In August 2025, the company said the first HBF samples were targeted for the second half of calendar 2026, with AI inference devices using HBF expected in early 2027. As of the August 2026 Investor Day, the first HBF inference product samples are listed as coming soon in 2027. Schedules for new memory classes firm up as designs become silicon, and first-generation platforms across this cycle have moved to the right as qualification realities set in. The tapeout is the evidence that HBF is progressing; however.

The Ecosystem Piece Is Further Along Than the Silicon

The standards work is moving faster than the product. On August 3, Sandisk and SK hynix released the first HBF technical specification through the Open Compute Project, six months after the consortium formed, with Google and Tenstorrent among the contributors. We covered that specification and what it defines when it landed.  Tensorent’s Jim Keller was named as a technical advisory board member at the event.

SK hynix, which co-authored the spec and showcased its own tiered memory pitch at FMS 2026, is the other half in determining whether this becomes a standard or a single-vendor product. For now, Sandisk has a taped-out die, a spec in the open, and a 2027 date on samples. The next real checkpoint is silicon that measures up, and that will come from a fab report, which hopefully Sandisk talks more about in the near future.

The post Sandisk Tapes Out Its First HBF Memory Die, Targets 2027 for Inference Product Samples appeared first on StorageReview.com.

Enterprise SSD Prices Run at 6.5x Last Year: VDURA Pegs a 30TB TLC Drive at $22,600

18 August 2026 at 18:57
Dell PowerEdge Solidigm P5336 Dell PowerEdge Solidigm P5336

Enterprise SSD prices increased another 5 percent in July 2026, according to the latest VDURA Flash Volatility Index. While the monthly increase was lower than the extreme fluctuations seen over the past year, flash pricing remains approximately 6.5 times higher than it was in the third quarter of 2025.

The index, which VDURA launched in January and updated August 11, places the price of a 30TB TLC enterprise SSD at $22,600, compared with $3,460 in Q3 2025. A 30TB QLC SSD now costs $18,080, up from $2,768 during the same period.

Dell PowerEdge Solidigm P5336

The TLC-to-HDD Multiple Sits at 18.6x

Hard drive pricing has also increased. VDURA lists a 30 TB HDD at $1,216, compared with $495 in Q3 2025. Despite the increase, the price difference between 30TB TLC SSDs and 30TB HDDs remains substantial. The current 18.6x multiple is lower than the 23.2x peak recorded in Q1 2026, but significantly higher than the 7.0x multiple measured a year earlier.

The pricing gap is particularly relevant to AI infrastructure. Training reads, checkpoint write bursts, and inference lookups require flash performance, while training datasets, checkpoint histories, and model archives can represent much larger capacity requirements. Placing all of that data on premium flash can significantly increase infrastructure costs.

“A 5% monthly increase on top of a 6.5x year-over-year jump is not relief. It is confirmation that elevated flash pricing is structural, and every AI cloud and AI factory business plan needs to account for it,” said Erik Salo, VDURA’s senior vice president of marketing and business operations.

25PB AI Factory Reference Deployment

VDURA used its Storage Economics Optimizer Tool to model a 25 PB storage deployment that delivers 1,000 GB/s of sustained read performance. The reference system is sized for a cluster of approximately 2,000 GPUs, based on guidance from AMD and NVIDIA.

Quarter 30TB TLC SSD 30TB QLC SSD TLC vs HDD 30TB HDD
Q3 2025 $3,460 $2,768 7.0x $495
Q4 2025 $7,765 $6,212 13.4x $580
Q1 2026 $17,500 $14,000 23.2x $755
Q2 2026 $18,900 $15,120 16.3x $1,158
Q3 2026 $22,600 $18,080 18.6x $1,216

At Q3 2026 pricing, an all-flash design using 30TB TLC SSDs carries an estimated three-year cost of $51.60 million. A design combining storage-class memory with QLC flash totals $48.42 million over the same period.

VDURA’s mixed-fleet architecture uses 5.78 PB of flash and 22.68 PB of HDD capacity within a single namespace. The configuration delivers 1,040 GB/s of sustained performance at an estimated three-year cost of $12.86 million.

The resulting difference is approximately $38.74 million compared with the TLC all-flash design. The comparison illustrates how separating performance and capacity requirements can reduce the amount of data stored on NVMe media without limiting the performance available to hot workloads.

For AI cloud operators, storage cost directly affects the economics of GPU utilization and token delivery. Training data, checkpoint operations, and inference lookups can remain on flash, while less performance-sensitive data is placed on hard drives. This approach limits exposure to elevated flash pricing while retaining NVMe performance where it matters most.

VDURA said the current pricing environment challenges the assumptions behind all-flash AI storage architectures. The company characterized the combination of a 5 percent monthly increase and a 6.5x year-over-year increase as evidence that flash pricing has become a structural consideration for AI cloud and AI factory deployments rather than a temporary market fluctuation.

The VDURA Flash Volatility Index and Storage Economics Optimizer Tool provide pricing data and modeling capabilities for comparing storage media mixes, capacity requirements, GPU counts, and performance targets. VDURA said it plans to update the index as market conditions change.

The post Enterprise SSD Prices Run at 6.5x Last Year: VDURA Pegs a 30TB TLC Drive at $22,600 appeared first on StorageReview.com.

SK hynix and Solidigm Split the NAND Map: 54 Trillion Won at Home, a Reported Dalian Fab 2 Restart in China

18 August 2026 at 18:32

SK hynix and its subsidiary Solidigm are following a two-part manufacturing plan to keep mature flash production separate from next-generation memory. Recent updates show they are expanding older production capacity overseas while also investing heavily at home. These moves will support future demand for AI storage, but current production schedules mean that enterprise SSD shortages are likely to continue for now.

Dalian Fab 2 Restart and Offshore Capacity Expansion

Solidigm has restarted investment in its second factory in Dalian, China, after about four years, according to the Seoul Economic Daily. The building for Fab 2 is finished, and equipment could start arriving as early as November 2026. The reports put full production in the first half of 2027. Neither Solidigm nor SK hynix has announced the restart through its own channels, so the timing rests on Korean press reporting for now.

Rows of semiconductor process equipment inside an SK hynix fab corridor

If completed, the new line could add about 50,000 wafer starts per month to the current Dalian Fab 1 output of around 100,000 wafers per month. This would increase the company’s flash manufacturing in China by about 50 percent. The Dalian site will continue to focus on mature-node NAND, helping Solidigm boost production of mainstream enterprise flash products while adhering to rules on advanced semiconductor equipment.

Multi-Trillion-Won Domestic Buildout for Advanced Nodes

Alongside its overseas expansion, SK hynix announced in early August a ₩54 trillion (about $38 billion) investment in its South Korean factories, according to company reports. Most of the money will go to two main sites: ₩35.2 trillion for the Yongin Y2 facility, which will make advanced DRAM and high-bandwidth memory, and ₩19.1 trillion for the Cheongju M17 fab, which will focus on next-generation NAND flash and enterprise SSDs.

Aerial rendering of the SK hynix Cheongju campus, home of the planned M17 NAND fab

The M17 investment will create a dedicated site for making high-layer, high-density flash needed for large-scale AI tasks. However, this new capacity will take time to come online. The first cleanroom at M17 should be finished by the end of 2028, with commercial production starting in 2029 or later.

Market Position and Enterprise SSD Pricing Implications

TrendForce data for the first quarter of 2026 shows that SK hynix Group, including Solidigm, stayed in second place for global NAND flash revenue. The group posted $7.53 billion in revenue for a 17.6 percent share, behind Samsung’s 31.6 percent. To keep or grow this share, they need to increase production of both mature and advanced memory types.

The demand side explains the urgency. Counterpoint Research’s second-quarter tracker puts enterprise SSDs at 48 percent of global NAND shipments, nearly double the 26 percent share a year earlier, and the firm expects eSSDs to absorb more than half of all NAND bits by the end of 2026. Solidigm stood out in that data, growing bit shipments roughly 40 percent quarter over quarter per Counterpoint, and that mature-node, high-capacity product line is exactly what the reported Dalian expansion would feed.

The main issue is still how much product is available and at what price. By sending mature-node production to Dalian and focusing on advanced memory at home, SK hynix will not solve the current shortage of enterprise SSDs. Since Dalian Fab 2 will not start producing until at least the first half of 2027, and Cheongju M17 will not be ready until the end of the decade, enterprise storage supplies will stay limited for now.

The post SK hynix and Solidigm Split the NAND Map: 54 Trillion Won at Home, a Reported Dalian Fab 2 Restart in China appeared first on StorageReview.com.

❌
❌