Normal view

There are new articles available, click to refresh the page.
Today — 14 September 2026Main stream

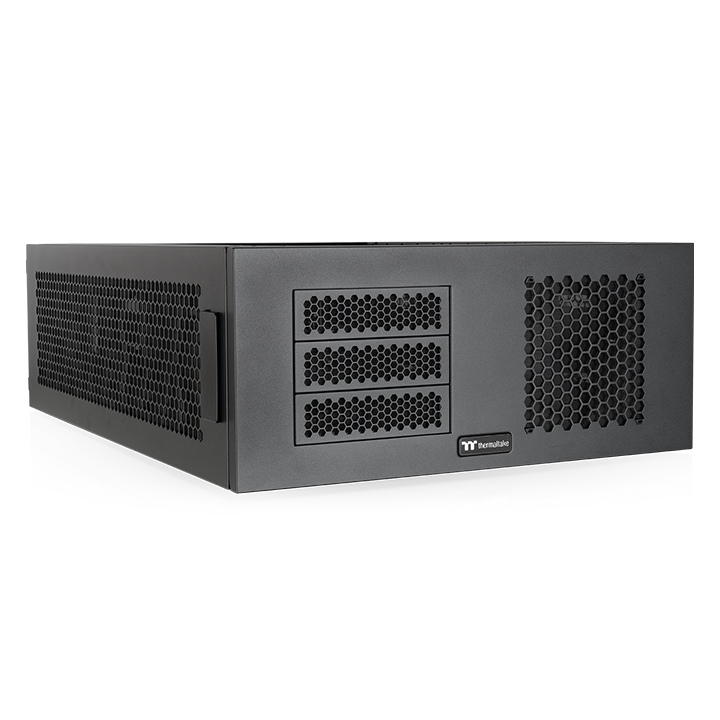
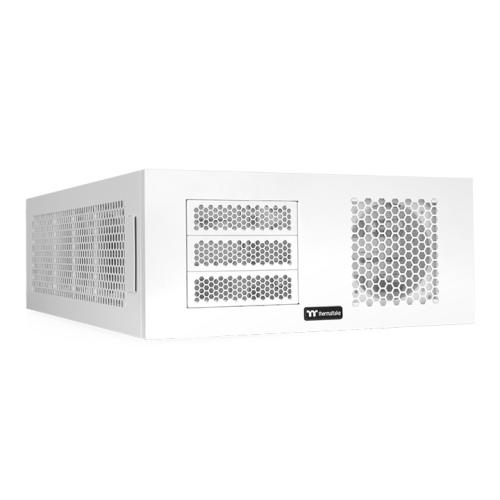
Thermaltake introduces AX1000 dual-system chassis and AX200 expansion module

13 September 2026 at 11:27

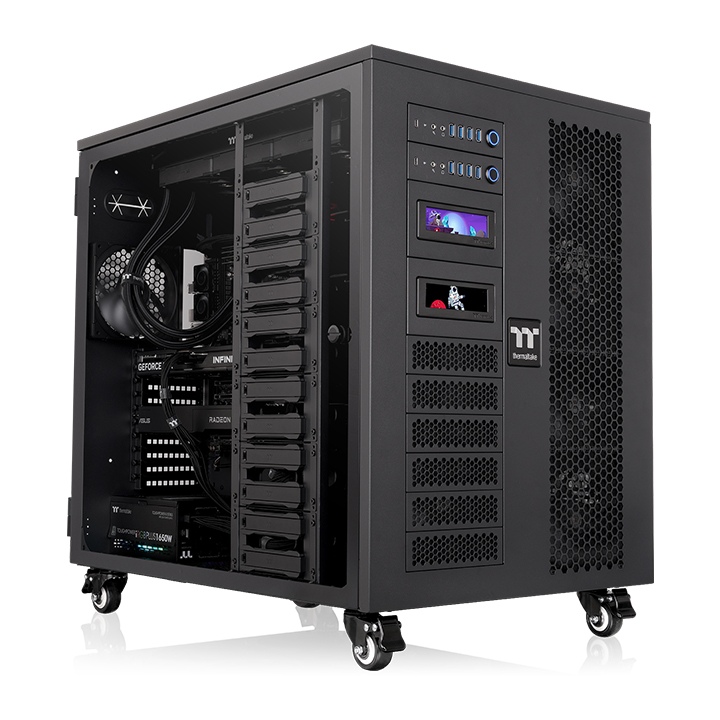
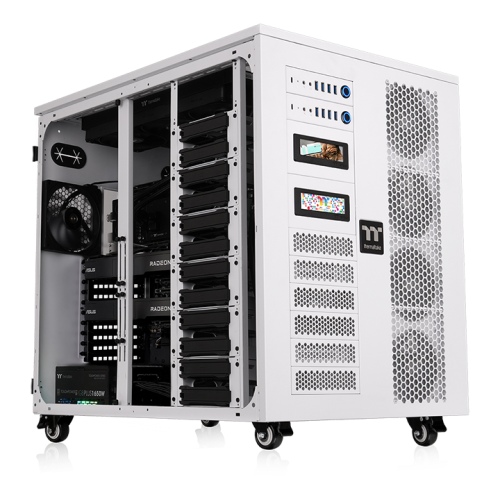
Thermaltake has introduced the AX1000 TG AI Workstation Chassis alongside the AX200 stackable expansion pedestal. Designed for AI computing, content creation and server‑grade workloads, the AX1000 offers dual‑system support and extensive hardware capacity, while the AX200 provides modular expansion for cooling, storage and power.

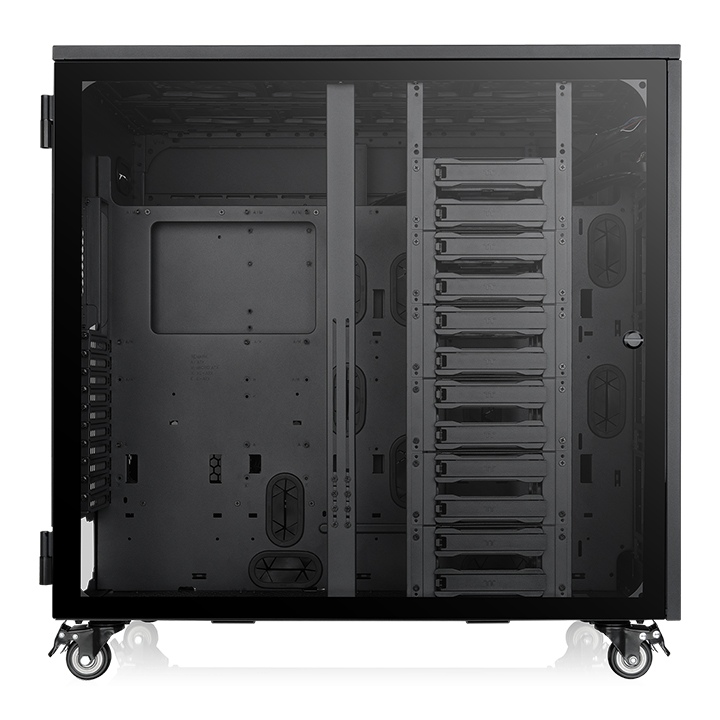
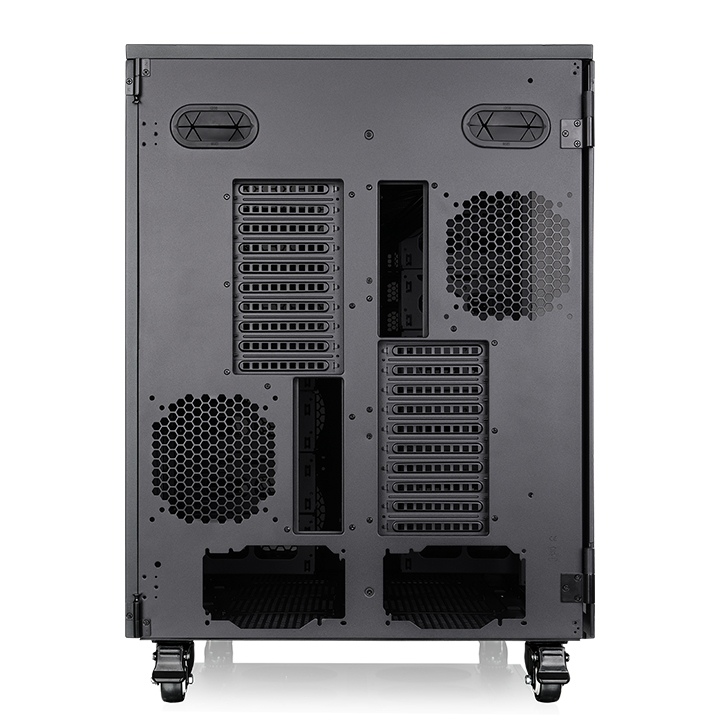
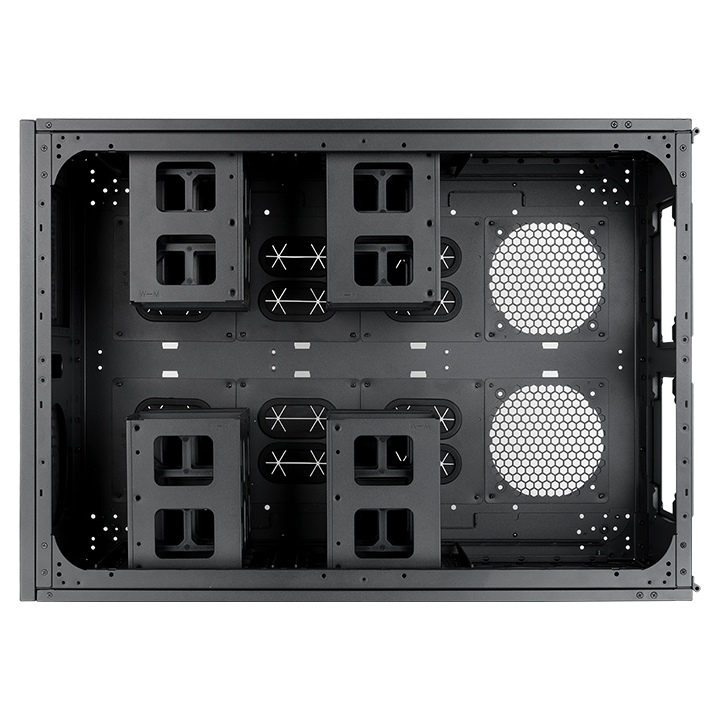
The AX1000 supports two XL‑ATX or SSI‑EEB motherboards and offers up to 20 PCIe slots for multi‑GPU setups, with clearance for graphics cards up to 630mm long. The chassis includes mounts for up to 24 drives and supports extensive cooling, with room for as many as 29 case fans and space for dual 420mm AIO or 560mm custom‑loop radiators.

A hinged tempered‑glass panel provides a clear view of internal components, while a perforated right‑side panel maintains airflow. Dual front I/O panels give each system dedicated access, and integrated GPU supports help stabilise heavier graphics cards. System monitoring is available through an optional 3.9‑inch LCD kit controlled via TT RGB PLUS 3.0.

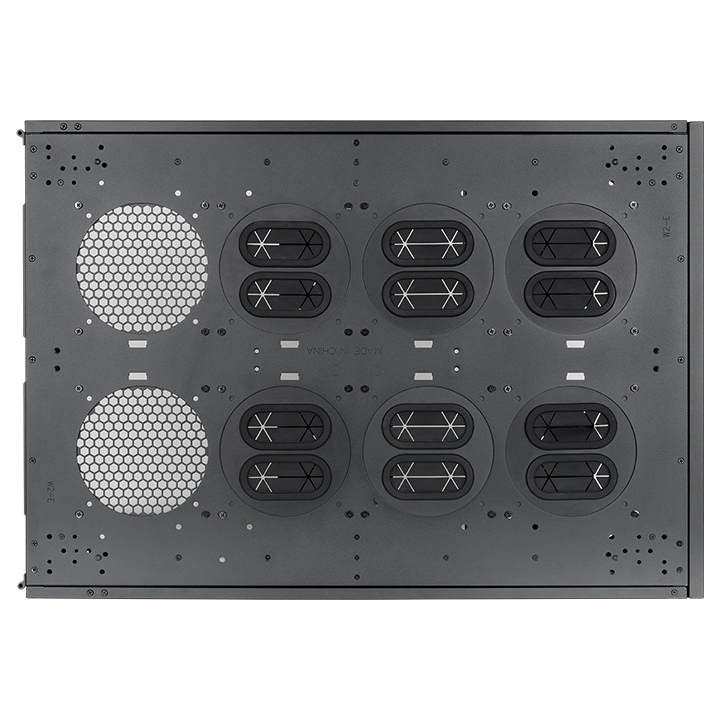
For additional capacity, the AX200 pedestal attaches directly to the AX1000, expanding storage, cooling and power options. The module adds mounts for 16 more drives, 9 additional fans, dual 480mm or 560mm radiators and support for two standard PS2 power supplies.

KitGuru Says: If the AX1000 alone isn’t enough, the AX200 pedestal offers a substantial amount of extra room. How would you configure this setup?

The post Thermaltake introduces AX1000 dual-system chassis and AX200 expansion module first appeared on KitGuru.
Before yesterdayMain stream

HP ZGX Fury Is Now Orderable: GB300 Superchip, 748GB Unified Memory, and a Red Hat AI Factory Plan for the Edge

9 September 2026 at 19:35
HP ZGX Fury AI station tower in the StorageReview lab, showing the front mesh panel, ZGX badge, and front USB and audio ports HP ZGX Fury AI station tower in the StorageReview lab, showing the front mesh panel, ZGX badge, and front USB and audio ports

HP’s ZGX Fury AI station is now available to order, and HP paired the availability news with a collaboration with Red Hat and NVIDIA to put Red Hat AI Factory with NVIDIA on top of it. The ZGX Fury is HP’s take on NVIDIA’s DGX Station design, built around the GB300 Grace Blackwell Ultra Desktop Superchip with 748GB of unified memory and up to 20 petaFLOPS of FP4 compute, and HP is positioning it less as a personal workstation than as a shared inference box that a department, a factory floor, or a branch office can run without a data center behind it. We have one in the lab now, so a full review is coming; this is what HP has said so far.

HP ZGX Fury AI station tower in the StorageReview lab, showing the front mesh panel, ZGX badge, and front USB and audio ports

HP ZGX Fury Hardware: One GB300 Superchip, 748GB of Memory, Tower or 5U

The core of the system is the same silicon we tested in the MSI XpertStation WS300: one Blackwell Ultra GPU with 252GB of HBM3e at 7.1TB/s, tied to a 72-core Grace CPU with 496GB of LPDDR5X over NVLink-C2C. HP’s spec sheet fills in details the platform announcements skipped. The CPU memory is four 128GB SOCAMM modules delivering 396GB/s, and the Grace CPU is soldered to the host processor module rather than socketed. The two pools add up to the 748GB coherent space that lets the GPU address CPU memory directly, which is what makes trillion-parameter inference and fine-tuning of models in the 100 billion parameter class possible on a single box. HP’s footnote on those model sizes is that the harness quantizes at FP4.

Two embedded M.2 slots hang off the Grace CPU on PCIe 5.0 and hold the operating system in a software RAID 1 mirror. Two more M.2 slots come off the PCIe switch inside the ConnectX-8 SuperNIC and serve as a RAID 0 data volume, with 2TB or 4TB of self-encrypting NVMe chosen at purchase.

Networking is the ConnectX-8 with two QSFP112 ports at 400Gbps each, which can link two ZGX Fury systems together, plus a 10GbE RJ-45 for the host and a separate 1GbE RJ-45, Mini-DP, and micro-USB for the BMC. The rest of the I/O is workstation-normal: two USB-A and two USB-C ports up front, four more USB ports at the rear, audio jacks, a Kensington slot, and a C20 inlet for the power cord. There is no display output from the GB300 itself; HP offers an optional NVIDIA RTX PRO GPU to drive monitors so the Blackwell Ultra GPU stays dedicated to inference. The chassis is a tower that also ships with rails for a 5U rack slot, and HP uses liquid cooling with optimized airflow, which matches what we found on the MSI unit, where a 1,400W-rated loop kept the GPU at 71C under full load.

HP ZGX Fury Software: Ubuntu, Z Runtime, and Red Hat Certification

HP ships the ZGX Fury with Ubuntu 24.04 LTS and NVIDIA’s AI developer tools, an NVIDIA-approved partner BIOS and BMC firmware, and two HP-specific layers. HP Z Runtime is a pre-installed command-line tool for pulling, serving, and managing models locally, and HP Z Toolkit adds open-source frameworks, MLflow experiment tracking, and Ollama testing with discovery and sync across ZGX systems. The idea is that a team prototypes on a ZGX Nano and moves the same workflow to a ZGX Fury when it needs more memory, more throughput, or more concurrent users.

The new piece is Red Hat. HP says the ZGX Fury is certified for Red Hat Enterprise Linux and listed in the Red Hat Ecosystem Catalog today, and the two companies are developing what HP calls an open, enterprise-grade AI platform that runs Red Hat AI Factory with NVIDIA on the ZGX Fury. Red Hat AI Factory with NVIDIA is Red Hat’s packaging of RHEL, OpenShift, and Red Hat AI Enterprise with NVIDIA AI Enterprise for deploying models, agents, and applications across hybrid cloud. On the ZGX Fury, HP says the combination is meant to cut environment setup time and deployment risk, improve GPU utilization through optimized CUDA libraries, scheduling, and multi-GPU workload orchestration, and let developers offload compute to the box without changing their existing workflows. The platform is also being designed to run multiple AI workloads on one system with workload isolation and governance, which is how HP gets from a deskside machine to something IT can manage as edge infrastructure.

“The future of AI is moving closer to where people work, machines operate and critical decisions are made,” said Jim Nottingham, Senior Vice President and Division President of Advanced Compute and Solutions at HP. “Together with Red Hat and NVIDIA, HP is extending enterprise AI from the data center to the edge with an open, enterprise-grade inference platform designed to give customers greater choice, control and consistency as they deploy local AI factories.” Chris Marriott, Vice President of Enterprise Platforms and Solutions at NVIDIA, framed it the same way: running “powerful AI locally while maintaining the security, scalability, and consistency enterprises demand.”

The ZGX Fury is orderable now through HP; pricing was not disclosed in the announcement. The Red Hat AI Factory integration is a planned solution rather than a shipping SKU, and HP says customers will be able to evaluate it in a sandboxed environment on HP devices before moving to production, with timing, eligibility, and supported configurations still to come. The competitive picture is filling in quickly: MSI’s WS300 is shipping on the same superchip, and AMD’s Threadripper Halo Station is aimed at the same workloads. Our ZGX Fury review will put HP’s version of the platform through the same model and testing we ran on the MSI.

HP ZGX Fury AI Station

The post HP ZGX Fury Is Now Orderable: GB300 Superchip, 748GB Unified Memory, and a Red Hat AI Factory Plan for the Edge appeared first on StorageReview.com.

AMD Announces Threadripper Halo Station: A High-End AI-Centric Developer Workstation

4 September 2026 at 17:00

At IFA 2026, AMD announced their Threadripper Halo Station, a high-end workstation for AI developers that combines AMD's Threadripper Pro CPU and Instinct MI350P accelerators

The post AMD Announces Threadripper Halo Station: A High-End AI-Centric Developer Workstation appeared first on ServeTheHome.

DGX Spark Windows Clue: This Week’s Firmware Adds a Windows Boot Certificate as NVIDIA Details October RTX Spark PCs

5 September 2026 at 00:25
NVIDIA DGX Spark on the StorageReview lab bench, front panel with NVIDIA logo, the machine a DGX Spark Windows path would land on NVIDIA DGX Spark on the StorageReview lab bench, front panel with NVIDIA logo, the machine a DGX Spark Windows path would land on

NVIDIA used IFA in Berlin to put Windows at the center of its local AI story. The company’s September 3 post covers a new Windows Agent framework for agents that run in the background under OS control, one-click Windows setups for OpenClaw and Nous Research’s Hermes Agent, a beta of an inference router called NVIDIA PAIR, a batch of new local models, and a firm October window for RTX Spark Windows PCs from Lenovo, Acer, and six other OEMs.

Something else happened this week that NVIDIA didn’t announce. After we applied the latest firmware update to a DGX Spark cluster in our lab this week, the fwupd device list picked up an entry we hadn’t seen on it before: Windows UEFI CA. That’s the Microsoft certificate a machine’s firmware uses to trust a Windows boot loader. Windows is almost here for Sparks, the #1 most requested feature for these devices.

What Changed in Our DGX Spark’s Firmware

The screenshot below is sudo fwupdmgr upgrade on one of our Sparks after this week’s update. The Embedded Controller, TPM, UEFI CA, and UEFI Device Firmware are all at the latest version. Further down, in the list of devices with no pending update, sits “Windows UEFI CA” alongside the BIOS DB key, the Key Exchange Key, SBAT, the UEFI dbx revocation list, and the ConnectX-7.

fwupdmgr output on a StorageReview DGX Spark after this week's firmware update, listing Windows UEFI CA among the Secure Boot devices

A quick primer on why that line matters. UEFI Secure Boot maintains a database of trusted certificates (.db) that the firmware uses to launch an operating system. Linux distributions boot through a shim signed by Microsoft’s third-party UEFI CA, which fwupd tracks as “UEFI CA.” Windows Boot Manager is signed under a different Microsoft certificate, the Windows production CA, which fwupd tracks separately as “Windows UEFI CA.” Since DGX OS only ever needed the third-party certificate, there was no reason for the Windows one to be in Spark’s db. After this week’s update, it is, and fwupd lists it with no update pending.

Booting Windows on Arm on this hardware still needs drivers for the Blackwell GPU, the Grace CPU’s platform devices, the ConnectX-7 NICs, and the rest of the board, plus an installer, and NVIDIA has said nothing about any of that for DGX Spark. What it has said is that the same GB10-class silicon will go into Windows PCs next month under the RTX Spark name, with a Windows stack that NVIDIA and Microsoft have been building together since Computex. Trusting Microsoft’s boot certificate in DGX Spark firmware is the kind of groundwork needed to make that happen.

Why we care: native Windows support was the single most common request we heard from people eyeing a Spark, and it is the main reason our AMD Ryzen AI Halo review hit where it did. The Halo supports Windows 11 or Linux on the same 128GB box; the Spark runs DGX OS exclusively. When Windows arrives on DGX Spark, the biggest gap in that comparison closes, and the machine’s audience widens well past AI developers who are comfortable living in Ubuntu.

Rear I/O of the NVIDIA DGX Spark: four USB-C ports, HDMI, 10GbE, and dual QSFP ConnectX-7 ports

RTX Spark Windows PCs Land in October

NVIDIA says RTX Spark PCs are “coming this October.” Lenovo showed the Yoga Pro 9n and the Yoga 9n 2-in-1 at IFA; Acer showed a compact desktop concept; and six more OEMs will ship in October. NVIDIA’s RTX Spark page populates the laptop list with the ASUS ProArt P16, Dell XPS 16, HP OmniBook X 14, Microsoft Surface Laptop Ultra, and MSI Prestige N16 Flip AI+, and includes desktops from Acer, ASUS, Dell, Gigabyte, HP, Lenovo, and MSI.

The spec sheet is the one NVIDIA outlined in June: laptops get up to a 6,144-core Blackwell RTX GPU, a 20-core Grace CPU, and up to 128GB of unified LPDDR5X in a 45W to 80W envelope, while the desktops are cut to 5,120 CUDA cores, 18 CPU cores, and 64GB at 140W. Both top out at 1 petaflop of FP4 AI performance and carry PCIe Gen5, HDMI 2.1b, and three DisplayPort 2.1b outputs. On the gaming side, NVIDIA lists Electronic Arts, Embark, Ubisoft, KRAFTON, NetEase, Riot Games, and Xbox as bringing titles to the platform. CyberLink will ship an AI PC mode for PhotoDirector 365 tuned for RTX Spark at launch using TensorRT-RTX and FP8.

Agents That Stay on the PC

The software portion of the post focuses on keeping agents local. NVIDIA describes a new Windows Agent framework that lets agents “run safely in the background under OS level control,” and it worked with Microsoft and OpenClaw, which it calls the largest AI project on GitHub at more than 380,000 stars, to simplify the OpenClaw Windows app setup on RTX GPUs with 24GB or more of VRAM. Nous Research’s Hermes Agent now offers one-click local model setup on Windows, with Linux support to follow, and Perplexity’s Portable Computer runs today on Linux with a 24GB-plus RTX GPU, with Windows support “coming soon.” NVIDIA’s pitch for all three is the same: complete workflows on the local machine, no cloud credits burned.

PAIR, Faster llama.cpp and vLLM, and a New Batch of Models

NVIDIA PAIR, for Personal AI Router, is a free, open-source tool that discovers compatible PCs on a local network and routes independent inference requests to whichever system has capacity; think of it as a homelab version of LLM-D. It works with Ollama and LM Studio, and the hardware list is broad: GeForce RTX 20 Series and newer, RTX PRO workstation GPUs back to Turing, DGX Spark, and Apple M4 or later Macs. The beta is now out for Windows, macOS, and Linux, with both a graphical and a terminal interface.

On raw inference, NVIDIA claims up to 1.9x higher llama.cpp throughput on a GeForce RTX 5090 from kernel optimizations and improved speculative decoding, and vLLM gains of 1.2x on the RTX PRO 6000 Blackwell and up to 1.4x on two-node DGX Spark clusters, all flowing through to LM Studio and Ollama. The model drop includes Nemotron 3.5 Lightning, a 30-billion-parameter model sized for RTX PCs, RTX PRO workstations, DGX Spark, and Jetson; Z.ai’s GLM-5.3-Flash multimodal MoE; Qwen3.8-Flash-Next and Qwen3.8-27B; LTX 2.5 and MiniMax-H3 for video generation; Meta’s 30B Muse Glimmer for coding and agentic work; and DeepSeek v4 Flash, a 284-billion-parameter MoE with 13 billion active parameters that NVIDIA says runs on a two-Spark cluster or a DGX Station.

We’ll keep an eye on fwupd. If a Windows path for DGX Spark opens up, the Spark sitting next to the Halo on our bench will be the first place we try it.

The post DGX Spark Windows Clue: This Week’s Firmware Adds a Windows Boot Certificate as NVIDIA Details October RTX Spark PCs appeared first on StorageReview.com.

AMD Reveals Threadripper Halo Station: 96 Cores and up to 576GB of HBM3E Aimed Straight at DGX Station

4 September 2026 at 16:08
Inside the AMD Threadripper Halo Station: two liquid-cooled Instinct MI350P accelerators with braided coolant lines Inside the AMD Threadripper Halo Station: two liquid-cooled Instinct MI350P accelerators with braided coolant lines

AMD used its IFA 2026 opening keynote to reveal the Threadripper Halo Station, a liquid-cooled workstation pairing a 96-core Threadripper PRO with a pair of Instinct MI350P accelerators, and the pitch could not be more direct: this is AMD’s answer to NVIDIA’s GB300 DGX Station. “This is the most powerful workstation in the world,” said Jack Huynh, AMD’s senior vice president and general manager of Computing and Graphics, calling it “capable of running AI models with more than a trillion parameters.”

Jack Huynh presents the AMD Threadripper Halo Station on stage at IFA 2026, with the liquid-cooled tower open beside him

What AMD Showed on Stage

Huynh never named the CPU beyond “96 cores of Threadripper Pro,” so we’re assuming it’s the Threadripper PRO 9995WX, the only 96-core part in the lineup, a 192-thread Zen 5 “Shimada Peak” chip that goes to 5.4GHz per AMD’s specs, on a platform carrying up to 2 TB of eight-channel DDR5 and the 128 PCIe 5.0 lanes the Threadripper PRO platform provides. Beside it sit two Instinct MI350P accelerators, the 600W PCIe CDNA 4 cards AMD introduced for enterprise inference, “with the path to four,” as Huynh put it. Each MI350P carries 144GB of HBM3E at 4TB/s, so the show configuration holds 288GB of accelerator memory, and a fully built-out unit reaches the 576GB figure Huynh quoted on stage.

Inside the AMD Threadripper Halo Station: two liquid-cooled Instinct MI350P accelerators with braided coolant lines

The whole system is liquid-cooled, CPU and accelerators both, “because we want all that power to stay super quiet,” Huynh said. For deskside AI, that’s a critical point: two 600W accelerators plus a 350W CPU equals 1,550W of silicon, which can produce aggravating noise levels if not managed correctly. Huynh closed the segment with the line that will follow this product around: “This is about as close as you can get to a personal supercomputer.”

AMD Threadripper Halo Station internals through the glass side panel, showing both MI350P cards and the CPU liquid cooling loop

The DGX Station Fight It’s Picking

The system AMD is targeting is the one we just finished testing. NVIDIA’s GB300-based DGX Station, which we reviewed as the MSI XpertStation WS300, takes the opposite architectural bet: one B300 GPU and one Grace CPU sharing a 748GB coherent memory pool over a 900GB/s NVLink-C2C link. AMD’s answer is discrete and expandable: less unified memory, but up to four accelerators, 2TB of host DRAM, and an x86 host that sidesteps the Arm toolchain problems we flagged in the WS300 review. The trillion-parameter claim rests on that split pool; a 1T-parameter model at 4-bit precision needs roughly 500GB for weights alone, which the four-accelerator, 576GB configuration would hold in HBM, with the 2TB of DDR5 and NVMe storage behind it for everything else. AMD hasn’t shown a token of benchmark data yet, so how well models straddle four PCIe-attached cards against NVIDIA’s coherent pool is exactly the battle we look forward to testing.

The Station also completes a ladder AMD spent the year assembling. At the small end sits the Ryzen AI Halo we reviewed this summer, a compact dual-OS desktop that runs 200B-parameter models locally and squares up against the DGX Spark, with the Ryzen AI Max PRO 400 machines from earlier in the keynote filling the laptop and mini-PC tiers. The Halo Station caps the range, and the portfolio point is hard to miss: AMD now fields an answer at every rung of NVIDIA’s personal AI hardware ladder, from a box that fits in a hand to a workstation that claims a trillion parameters.

AMD Ryzen AI Halo compact desktop on the StorageReview lab bench, the small end of the portfolio the Threadripper Halo Station now tops

What AMD Didn’t Say

There’s no pricing, no availability window, no named OEM partners, and no word on whether AMD sells this directly or hands the design to system builders, as it did with the Ryzen AI Halo and Ryzen AI Max PRO 400 machines announced earlier in the same keynote. The show unit itself hints at how early this is: AMD’s own preview shows a conventional tempered-glass enthusiast tower with a standard ATX power supply and custom loops on each card. There’s also little detail on the interconnect between accelerators, storage configuration, or power requirements, and given two 600W cards plus a 350W CPU, the wall-side story is a legitimate issue.

Full side view of the AMD Threadripper Halo Station show unit with liquid cooling routed to a rear radiator

The reveal segment runs from 35:41 to 38:20 in AMD’s keynote replay, and it’s worth the three minutes if this kind of product speaks to you.

The post AMD Reveals Threadripper Halo Station: 96 Cores and up to 576GB of HBM3E Aimed Straight at DGX Station appeared first on StorageReview.com.

ACEMAGIC’s F9A Ryzen AI MAX+ 495 Mini Workstation Delivers Up To 60% Better AI Model Support Over 395, As it Packs 192 GB Memory

3 September 2026 at 00:35

The ACEMAGIC AI Mini Workstation featuring 'Next-Gen' technology is showcased with the AMD Ryzen AI MAX+ logo and text 'ACE F9A' in the background.

ACEMAGIC has unveiled its F9A Mini Workstation, which houses up to the AMD Ryzen AI MAX+ PRO 495 chip & 192 GB of memory. Mini PC & Workstation Popularity Grows As Local AI & Agents Become The New Craze, & ACEMAGIC Addresses This Demand With Its AMD Ryzen AI MAX+ Powered F9A PC At IFA, ACEMAGIC is announcing its latest Mini Workstation platform, the F9A. This new platform is designed to incorporate AMD's Ryzen AI MAX SoCs. At launch, the platform will be available in up to Ryzen AI MAX+ 395 configurations, but it will also get a Ryzen AI […]

Read full article at https://wccftech.com/acemagic-f9a-ryzen-ai-max-495-mini-workstation-192-gb-memory/

Dell Pro 14 Premium Review: A 2.55-Pound Magnesium Flagship With Tandem OLED

2 September 2026 at 00:35
Dell Pro 14 Premium open on a lab bench with the Tandem OLED display on Dell Pro 14 Premium open on a lab bench with the Tandem OLED display on

The Dell Pro 14 Premium is what Dell calls its ultimate commercial notebook: a 14-inch, 2.54-pound magnesium flagship aimed at highly mobile professionals rather than workstation users. It sits above the Dell Pro and Dell Pro Plus lines, and the pitch is craftsmanship and portability with enterprise security and manageability underneath, not raw compute. The chassis is 90% recycled magnesium, the battery is customer-replaceable, and the platform includes Intel vPro Enterprise, a FIPS 140-3-certified TPM, and quantum-resistant BIOS verification.

Dell Pro 14 Premium open on a lab bench with the Tandem OLED display on

Dell sells the Pro 14 Premium in three processor tiers, all from the Intel Core Ultra Series 3 (Panther Lake): the 8-core Core Ultra 5 335, the 8-core Core Ultra 7 365, and the 16-core Core Ultra 7 366H. Displays range from a 1920 x 1200 WUXGA LCD to a 2880 x 1800 Tandem OLED touch panel, with memory up to 64GB and storage up to 2TB. Our review unit is essentially the ceiling of the configurator: the 366H with its 50 TOPS NPU, 64GB of LPDDR5x at 8533 MT/s, a 1 TB TLC SSD, and the Tandem OLED touch display. That configuration starts at $2,409 and prices out at $5,219 as tested on Dell.com, though single-unit pricing is a reference point here; this machine is built to be bought in fleet volume through an account team.

All three CPUs share the same integrated Intel Graphics, so unlike the HP EliteBook X G2i, which offers a 12 Xe-core Arc B390 step-up on its top silicon, there is no faster graphics tier hiding above this build. The 4 Xe-core iGPU is the ceiling for the whole line, and that shapes what this machine is for: dense office multitasking, collaboration, and on-device AI, not GPU rendering or CAD viewports. We tested the best build Dell makes, and the results below show exactly where that ceiling sits.

Dell Pro 14 Premium Specifications

Specification Dell Pro 14 Premium
Model Dell Pro 14 Premium (PA14260)
Processor Intel Core Ultra 7 366H vPro Enterprise (Series 3), 16 cores / 16 threads, 50 TOPS Intel AI Boost NPU
Graphics Integrated Intel Graphics, 4 Xe cores
Memory 64GB LPDDR5x, 8533 MT/s, dual-channel, onboard
Storage 1TB TLC SSD (Samsung PM9C1b, PCIe Gen4 NVMe)
Display 14-inch WQXGA (2880 x 1800) Tandem OLED touch, 400 nits, 100% DCI-P3, ComfortView Plus, anti-reflective/anti-smudge, Gorilla Glass
Camera 8MP HDR + IR, 1440p at 30 fps, presence detection, temporal noise reduction, camera shutter
Wireless Intel Wi-Fi 7 BE211 2×2, Bluetooth 6.0
Keyboard Zero-Lattice mini-LED backlit with Copilot hotkey
Ports 2x Thunderbolt 4 / USB4 (40Gbps) with Power Delivery
1x USB 3.2 Gen 1 Type-A
1x HDMI 2.1
1x 3.5mm headset jack
Battery 3-cell, 60Wh, ExpressCharge and ExpressCharge Boost (40Wh 2-cell on base configs)
Power Adapter 65W USB-C
Security Fingerprint reader, Windows Hello IR camera, TPM 2.0 (FIPS 140-3 certified), quantum-resistant BIOS verification, camera shutter
Chassis 90% recycled magnesium, starting at 2.54 lb (1.15 kg), 12.25 x 8.53 x 0.66-0.78 inches
Operating System Windows 11 Pro, Copilot+ PC
Warranty 36-month limited hardware warranty
Price $2,409 starting; $5,219 as tested (single-unit Dell.com)


Build and Design

Weighing in at only 2.55 pounds thanks to Dell’s 90% recycled magnesium chassis, the Pro 14 Premium carries well in hand and keeps your bag light. The chassis also provides enough rigidity to open the lid from a corner without major deformation.

Dell Pro 14 Premium closed, overhead view of the magnesium lid

Along the front edge, the Pro 14 Premium sits just under 3/4 inch high across the entire chassis. The knurled slider for the webcam shutter is also visible and centered between the stereo microphones.

Dell Pro 14 Premium front profile with the lid partially closed, showing the thin magnesium chassis

Similar to our previous Pro Precision 7 16, we see the same tightly placed key layout, with minimal gaps. We also see the set of top-firing speakers that are only half of the sound setup. There is another pair of bottom-firing speakers along the front edge on either side of the touchpad. This keyboard also features a zero-lattice mini-LED backlight to aid low-light usage.

Dell Pro 14 Premium Zero-Lattice keyboard and Collaboration Touchpad from above

This model also features a glass touchpad, like another flashback to the Pro Precision 7 16, but this time it is a traditional diving-board-hinge-style touchpad, not haptic. Though it is not haptic, it does have the same smooth finish and sliding feel. Some configurations of the Pro 14 Premium also feature the collaboration touchpad for easy meeting controls.

Dell Pro 14 Premium haptic touchpad and palm rest close-up

For the display, we have a 3K tandem OLED with a Gorilla Glass touch panel across the top. The display outputs 400 nits at 100% brightness and features an anti-smudge coating. The use of tandem OLED displays helps not only with color clarity but also with power efficiency and display longevity.  According to Dell’s numbers, the tandem OLED reduces weight by 49% compared to a traditional OLED panel and is 24% more power-efficient.

Dell Pro 14 Premium straight on with the 2880 x 1800 Tandem OLED display on

Above the 3K tandem OLED display, we can see the camera and sensor package. This houses the 8MP 1440p webcam along with the Windows Hello and presence detection sensors. This notebook also features an integral shutter with a knurled slider on the top edge, as opposed to on the front edge, like some other notebooks we’ve seen.

Dell Pro 14 Premium top bezel close-up with the 8MP HDR camera

Taking a look at our port selection, the left edge features the HDMI 2.1 port and both of the Thunderbolt 4 ports, alongside a charge indicator light.

Dell Pro 14 Premium left side with HDMI 2.1 and two Thunderbolt 4 ports

Along the right edge, it is a little sparser; we have the 3.5mm combination headphone jack, a USB 3.2 Gen 1 Type-A port, and the wedge-shaped lock slot. The USB Type-A port also supports Dell’s Power Share feature, which allows power output while the laptop is asleep or even powered off, for charging peripherals or a cell phone.

Dell Pro 14 Premium right side with USB Type-A port and lock slot

At the bottom, we see a good-sized air intake for the cooling package, with a rear-firing exhaust at the display hinge. Toward the front edge, we also see additional bottom-firing speakers that complement those flanking the keyboard, providing a full sound profile. For serviceability, Dell also only utilizes 7 screws to remove the bottom cover.

Dell Pro 14 Premium bottom panel with ventilation slots and speaker grilles

Internally, front and center is the sizeable cooling fan, nearly the same size as the entire mainboard, tucked in the top right. Down below, we also see the 60Wh battery, which has more than enough capacity to run day-to-day tasks in balanced power mode throughout the workday. Dell has also leaned heavily into serviceability, with the SSD and battery being easily replaceable.

Dell Pro 14 Premium internals with the bottom cover removed, showing the 60Wh battery with pull tabs, cooling fan, and heat pipe

Dell Pro 14 Premium Performance

Our review unit runs the Core Ultra 7 366H with integrated Intel Graphics, 64GB of LPDDR5x at 8533 MT/s, and a 1 TB TLC SSD on Windows 11 Pro, with benchmarks tested in the Best Performance power mode. For battery life testing, we configure systems into Balanced power mode and set the screen brightness to 50%.

For comparisons, we lined the Pro 14 Premium up against three systems tested with the same suite, which run the identical Core Ultra 7 366H: the HP EliteBook X G2i, its closest cross-brand rival in the premium commercial 14-inch class, and the Dell Pro 7 14 Intel, the mainstream Dell Pro that shows what the Premium buys you over the volume line. The third is the Lenovo ThinkPad P14s Gen 7, a 3.6-pound mobile workstation on the same Panther Lake silicon with a discrete RTX PRO 1000; it is a class heavier, but it brackets what a dedicated GPU adds over this iGPU platform.

PCMark 10

PCMark 10 simulates a full day of office work: app start-up, video conferencing, web browsing, spreadsheets, writing, photo and video editing, and light rendering.

PCMark 10 (higher is better) Dell Pro 14 Premium HP EliteBook X G2i Dell Pro 7 14 Intel Lenovo ThinkPad P14s Gen 7
Overall Score 8,482 9,209 8,438 9,083
Essentials 10,840 10,760 10,981 10,686
Productivity 14,466 18,859 13,992 16,501
Digital Content Creation 10,558 10,445 10,610 11,534


The Pro 14 Premium lands at 8,482 overall, ahead of the Dell Pro 7 14 Intel at 8,438 but behind the HP EliteBook X G2i at 9,209 and the ThinkPad P14s Gen 7 at 9,083. The gap to the HP is almost entirely the Productivity group, where the EliteBook posts an unusually strong 18,859 against the Dell’s 14,466. Essentials and Digital Content Creation are effectively tied across the three 366H systems, as the shared silicon predicts.

PCMark 10 Modern Office Battery

For battery testing, we run the PCMark 10 Modern Office battery test in Balanced power mode at 50% screen brightness until the system shuts down.

Modern Office Battery Dell Pro 14 Premium HP EliteBook X G2i Dell Pro 7 14 Intel Lenovo ThinkPad P14s Gen 7
Runtime (higher is better) 16 hours 30 minutes 17 hours 13 minutes 26 hours 18 minutes 15 hours 52 minutes


At 16 hours and 30 minutes, the Pro 14 Premium sits in the same band as the other premium OLED machine in the group; the EliteBook X G2i ran for 17:13 on a 68Wh battery, compared to the Dell’s 60Wh. The Dell Pro 7 14’s 26:18 aspect ratio shows what the same silicon can do behind a lower-resolution LCD, so the ten-hour gap is the price of the 2880 x 1800 Tandem OLED panel, not a platform deficiency. Sixteen and a half hours still clear a full workday with margin, and the panel is the point of this configuration.

Using Dell’s Express Charge feature, we observed recharge times of 0-50% in 23 minutes, 0-80% in 48 minutes, and 0-100% in 1 hour and 33 minutes.  For seeing over 16 hours of usable runtime from a full charge, you should be ready for a whole workday of use within 30 minutes and some change starting from 0%

Geekbench 6

Geekbench 6 is a cross-platform benchmark covering single-core, multi-core, and GPU compute workloads.

Geekbench 6 (higher is better) Dell Pro 14 Premium (Intel Graphics) HP EliteBook X G2i (Intel Graphics) Dell Pro 7 14 Intel (Intel Graphics) Lenovo ThinkPad P14s Gen 7 (RTX PRO 1000)
CPU Single-Core 2,894 2,804 2,862 2,808
CPU Multi-Core 16,763 16,390 16,787 16,319
GPU OpenCL 23,861 24,453 23,741 87,537
GPU Vulkan 26,456 26,528 25,533 73,204


The Premium posts the best single-core score in the 366H group at 2,894 and a multi-core score of 16,763, within about 2.5% of all three comps. GPU compute tells the iGPU story plainly: OpenCL and Vulkan land within a few percent of the HP and the Pro 7 14 on the same 4 Xe-core graphics, while the P14s Gen 7’s RTX PRO 1000 runs roughly three times ahead.

Geekbench 7

Geekbench 7 updates the workloads and scoring scale, so scores are not comparable with Geekbench 6.

Geekbench 7 (higher is better) Dell Pro 14 Premium (Intel Graphics) HP EliteBook X G2i (Intel Graphics) Dell Pro 7 14 Intel (Intel Graphics) Lenovo ThinkPad P14s Gen 7 (RTX PRO 1000)
CPU Single-Core 2,609 2,527 2,589 2,533
CPU Multi-Core 17,878 17,345 17,805 17,651
GPU OpenCL 23,849 23,737 23,876 75,340
GPU Vulkan 23,451 23,036 23,484 70,067


Here, the Premium leads all three comparison systems on both CPU measures, at 2,609 single-core and 17,878 multi-core. The margins over the identical 366H in the EliteBook (2,527 / 17,345) and the Pro 7 14 (2,589 / 17,805) are small but consistent, and they came out of the lightest chassis in the group. The GPU results repeat the 4 Xe cluster, with the three iGPU systems separated by less than 2%.

Cinebench 2026

Cinebench 2026 uses Maxon’s Redshift engine to render a production scene on the CPU; the GPU test requires more graphics memory than these integrated platforms allocate, so it runs only on the discrete-GPU comp.

Cinebench 2026 (higher is better) Dell Pro 14 Premium HP EliteBook X G2i Dell Pro 7 14 Intel Lenovo ThinkPad P14s Gen 7
CPU Single Thread 508 494 511 502
CPU Multiple Threads 3,857 4,060 3,807 4,492
GPU N/A N/A N/A 34,437


Single-thread lands at 508, splitting the 366H group between the Pro 7 14’s 511 and the HP’s 494. Multi-thread at 3,857 edges the Pro 7 14 but trails the EliteBook’s 4,060, the one CPU test where HP’s thermal tuning pulls ahead of this chassis, and the P14s clears everyone at 4,492 with more cooling mass to spend.

3DMark CPU Profile

3DMark CPU Profile scales the same workload from a single thread to the maximum available, showing how performance scales as threads are added.

3DMark CPU Profile (higher is better) Dell Pro 14 Premium HP EliteBook X G2i Dell Pro 7 14 Intel Lenovo ThinkPad P14s Gen 7
Max Threads 9,625 9,179 9,699 10,500
16 Threads 9,321 8,995 9,679 10,421
8 Threads 5,857 5,814 6,450 6,550
4 Threads 3,892 3,812 4,240 4,219
2 Threads 2,143 2,095 2,230 2,251
1 Thread 1,147 1,108 1,163 1,165


The full curve is tight against the other 366H machines: within 5% of the Pro 7 14 at every step and ahead of the EliteBook from 2 threads up, with a Max Threads score of 9,625. The P14s holds roughly a 9% lead at the top of the curve, consistent with its heavier thermal envelope.

7-Zip Compression

7-Zip’s built-in benchmark measures compression and decompression throughput in GIPS across all cores.

7-Zip 24.09 (GIPS, higher is better) Dell Pro 14 Premium HP EliteBook X G2i Dell Pro 7 14 Intel Lenovo ThinkPad P14s Gen 7
Compressing 86.300 89.259 83.281 90.364
Decompressing 79.533 86.189 76.774 90.526
Total Rating 82.916 87.724 81.2 90.445


The Premium’s 82.916 GIPS total rating sits between the Pro 7 14’s 81.2 and the EliteBook’s 87.724, with the P14s on top at 90.445. Decompression is the weaker half of the run at 79.533 GIPS; compression at 86.300 is within 4% of the group leaders.

y-cruncher

y-cruncher computes Pi to a fixed number of digits, stressing memory bandwidth in the standard runs and pure CPU throughput in the BBP runs.

y-cruncher (seconds, lower is better) Dell Pro 14 Premium HP EliteBook X G2i Dell Pro 7 14 Intel Lenovo ThinkPad P14s Gen 7
Pi 1B 34.930 34.920 34.775 26.685
Pi 2.5B 102.429 97.527 104.586 76.787
Pi 5B 227.217 N/A 240.554 172.994
Pi BBP 1B 1.905 1.842 1.835 1.621
Pi BBP 10B 23.152 22.451 21.280 18.200
Pi BBP 100B 292.475 269.011 301.611 219.969


The Premium completed the 5-billion-digit run at 227.2 seconds, a run the 32GB EliteBook could not attempt, and beat the Pro 7 14’s 240.6 seconds while trailing the P14s across the board. The BBP results track the same order. One note on the largest run: the 10B standard test was skipped due to insufficient available memory at test time despite the 64GB fit-out; the Pro 7 14 completed it on the same memory configuration.

Blender

Blender 5.2’s benchmark renders the Monster, Junkshop, and Classroom scenes on both GPU and CPU, with scores in samples per minute.

Blender 5.2 (samples/min, higher is better) Dell Pro 14 Premium (Intel Graphics) HP EliteBook X G2i (Intel Graphics) Dell Pro 7 14 Intel (Intel Graphics) Lenovo ThinkPad P14s Gen 7 (RTX PRO 1000)
GPU
Monster 236.31 250.14 254.40 922.95
Junkshop 181.84 154.95 189.59 795.65
Classroom 149.74 149.90 152.73 625.62
CPU
Monster 110.11 118.87 107.87 131.08
Junkshop 77.31 84.95 78.06 97.76
Classroom 52.17 57.45 53.90 68.45


GPU rendering is a wash across the 4 Xe systems; the Premium’s 236.31 on Monster trails the Pro 7 14 by about 7%, while its 181.84 on Junkshop leads the EliteBook by 17%, which is trading places within the same thermal band. The CPU runs end up a few percent behind the EliteBook. None of these are rendering machines, and the P14s column shows the gap a workstation GPU opens: roughly 4x on every GPU scene.

LuxMark

LuxMark v4 renders the Hall Bench and Food scenes with the OpenCL-based LuxCoreRender engine.

LuxMark v4 (higher is better) Dell Pro 14 Premium HP EliteBook X G2i Dell Pro 7 14 Intel Lenovo ThinkPad P14s Gen 7
Hall 2,577 2,481 2,168 11,342
Food 1,094 1,058 880 4,103


At 2,577 on Hall and 1,094 on Food, the Premium posts the best iGPU numbers in the group, about 4% ahead of the EliteBook and 19- 24% ahead of the Pro 7 14. That is the clearest case in the suite of this chassis sustaining iGPU clocks better than the volume Dell.

V-Ray

V-Ray’s GPU benchmark measures path-traced rendering throughput in vpaths.

V-Ray GPU (vpaths, higher is better) Dell Pro 14 Premium HP EliteBook X G2i Dell Pro 7 14 Intel Lenovo ThinkPad P14s Gen 7
CUDA Engine 793 850 775 1,568
RTX Engine N/A N/A N/A 2,589


The 793 vpaths result splits its two 366H comps, ahead of the Pro 7 14’s 775 and behind the EliteBook’s 850. The RTX engine row belongs to the P14s alone; nothing integrated runs it.

Blackmagic RAW Speed Test

Blackmagic RAW Speed Test measures 8K BRAW 12:1 decode throughput on CPU and GPU, a practical proxy for editing timeline scrubbing.

Blackmagic RAW Speed Test (fps, higher is better) Dell Pro 14 Premium HP EliteBook X G2i Dell Pro 7 14 Intel Lenovo ThinkPad P14s Gen 7
8K 12:1 CPU 68 72 68 77
8K 12:1 GPU 48 48 48 96


CPU decode at 68 fps and GPU decode at 48 fps match the Pro 7 14 exactly and sit within 6% of the EliteBook. Every 4 Xe system converges on 48 fps for GPU decode; the P14s doubles it.

Topaz Video AI

Topaz Video AI runs its built-in benchmark at 1080p input across upscaling, denoising, frame interpolation, and slow-motion models.

Topaz Video AI (fps, higher is better) Dell Pro 14 Premium HP EliteBook X G2i Dell Pro 7 14 Intel Lenovo ThinkPad P14s Gen 7 (RTX PRO 1000)
Artemis 1X / 2X / 4X 2.57 / 2.62 / 0.99 2.45 / 2.48 / 0.91 2.51 / 2.53 / 0.95 5.17 / 3.19 / 1.12
Iris 1X / 2X / 4X 2.44 / 1.41 / 0.43 2.44 / 1.40 / 0.43 2.38 / 1.37 / 0.42 5.91 / 3.12 / 1.01
Proteus 1X / 2X / 4X 2.60 / 2.84 / 1.10 2.59 / 2.86 / 1.11 2.52 / 2.76 / 1.06 4.78 / 3.14 / 1.05
Gaia 1X / 2X / 4X 1.36 / 0.92 / 0.70 1.34 / 0.91 / 0.69 1.31 / 0.89 / 0.67 1.62 / 1.13 / 0.79
Nyx 1X / 2X 0.73 / 0.73 0.72 / 0.72 0.71 / 0.71 2.40 / 2.09
Hyperion HDR 1X 2.15 2.08 2.02 14.56
4X Slowmo Apollo / APFast 4.61 / 16.14 4.61 / 16.06 3.08 / 14.64 10.39 / 29.94
16X Slowmo Aion DNF DNF DNF N/A


The three 366H systems are functionally interchangeable here, with the Premium a few hundredths ahead on most rows, including Gaia 4X at 0.70 fps. The 16X Slowmo Aion model failed to complete on this unit, as it has on every integrated-graphics system in this stack. These workloads require the P14s-class of hardware or better; the iGPU numbers are for completeness.

UL Procyon AI Text Generation

Procyon AI Text Generation runs four local LLMs (Phi, Mistral, Llama3, Llama2) and scores generation performance. Across all four machines, we are running the same CPU model, as shown in our results. For the most part, we see pretty close results, with the EliteBook X G2i possibly taking a thermal hit compared to the larger models.

Procyon AI Text Generation (higher is better) Dell Pro 14 Premium HP EliteBook X G2i Dell Pro 7 14 Intel Lenovo ThinkPad P14s Gen 7 (IGPU / RTX PRO 1000)
Phi 1,121 1,082 1027 1071 / 1,618
Mistral 1,111 1,053 1027 1058 / 1,397
Llama3 1,099 952 1014 1047 / 1,252
Llama2 1,053 993 1009 1012 / DNF


In this test, the Premium leads all three competitors on all four models. On the pro 7 14, 1,121 against 1,027 on Phi and 1,099 against 1,014 on Llama3. We also ran the suite on the 50 TOPS NPU, which scored 831 / 717 / 697 / 593 across the four models. That is slower than the iGPU path, but it comes at a fraction of the power draw, the trade-off Copilot+ workloads are designed to make.

UL Procyon AI Image Generation

Procyon AI Image Generation measures Stable Diffusion throughput; SD 1.5 runs at FP16 and INT8 precision, with an additional INT8 run on the NPU, plus the heavier SDXL FP16 workload.

Procyon AI Image Generation (higher is better) Dell Pro 14 Premium HP EliteBook X G2i Dell Pro 7 14 Intel Lenovo ThinkPad P14s Gen 7 (RTX PRO 1000)
SD 1.5 FP16 253 258 258 943
SD 1.5 INT8 3,604 3,529 3,575 12,403
SD 1.5 INT8 (NPU) 2,888 N/A N/A N/A
SDXL FP16 DNF 307 268 765


SD 1.5 results are engine-matched (OpenVINO) across the three iGPU systems and effectively tied: 253 at FP16 and 3,604 at INT8, the latter a hair ahead of both comps. The NPU INT8 run scored 2,888, about 80% of iGPU throughput. SDXL FP16 is the outlier: the run crashed the system twice, and we skipped it per lab policy, a workload the EliteBook completed at 307 on identical silicon. Either way, the practical takeaway is that SDXL-class model loads are where this iGPU tier runs out of road.

UL Procyon AI Computer Vision

Procyon AI Computer Vision runs six inference models under WinML, giving a CPU and GPU view of traditional vision workloads.

Procyon AI Computer Vision (WinML, higher is better) Dell Pro 14 Premium HP EliteBook X G2i Dell Pro 7 14 Intel Lenovo ThinkPad P14s Gen 7
CPU 120 126 121 134
GPU 213 205 205 426


Here we can see a little bit of variance, but the Pro 14 Premium, EliteBook X G2i, and Pro 7 14 all stayed pretty close together, with the biggest gap in the GPU test on the P14s Gen 7. Other than that, the Pro 14 Premium took a slight lead in the GPU test until it met the P14s Gen7.

SPECviewperf 15

SPECviewperf 15 measures professional visualization viewsets from 3ds Max, Blender, CATIA, Creo, Maya, Siemens NX, SolidWorks, and others, run here at FHD.

SPECviewperf 15 (FHD, higher is better) Dell Pro 14 Premium HP EliteBook X G2i Dell Pro 7 14 Intel Lenovo ThinkPad P14s Gen 7 (RTX PRO 1000)
3dsmax-08 9.41 8.70 9.58 28.20
blender-01 9.23 9.26 9.11 40.69
catia-07 5.46 5.66 5.27 43.36
creo-04 18.49 18.85 18.27 107.59
energy-04 3.60 3.62 3.68 45.79
enscape-01 6.20 6.29 6.22 25.45
maya-07 48.77 52.56 49.54 112.84
medical-04 9.79 9.97 9.91 86.38
snx-05 37.99 37.45 37.74 103.61
solidworks-08 11.77 12.37 11.86 53.63
unreal_engine-01 21.81 21.47 21.36 49.24


All eleven viewsets produced scores, and the three 366H systems land within a few percent of one another on nearly every one; maya-07 at 48.77 and snx-05 at 37.99 are representative. Nobody should buy any of these three for viewport work, and the P14s column, 2.5x to 8x ahead, is the quantified argument for stepping up to certified workstation graphics.

SPECworkstation 4

SPECworkstation 4 aggregates real application workloads into hardware subsystem scores and industry vertical scores.

SPECworkstation 4 (SPEC ratio, higher is better) Dell Pro 14 Premium HP EliteBook X G2i Dell Pro 7 14 Intel Lenovo ThinkPad P14s Gen 7
Hardware Subsystems
CPU 1.15 1.16 1.08 1.35
Graphics 0.82 0.80 0.82 4.51
Accelerator N/A 1.46 N/A 3.26
Storage 0.96 1.65 1.68 1.67
Industry Verticals
AI & Machine Learning 1.15 1.16 1.18 1.65
Energy 0.91 1.02 0.90 1.69
Financial Services 0.77 0.79 0.78 0.96
Life Sciences 1.17 1.14 1.04 1.82
Media & Entertainment DNF 1.24 1.16 1.81
Product Design 1.29 1.47 1.41 1.89
Productivity & Development 0.86 0.93 1.04 1.34


CPU at 1.15 matches the EliteBook and leads the Pro 7 14; Graphics at 0.82 is the familiar 4 Xe result. The Storage subsystem is the outlier at 0.96, compared to 1.65- 1.6868 for every comp, and it is a real hardware difference that we detail in the next section. The Media & Entertainment vertical did not produce a score because the HandBrake workload failed to complete; 22 of 23 workloads were scored.

Storage Performance

We look at storage with 3DMark’s Storage Benchmark and the Blackmagic Disk Speed Test.

Storage Dell Pro 14 Premium HP EliteBook X G2i Dell Pro 7 14 Intel Lenovo ThinkPad P14s Gen 7
3DMark Storage 1,913 3,156 3,259 3,094
Blackmagic Write (MB/s) 4,574.1 8,949.2 8,934.5 8,262.3
Blackmagic Read (MB/s) 4,954.5 7,919.3 8,398.6 8,511.5


This is the clearest cost-saving in the build. The 1TB Samsung PM9C1b is a Gen4 value drive, and it shows: 4,954.5 MB/s reads and 4,574.1 MB/s writes against roughly 8,000-8,900 MB/s for the Gen5 drives in all three comparison systems, with a 3DMark Storage score of 1,913 against their 3,094- 3,259. For the office and collaboration workloads this machine targets, the difference rarely surfaces in feel, but a flagship config shipping the slowest drive in its comp set is worth knowing about, and SPECworkstation’s storage subsystem score above says the same thing. Most users will want to configure this system with a Gen5 SSD to take full advantage.

Conclusion

The Pro 14 Premium is the best build Dell makes of its lightest commercial laptop, and the configuration mostly delivers on that framing. The 366H posts the strongest Geekbench 7 CPU numbers of any system we have tested on this silicon. LuxMark indicates the chassis sustains iGPU clocks better than the Pro 7 14, and it does so at around 2.5 pounds with a Tandem OLED panel, vPro Enterprise, and a customer-replaceable battery. Sixteen and a half hours of tested battery life covers the mobility brief even with the premium panel; buyers who value runtime over the panel can spec the WUXGA LCD and aim for the Pro 7 14’s 26-hour class instead.

Dell Pro 14 Premium rear three-quarter view with the Dell logo on the magnesium lid

The trade-offs are the graphics ceiling and the SSD. The 4 Xe iGPU is the top graphics option across the entire line, so there is no upsell path for anyone whose workload touches rendering, viewports, or heavier local AI image generation; that buyer moves to a mobile workstation. And the Gen4 PM9C1b is a conspicuous decision, with the system at $5,219 as tested, at roughly half the throughput of every drive in its comp set. Most buyers should opt for the Gen5 part instead.

Though it may not feel as solid as an aluminum shell, the magnesium chassis still offers good durability while shaving off a few ounces for portability. The display shows a little reflection from a nearby light fixture, but the image quality of the Tandem OLED panel makes up for it. Though it may not be for graphic design or CAD workloads, the Pro 14 Premium makes a great office workhorse for on-the-go work, running between meetings, or even toting it home thanks to its lightweight, low-profile chassis.
The Dell Pro 14 Premium now sits at #11 on our Laptop Battery Life Leaderboard with its 16 hour 30 minute result, and appears in our Best Business Laptops coverage.

Dell Pro 14 Premium Product Page

The post Dell Pro 14 Premium Review: A 2.55-Pound Magnesium Flagship With Tandem OLED appeared first on StorageReview.com.

MSI XpertStation WS300 Review: 748GB of Coherent Memory and 20 PetaFLOPS on a Desk

24 August 2026 at 19:16
MSI XpertStation WS300 on a desk with the side panel off, copper cold plates and liquid cooling visible MSI XpertStation WS300 on a desk with the side panel off, copper cold plates and liquid cooling visible

The MSI XpertStation WS300 is built on NVIDIA’s newest DGX Station architecture, the most capable generation yet, placing a full GB300 Grace Blackwell Ultra node beside your desk. The headline number is 20 petaFLOPS of FP4 compute, delivered by a single Blackwell Ultra GPU tied to a 72-core Grace CPU over a 900GB/s NVLink-C2C link. Both processors draw from one coherent 748GB memory pool; 252GB of HBM3e paired with 496GB of LPDDR5X, enough to keep a trillion-parameter model resident in local memory.

MSI XpertStation WS300 GB300 DGX Station on a desk with monitor and keyboard, side panel removed showing the copper liquid cooling plates

The DGX Station also supports clustering multiple units using its ConnectX-8 SuperNIC, which exposes two 400GbE ports for 800Gb/s of fabric. The result is a datacenter-class machine that can run in a home or office rather than a server hall.

NVIDIA DGX Station Technical Specifications

The XpertStation WS300 is MSI’s implementation of NVIDIA’s GB300 DGX Station platform. NVIDIA supplies the Grace Blackwell Ultra baseboard and software environment, while MSI supplies the chassis, liquid cooling, power delivery, storage layout, external I/O, and service model that turn the platform into a complete deskside system. Because the Grace CPU, Blackwell Ultra GPU, NVLink-C2C interconnect, and ConnectX-8 networking are fixed, the real OEM differentiation is in how effectively the surrounding system sustains, manages, and exposes that hardware.

Specification Details
Architecture
CPU NVIDIA Grace, 72-core Arm Neoverse V2
GPU NVIDIA Blackwell Ultra (B300)
Tensor Cores 5th Generation
CPU-GPU Interconnect NVLink-C2C, 900 GB/s bidirectional
Memory
Coherent Memory Up to 748 GB
GPU Memory Up to 252 GB HBM3e
GPU Memory Bandwidth 7.1 TB/s
CPU Memory Up to 496 GB LPDDR5X (4 x SOCAMM)
CPU Memory Bandwidth 396 GB/s
Storage
Boot Drives 2 x M.2 2280 PCIe 5.0 x4 NVMe (CPU-attached), populated with 2 x 2TB in RAID 1
Expansion Drives 2 x M.2 2280 PCIe 6.0 x4 NVMe (ConnectX-8-attached), open from factory
Networking
NIC NVIDIA ConnectX-8 SuperNIC, 2 x 400G QSFP112 (800 Gb/s aggregate)
Ethernet 1 x 10GBase-T RJ45 (Marvell AQC113)
Management Port 1 x 1000Base-T RJ45 (dedicated out-of-band)
Wireless M.2 2230 Key-E slot, PCIe 2.0 x1 (Wi-Fi 6E / Wi-Fi 7, Bluetooth)
Expansion
PCIe Slots 1 x PCIe 5.0 x16 FHFL double-wide; 2 x PCIe 5.0 x16 FHFL single-wide (x8 signals)
Supported Add-in GPUs NVIDIA RTX PRO 2000 Blackwell, RTX PRO 4000 Blackwell SFF, RTX PRO 6000 Blackwell Workstation / Max-Q
Front / Top I/O
USB 2 x USB 3.2 Gen 2 Type-A; 2 x USB 3.2 Gen 2 Type-C (5V/3A)
Audio 2 x jacks (line-out / mic)
Rear I/O
USB 4 x USB 10Gbps Type-A; 1 x Micro-USB COM (serial console)
Display 1 x Mini DisplayPort (BMC video, max 1024 x 768, no DP++)
Audio 3 x jacks (line-in / line-out / mic)
Management & Security
BMC ASPEED AST2600 with AMI MegaRAC firmware, IPMI 2.0 and Redfish, eMMC local storage
Security TPM 2.0, chassis intrusion, Microchip CEC1736 hardware root of trust (ERoT)
Cooling
Liquid Cooling Liquid cooling module rated for 1400W CPU + GPU, with blocks on GPU, CPU, memory, and ConnectX-8
Radiators / Fans 2 x 360mm radiators; 1 x 12025 system fan
Power
Power Supply 1 x 1600W ATX, 80 PLUS Platinum (150 x 86 x 210 mm)
AC Input 100-114Vac, 15A, 47-63Hz (max 1300W output); 115-240Vac, 15-8A, 47-63Hz (max 1600W output)
Form Factor
Dimensions 245.7 x 529.0 x 570.4 mm (9.67 x 20.83 x 22.46 in), W x H x D

Design and Build

MSI XpertStation WS300 tower exterior with mesh front panel and MSI branding
At first glance, the XpertStation looks like a standard modern workstation with a sleek professional design. Take the side panel off, and the resemblance ends there.

Inside the MSI XpertStation WS300: copper cold plates over the GB300 Superchip, radiator fans, and the vertical support brace

GB300 Grace Blackwell Ultra Desktop Superchip

At the center of the WS300 is our star of the show: NVIDIA’s B300 GPU, built on the Blackwell Ultra architecture.

NVIDIA B300 Blackwell Ultra GPU package close-up on the GB300 baseboard of the MSI XpertStation WS300
NVIDIA Blackwell Ultra B300 GPU diagram, annotated by StorageReview

Source: NVIDIA, annotated by StorageReview

The B300 is one of the most advanced GPUs available today, featuring a dual-reticle design built on TSMC’s 4NP process. The two dies are joined by NVIDIA’s 10TB/s NV-HBI die-to-die interface, allowing the GPU to operate as a single CUDA accelerator. The B300 used in DGX Station is based on the 208-billion-transistor Blackwell Ultra design, with up to 160 SMs and 640 fifth-generation Tensor Cores. It also features 252GB of HBM3e with 7.1TB/s of memory bandwidth. As a data center part, the B300 lacks normal display output and NVENC hardware encoders. It does, however, include seven NVDEC engines and seven nvJPEG decoders. The GPU also supports MIG, allowing it to be partitioned into as many as seven isolated instances. Looking at compute, the B300 offers:

Precision Peak Performance
B300 Compute Performance
NVFP4 Tensor Core 20 PFLOPS sparse / 15 PFLOPS dense
FP8 / FP6 Tensor Core 10 PFLOPS
INT8 Tensor Core 330 TOPS
FP16 / BF16 Tensor Core 5 PFLOPS
TF32 Tensor Core 2.5 PFLOPS
FP32 80 TFLOPS
FP64 / FP64 Tensor Core 1.3 TFLOPS
Peak rates are based on GPU boost clock. Tensor Core specifications use sparsity unless otherwise noted.

Paired with the B300 is Grace, NVIDIA’s first data-center CPU. It uses 72 Arm Neoverse V2 cores, but the surrounding processor is NVIDIA’s own design, including the cache hierarchy, memory controllers, system I/O, Scalable Coherency Fabric, and NVLink-C2C interface. Grace exposes 72 cores and 72 hardware threads, with each core implementing Armv9 with cryptography extensions and four 128-bit SVE2 vector units. The core has a six-way instruction decoder capable of dispatching up to eight instructions per clock, six scalar ALUs, 64KB each of L1 instruction and data cache, and 1MB of private L2. Across the die, the CPU shares 114MB of L3 cache.

NVIDIA GB300 baseboard from the MSI XpertStation WS300 with SOCAMM memory modules and PCIe slots visible

The cores and L3 cache slices are connected through NVIDIA’s Scalable Coherency Fabric, a mesh interconnect with 3.2TB/s of bisection bandwidth. The fabric also connects the CPU cores to memory, system I/O, and the NVLink-C2C interface, giving Grace the data-movement bandwidth needed to keep the B300 fed. In the WS300, Grace handles the CPU-side work surrounding the accelerator: GPU kernel launches, data loading, preprocessing, tokenization, and model orchestration. The topology view below gives a clear look at the single-socket design, with one 72-core Grace CPU and the platform devices connected around it.

MSI XpertStation WS300 system topology diagram showing the Grace CPU, PCIe lanes, and platform devices
Grace is paired with 496GB of LPDDR5X memory, delivering 396GB/s of bandwidth. Rather than soldering the memory directly to the baseboard, DGX Station uses four SOCAMM modules. SOCAMM, or System-on-Chip Advanced Memory Module, packages LPDDR5X in a compact, removable form factor. This allows the platform to retain the bandwidth and power-efficiency benefits of LPDDR5X while making the memory serviceable. A failed module can be replaced without replacing the entire baseboard.

Connecting Grace and the B300 is NVIDIA’s NVLink-C2C interface, a package-level interconnect that delivers 900GB/s of bidirectional bandwidth, roughly seven times that of a PCIe Gen5 x16 connection. The more important difference is memory coherence. In a conventional workstation, the CPU and discrete GPU maintain separate memory spaces, with data copied between them over PCIe. With NVLink-C2C, Grace and B300 share a coherent address space, allowing each processor to directly access memory attached to the other.

The result is a 748GB coherent address space, not a 748GB block of HBM. The B300 has 252GB of HBM3e delivering 7.1TB/s, while Grace contributes 496GB of LPDDR5X at 396GB/s. Data held in Grace memory must still cross the C2C link, so HBM remains the best location for frequently accessed model weights, tensors, and buffers. Grace memory instead acts as a large-capacity tier, allowing workloads that exceed the B300’s 252GB of local memory to remain on one system rather than being split across multiple GPUs. We will measure the performance impact of crossing into that second memory tier later in the testing section.

System topology

Moving out from the GB300 package, MSI’s block diagram shows how the rest of the system connects around Grace. The CPU sits at the center of the I/O topology, with two PCIe 5.0 x4 M.2 slots attached directly to it. MSI populates these with a pair of 2TB Micron 4600 SSDs configured in RAID 1 for the operating system and NVIDIA software stack. The three full-length expansion slots also come directly off Grace, with one PCIe 5.0 x16 link and two PCIe 5.0 x8 links.

NVIDIA RTX Pro 2000 inside the MSI XpertStation WS300

MSI has also prepared the chassis for a large add-in GPU. A pre-wired 12VHPWR power lead is easy to reach at the front of the chassis, avoiding the need to route another cable through the system. The vertical metal brace that stiffens the chassis also incorporates an anti-sag bracket to support long, heavy RTX PRO cards.

A USB controller on the Grace side handles the system’s main front and rear USB ports, along with the audio codec. Grace also connects to the ASPEED AST2600 BMC, which provides a dedicated 1GbE management port, a Mini DisplayPort output limited to 1024 x 768, and a Micro-USB serial console. The Mini DisplayPort is intended for initial setup and troubleshooting, not as the system’s primary display output. Anyone planning to use the WS300 as a conventional desktop will still need one of the optional RTX PRO add-in cards.

MSI XpertStation GB300 block diagram showing ConnectX-8 acting as a secondary I/O hub
The other major branch is NVIDIA’s ConnectX-8 SuperNIC. Its most visible feature is the pair of 400GbE QSFP112 ports on the rear panel, providing up to 800Gb/s of aggregate network bandwidth. ConnectX-8 also carries 48 lanes of PCIe Gen6 and includes an integrated PCIe switch, allowing MSI to use it as a secondary I/O hub rather than simply a network adapter.
Two 2TB Micron 4600 NVMe SSDs under heatsinks in the MSI XpertStation WS300 M.2 slots

Two PCIe 6.0 x4 links from the ConnectX-8 feed the remaining M.2 2280 slots, which MSI leaves open for expansion. The same branch also connects the M.2 2230 Wi-Fi and Bluetooth slot over PCIe 2.0 x1, the Marvell AQC113 controller for the 10GBase-T port, and a second USB controller serving an additional front-panel USB path.

Power and cooling

Powering the WS300 is a single 1,600W 80 PLUS Platinum ATX power supply with a C19 input. For North American installations, the DGX Station requires a dedicated 20A circuit to provide the system with its full power envelope.

Power delivery in the MSI XpertStation WS300 with its 1,600W 80 PLUS Platinum supply

The 1,600W rating is the ceiling for the entire system. Grace, the B300, storage, pumps, fans, and any optional RTX PRO card all draw from the same supply. Adding a high-power graphics card expands the WS300’s capabilities, but it does not pull from a different pool of power. When the B300 and RTX card are both under load, they have to share what is already available, which can reduce the performance of the B300 GPU.

MSI handles the resulting thermal load with a custom liquid loop covering the B300, Grace CPU, SOCAMM memory, and ConnectX-8, including the optical cages. Heat is sent through two 360mm radiators, while a separate 120mm fan moves air through the rest of the chassis. MSI rates the cooling assembly for up to 1,400W across the CPU and GPU. During our testing the B300 temperature peaked at 71C while the CPU never got hotter than 65C at 1292W of power being consumed by the GPU.

Liquid cooling radiator, fans, and braided tubing inside the MSI XpertStation WS300

Power sloshing

NVIDIA manages that shared budget through the vsloshd service. In its default dynamic mode, the service monitors the real-time power draw of the GB300 module and an optional RTX PRO card, shifting available headroom between them rather than holding each device to a fixed limit. Under the current policy, the RTX card gets priority, so when it needs more power, the system first lowers the GB300 power cap before raising the RTX cap. With no RTX card installed, the full policy budget remains available to the GB300 module.

This means the optional RTX PRO 6000 is not simply additional performance on top of the B300. When both GPUs are busy, power assigned to the RTX card comes directly out of the GB300 budget and can reduce B300 clocks and performance.

The platform also includes a hardware power brake for cases where the system detects degraded power delivery. We saw this during our hands-on work when loose power connectors caused the WS300 to lower its power limit rather than shut down or continue drawing at full power through a compromised connection. The machine remained online in the reduced-power state until the connection issue was addressed.

Connectivity

Before moving on from the chassis, the front and rear I/O are worth a quick look. The front IO consists of two USB 3.2 Gen 2 Type-A ports, two USB 3.2 Gen 2 Type-C ports, separate line-out and microphone jacks, and the power and reset controls.

Front panel of the MSI XpertStation WS300 with USB Type-A and Type-C ports, audio jacks, and power controls

The rear panel is split between workstation connectivity and the server hardware underneath. ConnectX-8 provides two 400GbE QSFP112 ports, while a separate 10GBase-T port handles normal host networking and a dedicated 1GbE port connects to the BMC. Four 10Gbps USB Type-A ports and three audio jacks cover local peripherals. The BMC also exposes a Micro-USB serial console and a Mini DisplayPort. The C19 power inlet sits at the bottom of the chassis, and Wi-Fi 6E or Wi-Fi 7 with Bluetooth can be added through the internal M.2 2230 Key-E slot.

Rear panel of the MSI XpertStation WS300 with dual 400GbE QSFP112 ports, 10GBase-T, BMC management, and USB

Datacenter Workloads on the Desk

Everything to this point has described what the DGX Station is; the more useful question for buyers is what the XpertStation enables a team to do. The value of the WS300 becomes clearer when you treat it as a development platform rather than simply a high-capacity inference system. Its B300 GPU, Grace CPU, MIG support, optional RTX PRO graphics, and datacenter software stack bring several workflows that would normally depend on shared cluster hardware onto a single local node.

MIG as a development tool

Imagine running several completely separate jobs on one GPU at the same time, each sealed off from the others. That is what Multi-Instance GPU (MIG) does: it spatially segments the B300 in hardware into as many as seven equally sized slices, or instances. Each instance gets its own fixed share of SMs, HBM, cache, and memory bandwidth, carries its own device identity, and appears to CUDA as a separate GPU.

This makes it possible to develop, test, and validate multi-GPU workloads; train scripts; and develop for tools like Dynamo, LLM-D, etc.

Terminal output on the MSI XpertStation WS300 showing the GB300 partitioned into three MIG 2g.63gb instances, each serving a vLLM engine under Dynamo on k3s

For our testing, we configured the B300 with 3x MIG instances and used them to bring up NVIDIA Dynamo components on separate CUDA-visible devices. This mirrors how much of our own benchmark tooling gets built: validating that it behaves exactly as intended means iterating against real hardware over and over. Having a local B300 we can carve up and reconfigure, without scheduling time on a shared server, and without the power draw, heat, and noise of a rack in the room, removes a surprising amount of overhead from that kind of iterative work.

Isaac GR00T and the physical AI loop

Another workflow that fits the DGX Station particularly well is physical AI.

We have tested this type of workflow before, but it required several systems equipped with different classes of GPUs. The DGX Station brings those previously separate stages together in one desk-side machine.

The process begins with teleoperation: an operator guides the robot through a task to capture a small set of real-world demonstrations. Those examples then enter the Isaac GR00T workflow. The optional RTX PRO GPU handles the graphics and ray-tracing demands of Isaac Sim, while Isaac Lab and GR00T-Mimic expand the original demonstrations into a much larger collection of physically plausible synthetic trajectories. Finally, the B300 fine-tunes the GR00T model using the combined real and synthetic dataset.

NVIDIA Isaac GR00T N model workflow diagram from data generation and post-training through simulation and hardware in the loop testing to deployment on a Jetson Thor robot

Source: NVIDIA

After fine-tuning, the resulting policy can be validated in simulation before being deployed to the robot for real-world evaluation. That creates a tight development loop: capture a real demonstration, reproduce and vary it in simulation, retrain the model, and test the updated policy on the hardware. For teams with limited access to robots, operators, or data-collection windows, consolidating simulation, synthetic-data generation, and model training in a single desk-side system can significantly reduce the friction of each iteration.

Blackwell Ultra kernel development

Arguably, however, the best use case for the DGX Station is kernel optimization. When a team is writing CUDA or Triton kernels for Blackwell Ultra, there is no substitute for running on the target architecture. The WS300 puts a B300 and 252GB of HBM3e beside the developer, making it possible to profile real workloads, inspect memory behavior, tune Tensor Core paths, fuse operations, and iterate without booking time on an eight-GPU server or rack-scale system.

Larger systems still matter, but they can be reserved for work that requires them: NVLink scaling, NCCL collectives, communication kernels, multi-GPU inference, and final throughput validation. The WS300 handles the single-GPU kernel work locally, keeping those expensive shared systems available for scaled-up testing. For a team focused on Blackwell Ultra optimization, this is about as direct a development machine as the market offers.

Had the DGX Station shipped alongside the first Blackwell Ultra systems, we suspect the initial supply would have disappeared almost immediately into AI labs, compiler teams, inference-engine developers, and other groups racing to tune software for B300. Even now, direct access to the target GPU may be the clearest reason for an organization to buy one.

Performance

Testing note: Testing was conducted remotely on an MSI-hosted system, with StorageReview controlling the full software environment throughout the evaluation window. The system was tested without an RTX PRO GPU or any other PCIe add-in cards installed. This left the GB300 Superchip with the system’s full available accelerator power budget throughout testing.

Maximum Achievable Matmul FLOPS (MAMF)

First, to put B300’s compute in context, we ran MAMF across three Blackwell-generation systems. MAMF (Maximum Achievable Matmul FLOPS) is a practical performance metric designed to measure the realistic peak floating-point operations per second that can be achieved on machine learning accelerators during matrix multiplication operations, offering a more accurate benchmark than the theoretical peak FLOPS often advertised in hardware specifications.

For this test, we sweep each of the 3 systems in BF16, FP8, and NVFP4, and we report the best sustained (dense) result per precision.

MAMF benchmark chart: GB300 vs RTX PRO 6000 and DGX Spark peak matmul TFLOPS in BF16, FP8, and NVFP4

The GB300 leads in every precision. In BF16, it reaches 1,967 TFLOPS against 412 on the RTX PRO 6000 and 104 on the DGX Spark. FP8 follows the same pattern: 3,909, 763, and 211. NVFP4 brings the GB300 to 6,134 TFLOPS, with the RTX PRO 6000 at 1,449 and the Spark at 364. The ratios are remarkably stable across all three precisions: the GB300 holds a 4 to 5x advantage over the RTX PRO 6000 and 17 to 19x over the Spark, while the RTX PRO 6000 maintains roughly 4x over the Spark.

NVBandwidth

Raw compute throughput is only useful if the accelerator can keep its execution units supplied with data. This is especially important for AI inference, where token generation during the decode phase is often limited more by memory bandwidth than by available FLOPS.

On the GB300 Superchip, that hierarchy spans the B300’s local HBM3e, Grace’s LPDDR5X memory, and the NVLink-C2C interconnect connecting them. NVIDIA’s NVBandwidth utility exercises the different copy paths across those components, showing both the bandwidth available inside the GPU and the cost of moving data between the GPU and CPU memory domains.

NVBandwidth results for the GB300: HBM3e local bandwidth and NVLink-C2C transfers to Grace LPDDR5X memory

The first four tests measure data movement within the B300’s 252GB of HBM3e. Device-local reads reach 6,875 GB/s, or approximately 6.9 TB/s, placing the result within a few percent of the GPU’s rated 7.1 TB/s memory bandwidth. Device-local writes reach 6,009 GB/s.

HBM-to-HBM copy operations are lower because every copy consumes bandwidth twice: once to read the source and again to write the destination. The dedicated copy engines reach 3,100 GB/s, while the Tensor Memory Accelerator records 2,527 GB/s.

The remaining tests cross NVLink-C2C and access Grace’s 496GB of LPDDR5X memory. Transfers from Grace memory into B300 HBM reach 390 GB/s, while transfers in the opposite direction reach 382 GB/s. Although NVLink-C2C provides up to 900 GB/s of coherent bandwidth between the CPU and GPU, the measured transfers are limited by Grace’s 396 GB/s LPDDR5X memory bandwidth. Bidirectional transfers further expose that constraint. Simultaneous traffic reaches 253 GB/s using SM-based copies and 192 GB/s through the copy engines.

Inference

With the low-level tests covered, we move to LLM inference. Here, the focus shifts from peak numbers to tokens per second, time to first token, and latency under load, giving us a better view of how the WS300 behaves as a serving system.

Let’s begin with the GB300 Superchip’s defining capability: serving models on either side of the B300’s 252GB HBM3e capacity limit. This is where its 748GB coherent memory pool matters most. The five checkpoints progress from two models that fit comfortably in HBM, to one that nominally fits but leaves too little headroom for the runtime and KV cache, and finally to two that must offload substantial portions of their weights to Grace memory.

Note: Where mentioned, models were run with speculative decoding for higher decode throughput, with the forced acceptance token amount set to the speculative decode token amount. The results therefore show best-case performance; in real-world serving, throughput is dynamic and depends on the quality of speculative-decode tokens.

Models that fit completely in HBM

DeepSeek v4 Flash (0731)

First up was the wildly popular DeepSeek v4 Flash (0731), which consumes 14+6GB of memory as a native FP8 checkpoint. This model is known to be very efficient and easy to run, which is what we experienced on the DGX Station. In the 512/512 workload, output throughput started at 149 tokens per second at concurrency 1, climbing rapidly to 1,766 at concurrency 32. The prefill-heavy workload scaled from 146 to 949 tokens per second.
DeepSeek V4 Flash throughput on the MSI XpertStation WS300 across concurrency levels
Total token throughput scaled in lockstep, with the 512/512 workload climbing from 298 to 3,532 tokens per second and the prefill-heavy workload rising from 1,311 to 8,537
DeepSeek V4 Flash total throughput on the MSI XpertStation WS300

MiniMax M2.7 (NVFP4)

Next up is MiniMax M2.7, one of our favorite models, tested using NVIDIA’s NVFP4 quant, occupying 125GB of VRAM. In the 512/512 workload, output throughput started at 193 tokens per second at concurrency 1 and scaled rapidly to 4,801 tokens per second at concurrency 128. The prefill-heavy workload increased from 195 tokens per second at concurrency 1 to 1,743 tokens per second at concurrency 64. Total token throughput showed the opposite trend, with the prefill-heavy workload climbing from 1,754 to 15,684 tokens per second through concurrency 64, while the 512/512 workload scaled from 424 to 9,602 tokens per second at concurrency 128.

MiniMax M2.7 NVFP4 throughput on the MSI XpertStation WS300
Total token throughput showed the opposite trend, with the prefill-heavy workload climbing from 1,754 to 15,684 tokens per second through concurrency 64, while the 512/512 workload scaled from 424 to 9,602 tokens per second at concurrency 128.
MiniMax M2.7 total throughput on the MSI XpertStation WS300

Models that barely fit in HBM

MiniMax M3 (NVFP4)

MiniMax M3 shows what barely fitting looks like in practice. Its 233GB NVFP4 checkpoint is smaller than the B300’s 252GB of HBM, but the model still needs room for the runtime and KV cache. It ultimately occupied 223GB of HBM, with 21GB of experts offloaded to Grace. EAGLE3-GQA speculative decoding was used with a synthetic acceptance length of 3 tokens. In the 512/512 workload, output throughput started at 197 tokens per second at concurrency 1 and scaled steadily to 1,041 tokens per second at concurrency 32. The prefill-heavy workload increased from 171 tokens per second at concurrency 1 to a peak of 278 at concurrency 2 before declining to 241 at concurrency 4.
MiniMax M3 NVFP4 throughput on the MSI XpertStation WS300 with experts offloaded to Grace memory
Total token throughput followed a similar pattern, with the 512/512 workload rising from 395 to 2,082 tokens per second, while the prefill-heavy workload peaked at 2,506 tokens per second at concurrency 2 before falling to 2,169 at concurrency 4
MiniMax M3 total throughput on the MSI XpertStation WS300

Models that do not fit in HBM

GLM-5.2 (NVFP4)

GLM-5.2 was tested using NVIDIA’s NVFP4 quant. Its 433GB checkpoint used 218GB of HBM, with 216GB of expert weights offloaded to Grace memory. MTP speculative decoding was used with a synthetic acceptance length of 3 tokens. Output throughput in the 512/512 workload increased from 36 tokens per second at concurrency 1 to 139 at concurrency 32. The 8,192/1,024 workload followed closely, rising from 35 to 118 tokens per second. The similar results between the two profiles show that generation remained limited primarily by moving the offloaded experts between Grace memory and the GPU. The sweep ended at concurrency 32 because there was not enough HBM left for additional context.

GLM-5.2 NVFP4 throughput on the MSI XpertStation WS300 with expert weights offloaded to Grace memory
Total token throughput followed the same pattern, with the 512/512 workload rising from 72 to 277 tokens per second and the prefill-heavy workload climbing from 314 to 1,062; here the longer prompts finally separate the two profiles, since the prefill tokens themselves count toward the total.
GLM-5.2 total throughput on the MSI XpertStation WS300

Nemotron-3-Ultra 550B (NVFP4)

Nemotron-3-Ultra 550B is the largest model we ran, and the one that most directly exercises the full coherent pool. It is a 307GB NVFP4 hybrid Transformer-Mamba model, far too large for HBM alone, with 114GB of its weights offloaded to Grace memory. MTP speculative decoding was used with a synthetic acceptance length of 5 tokens. Output throughput in the 512/512 workload started at 43 tokens per second at concurrency 1 and climbed to 168 at concurrency 32. The prefill-heavy workload told a more interesting story: throughput rose from 44 tokens per second at concurrency 1 to a peak of 122 at concurrency 2, but then fell back to 78 at concurrency 4 as the long prompts filled the limited KV cache. As with GLM-5.2, the two profiles track each other closely, again pointing at expert migration between Grace and the GPU as the limiting factor rather than compute. The sweep ended at concurrency 32 for the same reason: there was not enough HBM left for additional context.

Nemotron-3-Ultra 550B vLLM serving throughput on the MSI XpertStation WS300 with weights split across HBM and Grace memory

Total token throughput followed, with the prefill-heavy workload peaking at 2,506 tokens per second at concurrency 2 before declining to 2,169 at concurrency 4, while the 512/512 workload scaled from 85 to 336 tokens per second.

Nemotron-3-Ultra 550B total token throughput on the MSI XpertStation WS300 across both vLLM workload profiles

WS300 vs. Blackwell RTX PRO 6000 vs. DGX Spark

This half of our inference testing puts the WS300 up against the two other ways to get Blackwell on or near a desk: the Blackwell RTX PRO 6000, NVIDIA’s 600W workstation card, hosted in the Dell Pro Max Tower T2 we reviewed earlier, and the GB10 based DGX Spark, represented here by the Acer Veriton GN100. Each system ran the same vLLM live inference workloads under two scenarios, an equal workload with 512 input and 512 output tokens and a prefill heavy workload with 8,192 input and 1,024 output tokens, at concurrency levels from 1 to 128. We charted aggregate output and total throughput for every model all three systems can serve in common: GPT-OSS-20B and GPT-OSS-120B in their native MXFP4, Llama 3.1 8B at BF16, FP8, and NVFP4, and Mistral Small 24B and Qwen3 Coder 30B at BF16 and FP8.

GPT-OSS-20B

GPT-OSS-20B is the friendliest test of the set, a checkpoint that fits easily on all three systems. With the equal workload, the WS300 scaled cleanly to 22,161 output tokens per second at 128 concurrent streams, roughly 2.5 times the RTX PRO 6000 at 9,000 and 15 times the DGX Spark at 1,469. Single-stream results tell the same story in miniature: 530 tokens per second on the Station, 244 on the card, and 50 on the Spark.

vLLM serving throughput chart for GPT-OSS-20B comparing the MSI XpertStation WS300 (GB300 DGX Station), Blackwell RTX PRO 6000, and DGX Spark across concurrency levels

The prefill-heavy scenario separates the field further. Pushing 8,192 token prompts, the WS300 still delivered 9,572 output tokens per second at peak, which works out to more than 86,000 total tokens per second once prefill is counted, while the RTX PRO 6000 topped out at 2,892 and the Spark at 468.

vLLM total throughput chart for GPT-OSS-20B, input plus output tokens per second, comparing the MSI XpertStation WS300, Blackwell RTX PRO 6000, and DGX Spark

GPT-OSS-120B

Stepping up to GPT-OSS-120B, all three systems can still load the model, but the memory hierarchy starts to matter. The WS300 peaked at 9,294 output tokens per second under the equal workload, 2.7 times the RTX PRO 6000 at 3,384 and nearly 19 times the DGX Spark at 500.

vLLM serving throughput chart for GPT-OSS-120B comparing the MSI XpertStation WS300 (GB300 DGX Station), Blackwell RTX PRO 6000, and DGX Spark across concurrency levels

The prefill heavy run is where the smaller systems hit their ceilings. The RTX PRO 6000 flattened at 872 output tokens per second by 64 concurrent streams, and the Spark at 199, while the WS300 was still climbing at 128 streams and finished at 5,038, a gap of nearly 6x over the card. Long prompts swell the KV cache, and the systems with less memory headroom run out of room to batch long before the Station does.

vLLM total throughput chart for GPT-OSS-120B, input plus output tokens per second, comparing the MSI XpertStation WS300, Blackwell RTX PRO 6000, and DGX Spark

Llama 3.1 8B

Llama 3.1 8B is small enough that we could run it at BF16, FP8, and NVFP4 on every system, which makes it the cleanest look at what quantization buys on each machine. At 128 concurrent streams under the equal workload, the WS300 moved from 17,278 output tokens per second at BF16 to 28,698 at NVFP4, a 66 percent gain. The RTX PRO 6000 gained 114 percent from the same move, from 5,720 to 12,269, and the DGX Spark gained 143 percent, from 828 to 2,009. The pattern is worth remembering: the smaller the machine, the more quantization pays.

vLLM serving throughput chart for Llama 3.1 8B at BF16, FP8, and NVFP4 comparing the MSI XpertStation WS300, Blackwell RTX PRO 6000, and DGX Spark

Prefill heavy results compress the whole field, with the WS300’s NVFP4 run peaking at 6,744 output tokens per second against 2,064 for the card and 317 for the Spark.

vLLM total throughput chart for Llama 3.1 8B at BF16, FP8, and NVFP4 comparing the MSI XpertStation WS300, Blackwell RTX PRO 6000, and DGX Spark

Mistral Small 24B

Mistral Small 24B produced the widest gaps of the set. At FP8 under the equal workload, the WS300 peaked at 11,157 output tokens per second, three times the RTX PRO 6000 at 3,779 and 19 times the DGX Spark at 585. Single stream, the Station’s 169 tokens per second is much closer to interactive comfort than the Spark’s 9.

vLLM serving throughput chart for Mistral Small 24B at BF16 and FP8 comparing the MSI XpertStation WS300, Blackwell RTX PRO 6000, and DGX Spark

Under prefill heavy load, the RTX PRO 6000 peaked at just 32 concurrent streams and 560 output tokens per second before falling back, while the WS300 carried on to 2,316 at 128 streams.

vLLM total throughput chart for Mistral Small 24B at BF16 and FP8 comparing the MSI XpertStation WS300, Blackwell RTX PRO 6000, and DGX Spark

Qwen3 Coder 30B

Qwen3 Coder 30B, a mixture of experts model with a small active parameter count, is the one test where the smaller systems close the single stream gap. At one concurrent request under the equal workload, the RTX PRO 6000 delivered 208 output tokens per second to the WS300’s 310, the closest any result in this comparison comes to the Station, and even the Spark managed a usable 55. Batching restores the usual order: at 128 streams, the Station’s 12,425 output tokens per second at FP8 is 2.4 times the card and nearly 16 times the Spark.

vLLM serving throughput chart for Qwen3 Coder 30B at BF16 and FP8 comparing the MSI XpertStation WS300, Blackwell RTX PRO 6000, and DGX Spark

Prefill heavy followed the established pattern, with the WS300 reaching 3,851 output tokens per second while the card peaked at 1,077 and the Spark at 146.

vLLM total throughput chart for Qwen3 Coder 30B at BF16 and FP8 comparing the MSI XpertStation WS300, Blackwell RTX PRO 6000, and DGX Spark

Across the five shared models, the WS300 landed between 2.3 and 3 times the throughput of the Blackwell RTX PRO 6000 and 14 to 19 times the DGX Spark at full concurrency, with the margin widening toward 6x over the card when long prompts stress the KV cache. All three machines run the same CUDA stack and the same quantization paths; what the Station buys is memory capacity and bandwidth, which show up here as concurrency headroom and long context tolerance. Just as important is what these charts cannot show: none of the frontier scale models in the sections above will even load on the other two systems.

GDSIO

Modern AI workloads depend on moving data batches, model weights, and checkpoints from storage into GPU memory quickly enough to keep the accelerator busy. NVIDIA GPUDirect Storage, removes the traditional two-copy path in which data is first read from an SSD into system memory and then copied into GPU memory.

The GB300 DGX Station implements this differently from a conventional PCIe GPU server. The Micron 4600 used for our test is connected to the PCIe switch integrated into ConnectX-8. ConnectX-8 connects upstream to the Grace CPU, while the B300 GPU connects to Grace over NVLink-C2C. The SSD and GPU do not sit beneath the same PCIe switch. Storage traffic instead passes through the ConnectX-8 switch, enters the Grace PCIe root complex, traverses the Grace coherency fabric, and crosses NVLink-C2C to reach the B300’s HBM3e.

NVIDIA GPUDirect Storage diagram comparing the standard bounce buffer path through system memory with the direct DMA path from NVMe to GPU memory

With GPUDirect Storage, cuFile registers a buffer allocated in B300 HBM3e as the source or destination for storage I/O. On a read, the Micron 4600’s controller uses DMA to place data in HBM3e; on a write, it retrieves data from HBM3e. Both operations follow the Grace and NVLink-C2C path described above without staging the payload in Grace’s LPDDR5X memory. Grace still manages the filesystem and NVMe control plane, including command submission and address translation, but it does not copy the data. GPUDirect Storage therefore removes the system-memory staging step even though the traffic still passes through Grace on its way between the SSD and B300 memory. For AI workloads, sequential reads correspond to dataset streaming, model loading, and checkpoint restores, while sequential writes correspond to checkpoint saves and other transfers back to storage.

Looking at GDSIO Sequential Read performance, the unit scales consistently across both thread count and block size. At 16K, throughput rises from 16MiB/s at 1 thread to 250MiB/s at 16 threads, reaching 2.0GiB/s at 128 threads. Larger block sizes ramp up much faster, with 256K reaching 11.8GiB/s at 64 threads and peaking at 12.9GiB/s at 128 threads. The strongest results appear at 512K and 1M, where throughput tops out at 13.1GiB/s, with the 1M workload reaching that level at just 32 threads and maintaining it through 128 threads.GDSIO sequential read throughput into GPU memory on the MSI XpertStation WS300

Moving to GDSIO Sequential Write performance, the unit scales consistently across both thread count and block size. At 16K, throughput increases from 16MiB/s at 1 thread to 250MiB/s at 16 threads, reaching 2.0GiB/s at 128 threads. Larger block sizes ramp up much faster, with 256K reaching 7.5GiB/s at 32 threads and 12.0GiB/s at 64 threads. The strongest result comes from the 1M workload, which reaches the 12.0GiB/s ceiling at just 16 threads and maintains that performance through 128 threads. GDSIO sequential write throughput on the MSI XpertStation WS300

Who is the MSI XpertStation WS300 for?

The WS300 is for organizations that need direct access to Blackwell Ultra but do not want every experiment to begin with a cluster reservation or cloud request. AI labs, inference-engine developers, framework and compiler teams, robotics groups, and enterprise AI teams can use it as a local development node for the workflows above. MIG allows developers to test and develop for a multi-GPU setup, and the BMC makes the system manageable remotely.

It also makes sense for experienced AI developers who need a system that arrives ready to work. The value is not simply the B300. It is the complete platform around it: 252GB of HBM3e, Grace, and 496GB of LPDDR5X, ConnectX-8, mirrored boot storage, liquid cooling, remote management, and MSI-backed support in one tower. The practical limits are the Arm host, the requirement for a dedicated 20A circuit, and the shared 1,600W budget when a large RTX PRO card is installed.

Getting the most from the WS300 also depends on the software surrounding it. NVIDIA provides a broad collection of playbooks and deployment guides designed to help teams bring the system online and put its resources to work quickly. We will explore several of these tools in future coverage, including Brev, which can simplify shared access to the workstation and improve utilization so that such an expensive resource does not sit idle.

As for price, MSI has not published one, and machines in this class rarely carry a list price; this is a capital conversation with a sales team, not an add-to-cart button. The honest comparison is not against other workstations but against what an AI team is already paying for: reserved cluster time, cloud GPU commitments, and the schedule cost of waiting on shared hardware.

Conclusion

The MSI XpertStation WS300 is the most capable workstation we have ever reviewed, and the rare product that changes what a single practitioner can attempt. Frontier-scale checkpoints that normally live behind a cluster reservation, GLM-5.2 at 433GB, Nemotron-3-Ultra at 550 billion parameters, load and serve on a box beside the desk, privately and always available. That’s the source of our enthusiasm for this system.

MSI XpertStation WS300 on a desk with the side panel off, copper cold plates and liquid cooling visible

The DGX Station is aimed at developers: kernel developers targeting Blackwell Ultra, inference-engine and framework teams, robotics groups running the full Isaac loop, and generally users frustrated with scheduling experiments around shared hardware. Outside that niche, the argument for buying these systems is pretty limited. The Arm host will exclude some toolchains; the 20A circuit is an installation requirement on 120v circuits; there is no display output without an add-in card; and an RTX PRO 6000 workstation costs far less, covering single-user work on models that fit in its 96GB.

The economics also fence in the right deployment size. One WS300 is easy to justify against reserved cluster time, and a pair per team still is. Stacking further stops making sense at a certain point: by the time an organization is buying four GB300 towers, for instance, the same money is within reach of an eight-way B300 server with more memory per GPU, denser MIG partitioning, and NVLink between every GPU. The sweet spot is one on the desk, maybe two in the lab, complementing the datacenter investment.

NVIDIA provides the baseboard, so differentiation between OEMs comes down to implementation, and MSI’s execution here is solid. A 1,400W liquid loop cools the B300, Grace, SOCAMM, and ConnectX-8, and the platform stayed stable throughout testing. We’ll have a deeper look at GB300 thermals in an upcoming piece. The 1,600W power budget is distributed across components automatically, and when we tested the hardware power brake with a compromised connection, it throttled rather than shutting down. A pre-wired 12VHPWR lead and an anti-sag bracket support the RTX PRO expansion path. Having tested the first GB300 DGX Station to reach us, we can say the XpertStation WS300 sets a high bar for the platform.

The XpertStation WS300 now holds the Best GB300 System slot on our Best Desktops for Local AI leaderboard, and it anchors the memory discussion in our RAM, GPU, and Storage for Agentic AI guide.

MSI XpertStation WS300 (NVIDIA DGX Station)

The post MSI XpertStation WS300 Review: 748GB of Coherent Memory and 20 PetaFLOPS on a Desk appeared first on StorageReview.com.

Dell Pro Precision 5 16s AMD Review: Ryzen AI 9 HX PRO 475 and Radeon 890M in a 16-Inch Workstation

21 August 2026 at 17:30

The Dell Pro Precision 5 16s AMD brings the Ryzen AI 9 HX PRO 475 into Dell’s larger 16-inch mobile workstation chassis, pairing 12 cores and 24 threads with Radeon 890M graphics and a 60 TOPS NPU. Our review unit adds 64GB of LPDDR5x memory, a 1 TB PCIe Gen4 SSD, and a 2560 x 1600 120Hz IPS display. It is the fourth Pro Precision 5 configuration we have tested across the 14-inch and 16-inch models, giving us a direct look at how AMD’s platform changes when it has a larger chassis to work with.

Dell Pro Precision 5 16s AMD open on the test bench showing the 16-inch display and keyboard deck

Moving from the 14s AMD to the 16s changes quite a bit around the same Ryzen AI 9 HX PRO 475 and Radeon 890M platform. The larger model starts at 4.17 lb compared with 3.08 lb for the 14s, but it adds a 16-inch QHD+ 120Hz display, a full numeric keypad, and more internal room for cooling. That extra thermal headroom becomes useful for several sustained CPU workloads later in testing, while graphics performance generally stays close to 14s because both use the same Radeon 890M.

The Dell Pro Precision 5 16s AMD currently starts at $2,118.70 on Dell.com. Recreating our review hardware with the Ryzen AI 9 HX PRO 475, 64GB of memory, 1 TB Gen4 SSD, QHD+ 120Hz display, Mini-LED keyboard, 70Wh battery, 100W adapter, and fingerprint and smart-card security package comes to approximately $5,087 with the current listed hardware upgrades. Configuration changes can also affect support pricing, so treat this as an approximate single-unit web price rather than a fixed commercial purchase price.

Dell Pro Precision 5 16s AMD Specifications

Specification Dell Pro Precision 5 16s AMD (PW516265)
Processor AMD Ryzen AI 9 HX PRO 475 (12 cores/24 threads, up to 5.2GHz, 36MB cache, 60 TOPS NPU)
Graphics AMD Radeon 890M (integrated)
Memory 64GB LPDDR5x, 8533 MT/s rated, dual-channel, non-ECC
Storage 1TB SSD, PCIe Gen4 SanDisk PC_SN7100S
Display 16-inch QHD+/WQXGA (2560 x 1600), non-touch, 120Hz, 500 nits, IPS, 100% sRGB, anti-glare
Camera 8MP HDR RGB + IR with User Presence Detection
Wireless MediaTek Wi-Fi 7 MT7925, 2×2, Bluetooth 5.4
Keyboard English US Mini-LED backlit keyboard with numeric keypad and Copilot key
Security Fingerprint reader, smart card reader, ControlVault 3+, TPM 2.0, FIPS 140-3 certified
Battery 3-cell, 70Wh Long Lifecycle, ExpressCharge and ExpressCharge Boost
Power 100W USB-C adapter
Operating System Windows 11 Pro (Copilot+ PC)
Chassis Aluminum alloy, Graphite
Dimensions 14.12 x 9.98 in, 0.43 to 0.79 in thick; starting at 4.17 lb (1.89 kg)
Warranty 36 months ProSupport Next Business Day Onsite Service after Remote Diagnosis with hardware and software support
Price $2,118.70 starting / approximately $5,087 as configured

Build and Design

The Pro Precision 5 16s AMD uses the same general chassis design as the Intel 16s, with an aluminum-alloy exterior finished in Dell’s dark Graphite. At 14.12 x 9.98 inches and starting at 4.17 lb, it is noticeably larger than the 14s AMD but still relatively thin for a 16-inch business workstation. The wider chassis gives Dell room for a larger display, a full numeric keypad, a 70Wh battery, and a good selection of built-in ports, while security options include fingerprint authentication, a smart-card reader, TPM 2.0, and an 8MP IR camera.

Dell Pro Precision 5 16s AMD lid closed showing the Graphite aluminum top cover with Dell logo

The Graphite aluminum top cover keeps the exterior simple, with only the centered Dell logo on the matte finish. The lid is rigid enough that the large 16-inch panel does not look overly flexible when opening or carrying the notebook, while the rounded corners and tapered edges help keep the wider chassis from looking too bulky. So, at a glance, very little separates the AMD model from the Intel 16s, aside from the AMD badge on the keyboard deck once you open it up.

Dell Pro Precision 5 16s AMD straight on with the 16-inch QHD+ display powered on

The 16-inch 2560 x 1600 IPS display made day-to-day use much nicer. The 16:10 aspect ratio provides much more room to work with than the 14s, especially for spreadsheets, development tools, or anything with a busy interface, and I found the 500-nit brightness more than adequate indoors. The 120Hz refresh rate also makes scrolling and general navigation feel noticeably smoother, while the anti-glare finish kept reflections to a minimum in our lab.

Dell Pro Precision 5 16s AMD top bezel close-up with the 8MP HDR camera and IR module

The 8MP HDR RGB and IR camera is centered in the upper bezel and includes a physical privacy shutter, Windows Hello support, and User Presence Detection. The privacy shutter is a small mechanical cover that physically blocks the camera lens when closed, so it doesn’t rely on software to disable the webcam. That is especially useful in business environments, while traveling, or in private settings because it lets you immediately see whether the camera is blocked. The IR hardware supports facial authentication through Windows Hello, while User Presence Detection can work with supported Windows features to lock the notebook when you walk away and wake it when you return.

Dell Pro Precision 5 16s AMD keyboard deck from above showing the backlit keyboard with numeric keypad and glass touchpad

The wider keyboard deck gives Dell enough room for a full numeric keypad, which is one of the more noticeable design differences from the 14s AMD. The smaller 14s also uses a Mini-LED backlit keyboard, but its narrower chassis leaves out the dedicated number pad and uses that space for a more compact layout. For anyone spending a lot of time in spreadsheets, financial applications, or engineering software, the 16s’ separate numeric keypad is a welcome addition. Our unit also includes a dedicated Copilot key, while the power button and fingerprint reader are positioned in the upper-right corner above the number pad.

Dell Pro Precision 5 16s AMD palm rest and touchpad corner detail

The large touchpad sits beneath the main typing area, keeping it better aligned with the user’s hands while typing. At 130 x 90 mm, it offers plenty of surface area for navigation and gestures, while the wider 16-inch chassis still leaves generous palm-rest space around it despite the full numeric keypad.

Dell Pro Precision 5 16s AMD right side ports with the display partially open

The right side keeps several legacy connections available, including a 3.5mm headset jack, a USB-A port with PowerShare, a 1 GbE RJ45 Ethernet port, and a wedge-shaped lock slot. Having Ethernet and USB-A built directly into the notebook is particularly useful in offices, labs, and managed environments where wired networking and older peripherals are still often used.

Dell Pro Precision 5 16s AMD left side ports with the display partially open

Most external display and docking connections are grouped on the left, including HDMI 2.1, another USB-A port, two Thunderbolt 4 USB-C ports, a battery-status light, and, in our configuration, the smart-card slot. The Thunderbolt 4 ports support DisplayPort and Power Delivery, which gives them enough flexibility for docking stations, external displays, fast storage, or charging.

The wide rear hinge spans much of the chassis and leaves the exhaust area open beneath the display, giving hot air a direct path away from the keyboard deck. Inside, the AMD 16s uses a single large fan and heatpipe assembly similar in layout to the Intel version, but the larger chassis gives the cooling system more room than Dell has available in the 14s. In the performance section below, several longer CPU tests show that the HX PRO 475 benefits from that extra space, even though the processor is unchanged.

Dell Pro Precision 5 16s AMD bottom cover exterior showing the ventilation intake and rubber feet

The underside features a wide perforated intake grille positioned beneath the fan and motherboard. Long rubber feet create clearance between the chassis and the desk. Dell secures the bottom cover with seven captive screws, keeping them attached to the panel during removal. Once loosened, you can release the cover from pry points along the upper edge and work it free around the perimeter.

Dell Pro Precision 5 16s AMD internals with the bottom cover removed: fan, heatpipe, battery, and speaker layout

Removing the bottom cover gives you easy access to most of the parts you would realistically want to service, including the 70Wh battery, M.2 SSD, WLAN card, cooling fan, and speakers. The battery occupies most of the lower half of the chassis, while the SSD sits to the right and the wireless card sits closer to the center. One notable difference from the Intel 16s is the memory, since the AMD model does not use a replaceable LPCAMM2 module. That means you’ll need to choose the 64 GB capacity at the time of purchase.

Dell Pro Precision 5 16s AMD Performance

Our review unit runs the Ryzen AI 9 HX PRO 475 with Radeon 890M integrated graphics, 64GB of LPDDR5x, and a 1TB SSD on Windows 11 Pro, with benchmarks tested in the Best Performance power mode. For battery life testing, we configure systems into Balanced power mode and set the screen brightness to 50%.

For comparables, we included the other three systems in this family: the Dell Pro Precision 5 16s Intel, the Dell Pro Precision 5 14s AMD, and the Dell Pro Precision 5 14s Intel, giving a clean read on both the Intel-versus-AMD question and the 14-versus-16 question at matched configurations.

A note on GPU labeling: the AMD systems in this group run Radeon 890M integrated graphics, while the Intel systems run Arc Pro B390; charts call out the GPU where a result is graphics-bound.

PCMark 10

PCMark 10 measures general system performance across everyday work such as web browsing, video conferencing, spreadsheets, writing, photo editing, and rendering. The overall score includes Essentials, Productivity, and Digital Content Creation subscores that provide additional context for performance across those workload groups. Higher scores are better.

PCMark 10 Dell Pro Precision 5 16s AMD Dell Pro Precision 5 16s Intel Dell Pro Precision 5 14s AMD Dell Pro Precision 5 14s Intel
Overall Score 8,627 9,994 8,762 10,019
Essentials 10,744 12,106 11,442 12,188
Productivity 14,574 15,505 14,272 15,827
Digital Content Creation 11,127 14,433 11,178 14,147


The Pro Precision 5 16s AMD finished PCMark 10 at 8,627 overall, putting it very close to the 14s AMD but about 16% behind the 16s Intel. Productivity was its best relative showing at 14,574, slightly ahead of the 14s AMD’s 14,272, while Digital Content Creation came in at 11,127 and was essentially unchanged from the smaller AMD model. General productivity performance therefore changes very little with the larger AMD chassis, while the Intel configurations keep a sizeable advantage in this test.

PCMark 10 Modern Office Battery

The PCMark 10 Modern Office battery test repeatedly runs common office tasks until the battery reaches the test’s cutoff point, in Balanced mode at 50 percent display brightness. This is a rundown of the whole system rather than a synthetic idle drain, so it tracks closely with what a full day of productivity work does to the battery. Longer runtimes are better.

Modern Office Battery Dell Pro Precision 5 16s AMD Dell Pro Precision 5 16s Intel Dell Pro Precision 5 14s AMD Dell Pro Precision 5 14s Intel
Runtime (higher is better) 15 hours 5 minutes 24 hours 43 minutes 14 hours 26 minutes 23 hours 50 minutes


Battery life reached 15 hours and 5 minutes, giving the 16s AMD another 39 minutes over the 14s AMD despite its larger QHD+ display. That is a good result for a 16-inch workstation, but the platform gap is substantial: the 16s Intel lasts 24 hours and 43 minutes on the same 70Wh capacity. Those who spend long periods away from an outlet will get a major advantage from the Intel version, while the AMD 16s still gets through a long working day.

Geekbench 6

Geekbench 6 measures processor performance using a mix of common tasks, with separate scores for single-core and multi-core workloads, plus GPU compute scores through OpenCL and Vulkan. Higher scores are better.

Geekbench 6 Dell Pro Precision 5 16s AMD (Radeon 890M) Dell Pro Precision 5 16s Intel (Arc Pro B390) Dell Pro Precision 5 14s AMD (Radeon 890M) Dell Pro Precision 5 14s Intel (Arc Pro B390)
CPU Single-Core 2,854 2,969 2,831 3,010
CPU Multi-Core 14,169 17,401 14,611 17,396
GPU OpenCL 37,520 57,998 36,322 56,745
GPU Vulkan 53,969 63,015 49,868 55,581


Geekbench 6 shows the 16s AMD performing close to its 14-inch counterpart, with a small gain in single-core performance and somewhat better GPU compute results, but multicore dropped to 14,169 from 14,611. The Intel 16s was 23% faster in multicore and 55% faster in OpenCL, while the AMD model narrowed the gap in Vulkan to 53,969 compared with 63,015. In this test, the larger chassis did little to improve overall performance compared with the 14s AMD.

Geekbench 7

Geekbench 7 joins the suite alongside Geekbench 6 as comparison data builds. Its CPU scores are calibrated against a baseline of 2,500, set by the AMD Ryzen 7700, while GPU scores are calibrated against a baseline of 100,000, set by the NVIDIA GeForce RTX 4060. Higher scores are better, and double the score indicates double the performance. Because Geekbench 7 uses new workloads and new baselines, its scores are not comparable to Geekbench 6 results.

Geekbench 7 Dell Pro Precision 5 16s AMD (Radeon 890M) Dell Pro Precision 5 16s Intel (Arc Pro B390) Dell Pro Precision 5 14s AMD (Radeon 890M) Dell Pro Precision 5 14s Intel (Arc Pro B390)
CPU Single-Core 2,659 2,733 2,571 2,702
CPU Multi-Core 16,641 18,965 15,514 18,788
GPU OpenCL 31,874 54,247 31,423 54,854
GPU Vulkan * 47,436 * 46,906


*Both Precision AMD units failed workload validation in the Geekbench 7 Vulkan run, which assigns a score of zero to the affected subtest. We traced it to the fluid simulation workload and have discarded both results pending clean runs.

Geekbench 7 gives the larger AMD model a better showing, with its 16,641 multicore score improving by 7% over the 14s AMD and single-core rising to 2,659. Intel still leads at 18,965 multicore, while the Arc Pro B390 widens the GPU gap considerably with 54,247 in OpenCL compared with 31,874 from the Radeon 890M. The AMD systems did not return a valid Vulkan result in this test, so that comparison is limited to OpenCL.

Cinebench 2026

Cinebench 2026 is the current release in the Cinebench line and the only version we report. It tests CPU and GPU performance using Maxon’s Redshift render engine. It is built on the latest Cinema 4D 2026 code and is designed to show whether a machine is stable under high CPU load, whether a notebook’s cooling can sustain longer render tasks, and how it handles demanding real-world 3D work. Because code and compiler changes accelerated scene rendering, Cinebench 2026 scores use an adjusted range and should not be compared to scores from previous Cinebench versions. Its GPU test supports current AMD and NVIDIA hardware but does not yet run on Intel integrated graphics.

Cinebench 2026 Dell Pro Precision 5 16s AMD Dell Pro Precision 5 16s Intel Dell Pro Precision 5 14s AMD Dell Pro Precision 5 14s Intel
CPU Single Thread 471 535 466 513
CPU Multiple Threads 4,767 4,618 4,230 4,513
GPU 5,667 N/A 5,313 N/A


Cinebench 2026 is one of the better examples of what the larger AMD chassis can do with the 24-thread Ryzen AI 9 HX PRO 475. Its multicore score of 4,767 leads the entire group, beating the 16s Intel by 3% and the 14s AMD by nearly 13%, while its Radeon 890M GPU score also improves by about 7% over the smaller AMD model. Intel retains the single-thread lead at 535 versus 471, so AMD’s advantage here is tied specifically to heavier workloads.

7-Zip Compression

The built-in 7-Zip benchmark measures how quickly the processor can compress and decompress data using multiple threads, run with a 128MB dictionary across ten passes. Decompression tends to scale with thread count, while compression leans on memory latency, so the two halves often tell different stories. Higher GIPS scores are better.

7-Zip 24.09 (GIPS) Dell Pro Precision 5 16s AMD Dell Pro Precision 5 16s Intel Dell Pro Precision 5 14s AMD Dell Pro Precision 5 14s Intel
Compressing 85.627 96.281 89.099 92.836
Decompressing 117.863 97.246 117.545 93.089
Total Rating 101.745 96.764 103.322 92.963


The Ryzen AI 9 HX PRO 475 shows its thread-count advantage most strongly during decompression, where the 16s AMD reaches 117.863 GIPS and finishes more than 20% ahead of the Intel 16s. Compression is weaker at 85.627 GIPS, pulling the total rating down to 101.745 and leaving the 14s AMD narrowly ahead overall at 103.322. Even so, the AMD 16s finishes about 5% ahead of its Intel counterpart in the combined score.

y-cruncher

y-cruncher measures how quickly the processor can calculate large numbers of digits of Pi, placing a heavy load on the CPU and memory subsystem. At the same time, the BBP runs to extract hexadecimal digits of Pi. Results are in seconds, so lower times are better. Neither Pro Precision AMD unit could complete the 5-billion- or 10-billion-digit runs because the memory these platforms reserve for the integrated GPU leaves less available than those problem sizes require; the previous-generation Pro 5 16 AMD completed 5 billion but not 10 billion.

y-cruncher (seconds, lower is better) Dell Pro Precision 5 16s AMD Dell Pro Precision 5 16s Intel Dell Pro Precision 5 14s AMD Dell Pro Precision 5 14s Intel
Pi 1B 22.840 26.422 24.648 28.404
Pi 2.5B 64.242 80.463 71.084 83.968
Pi 5B N/A 183.822 N/A 190.356
Pi 10B N/A 407.658 N/A 417.224
Pi BBP 1B 1.100 1.635 1.104 1.684
Pi BBP 10B 12.277 19.036 14.333 20.028
Pi BBP 100B 140.284 234.797 166.762 241.409


The Pro Precision 5 16s AMD was the fastest system across all y-cruncher workloads it could complete, including 22.840 seconds at Pi 1B and 64.242 seconds at Pi 2.5B. The larger chassis also improves quite a bit compared to the 14s AMD, cutting the Pi 2.5B time by roughly 10% and the BBP 100B time from 166.762 to 140.284 seconds. The missing 5B and 10B results are caused by the memory reserved for the Radeon 890M, which leaves too little system memory available for those problem sizes (rather than the processor failing the workload itself).

Blender

The Blender benchmark measures rendering performance using three different 3D scenes: Monster, Junkshop, and Classroom. Results are reported in samples per minute, so higher scores are better. We test on both the CPU and GPU. Scores are not comparable across Blender versions, so we report the scores for the current 5.2 release here.

Blender 5.2 (samples/min) Dell Pro Precision 5 16s AMD (Radeon 890M) Dell Pro Precision 5 16s Intel (Arc Pro B390) Dell Pro Precision 5 14s AMD (Radeon 890M) Dell Pro Precision 5 14s Intel (Arc Pro B390)
GPU
Monster 123.00 572.84 124.50 567.52
Junkshop 101.21 468.85 101.06 463.30
Classroom 82.84 420.48 82.95 417.38
CPU
Monster 130.86 138.88 127.02 133.46
Junkshop 99.74 94.97 95.84 94.27
Classroom 74.18 65.39 71.63 64.26


Blender separates the CPU and GPU sides of the AMD configuration very quickly, with the Radeon 890M producing results almost identical to the 14s AMD, while the Arc Pro B390 was, as expected, several times faster. CPU rendering favors the 16s AMD, which leads Junkshop at 99.74 samples per minute and Classroom at 74.18, while also improving over the 14s AMD in all three scenes.

LuxMark

LuxMark measures GPU compute performance by rendering complex scenes through OpenCL, based on LuxCoreRender. We run the Food and Hall scenes on all available OpenCL devices in each system, so the GPU listed in each column header did the rendering. Higher scores are better.

LuxMark v4 Dell Pro Precision 5 16s AMD (Radeon 890M) Dell Pro Precision 5 16s Intel (Arc Pro B390) Dell Pro Precision 5 14s AMD (Radeon 890M) Dell Pro Precision 5 14s Intel (Arc Pro B390)
Hall 2,058 3,505 2,077 3,494
Food 1,034 1,713 1,041 1,705


LuxMark shows almost no real difference between the two AMD chassis sizes, with the 16s scoring 2,058 in Hall and 1,034 in Food compared with 2,077 and 1,041 from the 14s. Intel’s Arc Pro B390 is much stronger in this OpenCL workload, reaching 3,505 in Hall and 1,713 in Food. The nearly identical AMD results also show that the larger chassis offers little benefit to Radeon 890M performance in this OpenCL workload.

V-Ray

Chaos V-Ray measures ray-traced rendering throughput, reported in vpaths, where higher is better. We run the CUDA-compatible engine on every system so results remain comparable to notebooks with discrete graphics; on systems without a discrete GPU, that path executes on the integrated graphics, even though V-Ray reports the processor name in its device field.

V-Ray GPU (vpaths) Dell Pro Precision 5 16s AMD (Radeon 890M) Dell Pro Precision 5 16s Intel (Arc Pro B390) Dell Pro Precision 5 14s AMD (Radeon 890M) Dell Pro Precision 5 14s Intel (Arc Pro B390)
CUDA Engine 1,039 946 897 890


The Radeon 890M in the 16s AMD produced the highest V-Ray result in the group at 1,039 vpaths, putting it about 10% ahead of the 16s Intel and 16% ahead of the 14s AMD. This was one of the few GPU-focused tests in which the AMD configuration finished ahead of the Arc Pro B390, despite Intel holding much larger advantages in several other graphics benchmarks.

3DMark CPU Profile

The 3DMark CPU Profile benchmark measures CPU performance at fixed thread counts, from a single thread up to the maximum available, showing how performance scales as more cores are engaged. Higher scores are better.

3DMark CPU Profile Dell Pro Precision 5 16s AMD Dell Pro Precision 5 16s Intel Dell Pro Precision 5 14s AMD Dell Pro Precision 5 14s Intel
Max Threads 9,267 10,748 8,778 10,277
8 Threads 6,573 6,818 6,270 6,441
4 Threads 4,238 4,483 4,047 4,176
1 Thread 1,178 1,210 1,160 1,174


The larger chassis gives the 16s AMD a modest improvement over the 14s AMD across all thread counts, including a 9,267 max-thread score that is about 6% higher than the smaller model. Intel still leads the table at 10,748 with all threads active and also stays ahead at eight, four, and one thread. So, while the AMD 16s does benefit from the additional thermal room, it isn’t enough to overtake the X9 388H in this particular CPU test.

3DMark Storage and Blackmagic Disk Speed Test

3DMark Storage measures how an SSD performs during gaming-related tasks such as loading games, installing software, saving progress, and moving game files. Blackmagic Disk Speed Test measures an SSD’s sequential read and write speeds using large media files. Higher is better in both.

Storage Dell Pro Precision 5 16s AMD Dell Pro Precision 5 16s Intel Dell Pro Precision 5 14s AMD Dell Pro Precision 5 14s Intel
3DMark Storage 2,325 2,804 2,424 3,093
Blackmagic Write (MB/s) 5,070.5 7,660.2 4,772.0 9,000.8
Blackmagic Read (MB/s) 5,071.2 8,418.1 4,900.4 9,809.2


Storage performance reflects the Gen4 SSD used in our AMD review unit, with Blackmagic reporting almost identical read and write speeds of roughly 5.07 GB/s. That is slightly faster sequentially than the SSD in the 14s AMD, although its 3DMark Storage score of 2,325 was a little lower. Both Intel systems use much faster storage configurations, with the 16s Intel reaching 8.4 GB/s reads and the 14s Intel approaching 9.8 GB/s.

Blackmagic RAW Speed Test

The Blackmagic RAW Speed Test measures how many frames per second a system can decode Blackmagic RAW video on the CPU and on the GPU. We quote the 8K results at 12:1 compression, and higher is better.

Blackmagic RAW Speed Test Dell Pro Precision 5 16s AMD (Radeon 890M) Dell Pro Precision 5 16s Intel (Arc Pro B390) Dell Pro Precision 5 14s AMD (Radeon 890M) Dell Pro Precision 5 14s Intel (Arc Pro B390)
8K 12:1 CPU (fps) 74 77 77 79
8K 12:1 GPU (fps) 49 87 49 85


Blackmagic RAW shows almost no chassis-size difference between the two AMD systems, with both Radeon 890M configurations reaching 49 fps in the GPU decode test. The 16s AMD recorded 74 fps on the CPU path, a few frames behind the other three systems, while the Arc Pro B390 in the Intel 16s reached 87 fps on the GPU. Video workflows that use GPU-accelerated BRAW decoding therefore favor Intel quite heavily within the Pro Precision 5 family.

Topaz Video AI

The Topaz Video AI benchmark measures AI video upscaling and frame-interpolation performance in frames per second across the application’s enhancement models, run here at 1080p input, where higher is better. The previous-generation Pro 5 16 AMD was not tested with Topaz.

Topaz Video AI (fps) Dell Pro Precision 5 16s AMD (Radeon 890M) Dell Pro Precision 5 16s Intel (Arc Pro B390) Dell Pro Precision 5 14s AMD (Radeon 890M) Dell Pro Precision 5 14s Intel (Arc Pro B390)
Artemis 1X / 2X / 4X 3.72 / 2.21 / 0.78 6.24 / 5.21 / 1.90 3.75 / 2.24 / 0.79 6.22 / 5.28 / 1.89
Iris 1X / 2X / 4X 4.91 / 2.72 / 0.92 5.29 / 3.19 / 0.96 4.86 / 2.70 / 0.86 5.18 / 3.14 / 0.94
Proteus 1X / 2X / 4X 3.99 / 2.70 / 1.18 6.45 / 6.09 / 2.47 3.93 / 2.69 / 1.19 6.43 / 6.08 / 2.46
Gaia 1X / 2X / 4X 1.87 / 1.34 / 0.96 3.30 / 2.26 / 1.51 1.90 / 1.35 / 0.94 3.24 / 2.25 / 1.50
Nyx 1X / 2X 1.87 / 1.53 1.56 / 1.57 1.86 / 1.56 1.57 / 1.54
Hyperion HDR 1X 11.48 3.23 11.34 3.22
4X Slowmo Apollo / APFast 6.08 / 17.59 8.48 / 22.00 6.05 / 17.72 8.57 / 22.13
16X Slowmo Aion 9.05 DNF 9.13 DNF


Topaz Video AI gives the Radeon 890M a much more mixed result than the broader graphics benchmarks, with Intel leading Artemis, Iris, Proteus, Gaia, and both Apollo tests, while the AMD systems perform far better in Hyperion HDR. The 16s AMD reached 11.48 fps in Hyperion compared with only 3.23 fps from the Intel 16s, and it also completed the 16X Aion workload at 9.05 fps while both Intel systems failed to finish it. Across most other rows, its results are nearly identical to the smaller 14s AMD.

UL Procyon AI Text Generation

The Procyon AI Text Generation Benchmark measures local LLM performance across four models: Phi, Mistral, Llama3, and Llama2. All four systems ran the models through ONNX Runtime with DirectML on their respective GPUs, providing a common test path for comparing inference performance across Intel and AMD graphics hardware. Higher scores are better.

Procyon AI Text Generation Dell Pro Precision 5 16s AMD (Radeon 890M) Dell Pro Precision 5 16s Intel (Arc Pro B390) Dell Pro Precision 5 14s AMD (Radeon 890M) Dell Pro Precision 5 14s Intel (Arc Pro B390)
Phi 434 893 424 887
Mistral 403 646 396 646
Llama3 357 669 352 674
Llama2 390 750 379 786


Local LLM performance heavily favors Intel’s Arc Pro B390, although the 16s AMD does improve slightly over the 14s AMD across all four models. The Radeon 890M scores 434 on Phi, 403 on Mistral, 357 on Llama3, and 390 on Llama2, while the Intel 16s ranges from roughly 60% to more than twice as fast, depending on the model. For users who plan to run GPU-based local language models regularly, the Intel configuration offers a significant advantage.

UL Procyon AI Computer Vision

The Procyon AI Computer Vision Benchmark measures AI inference performance across CPUs, GPUs, and dedicated accelerators using a range of neural networks, evaluating tasks such as image classification, object detection, segmentation, and super-resolution with models including MobileNet V3, Inception V4, YOLO V3, DeepLab V3, Real ESRGAN, and ResNet 50. The WinML runs use float32 on CPU and GPU, giving a like-for-like view across vendors. We also run the newer Computer Vision 2 suite through each vendor’s native path, Ryzen AI in int8 on the AMD NPUs and OpenVINO on the Intel NPU and iGPU; those results are listed separately since precision and runtime differ by platform. Higher scores are better.

Procyon AI Computer Vision (WinML) Dell Pro Precision 5 16s AMD Dell Pro Precision 5 16s Intel Dell Pro Precision 5 14s AMD Dell Pro Precision 5 14s Intel
CPU 114 143 106 141
GPU 245 410 247 404


Procyon AI Computer Vision 2 (native runtimes) Dell Pro Precision 5 16s AMD Dell Pro Precision 5 16s Intel Dell Pro Precision 5 14s AMD Dell Pro Precision 5 14s Intel
NPU 1,189 1,630 1,176 1,647
iGPU N/A 1,529 N/A 1,517


Procyon Computer Vision again favors Intel on the common WinML path, with the 16s AMD scoring 114 on CPU and 245 on GPU, compared with 143 and 410 from the Intel model. The AMD configuration does improve its CPU score over the 14s AMD, while GPU performance is effectively identical between the two Radeon systems. Through the newer native-runtime test, the 60 TOPS Ryzen AI NPU reaches 1,189, almost unchanged from the 14s AMD’s 1,176 but below the Intel 16s result of 1,630.

UL Procyon AI Image Generation

The Procyon AI Image Generation Benchmark measures local image-generation performance across Stable Diffusion XL FP16, Stable Diffusion 1.5 FP16, and Stable Diffusion 1.5 INT8 workloads. The AMD systems use the optimized DirectML path for Radeon graphics, while the Intel systems use OpenVINO. The INT8 NPU test requires a supported quantized model, which was not available for the current AMD configurations.

Procyon AI Image Generation Dell Pro Precision 5 16s AMD (Radeon 890M) Dell Pro Precision 5 16s Intel (Arc Pro B390) Dell Pro Precision 5 14s AMD (Radeon 890M) Dell Pro Precision 5 14s Intel (Arc Pro B390)
SD 1.5 FP16 316 638 281 632
SDXL FP16 200 738 197 731
SD 1.5 INT8 (iGPU) 2,855 7,778 N/A 7,873
SD 1.5 INT8 (NPU) N/A 2,881 N/A 3,003


Image generation shows the same architectural split, with the AMD 16s improving over its 14-inch counterpart but still trailing the Arc Pro B390 by a wide margin. The Radeon 890M scores 316 in Stable Diffusion 1.5 FP16 and 200 in SDXL, compared with 638 and 738 from the Intel 16s, while the INT8 iGPU workload widens the difference to 2,855 versus 7,778.

SPECviewperf 15

SPECviewperf 15 measures graphics performance using viewsets derived from professional applications in CAD, 3D modeling, rendering, engineering, and medical visualization, replayed here at 1080p. Higher scores are better, although performance can vary considerably between applications and graphics architectures. The enscape-01 viewset failed to complete on the review unit across multiple runs, and catia-07 failed on the Intel twin.

SPECviewperf 15 (FHD) Dell Pro Precision 5 16s AMD (Radeon 890M) Dell Pro Precision 5 16s Intel (Arc Pro B390) Dell Pro Precision 5 14s AMD (Radeon 890M) Dell Pro Precision 5 14s Intel (Arc Pro B390)
3dsmax-08 26.23 21.46 26.30 19.51
blender-01 23.17 23.15 23.01 21.55
catia-07 22.70 26.35 22.70 DNF
creo-04 49.42 68.14 49.27 63.57
energy-04 29.69 38.86 29.51 38.07
enscape-01 8.45 15.24 DNF 14.92
maya-07 53.48 85.61 53.30 83.86
medical-04 73.31 70.91 73.42 69.41
snx-05 61.33 80.24 59.58 78.74
solidworks-08 36.40 32.99 36.66 33.38
unreal_engine-01 27.38 42.15 27.31 41.38


Professional graphics performance is more workload-dependent than the general GPU tests, with the 16s AMD beating the Intel model in 3dsmax, narrowly matching it in blender, and leading in medical and solidworks. Intel has much larger advantages in creo, energy, enscape, maya, solidworks, and unreal engine, however, including 85.61 versus 53.48 in Maya. The 16s AMD also completed enscape at 8.45, where the 14s AMD failed, whereas most of its other results track very closely with the smaller Radeon system.

SPECworkstation 4

SPECworkstation 4 measures workstation performance across CPU, graphics, storage, AI, product design, engineering, financial services, and other professional workloads, using real applications grouped into seven industry verticals. Higher scores are better, and N/A means the system did not complete every workload required for that category.

SPECworkstation 4 Dell Pro Precision 5 16s AMD Dell Pro Precision 5 16s Intel Dell Pro Precision 5 14s AMD Dell Pro Precision 5 14s Intel
Hardware Subsystems
CPU N/A 1.34 1.15 N/A
Graphics 2.65 2.67 2.57 2.70
Accelerator 2.31 2.25 2.22 2.29
Storage 1.00 1.80 0.93 1.70
Industry Verticals
AI & Machine Learning 1.45 1.47 1.38 1.45
Energy 1.38 1.55 1.28 1.67
Financial Services 1.29 0.94 1.07 0.93
Life Sciences 1.47 1.84 1.41 N/A
Media & Entertainment 1.48 1.60 1.39 1.53
Product Design 1.41 1.75 1.34 1.80
Productivity & Development N/A 1.35 1.03 1.32


SPECworkstation gives the 16s AMD a few useful wins, including the highest Accelerator score at 2.31 and the strongest Financial Services result at 1.29. Graphics is effectively tied with the Intel 16s at 2.65 versus 2.67, while Intel has much stronger results in Storage, Energy, Life Sciences, Media and Entertainment, and Product Design. The AMD 16s improves on the 14s AMD in nearly every completed category, although its CPU and Productivity and Development scores are N/A because one or more required workloads did not complete.

Conclusion

The Dell Pro Precision 5 16s AMD was strongest in heavily threaded CPU workloads, often outperforming the 14s AMD despite using the same Ryzen AI 9 HX PRO 475. Cinebench 2026 multicore reached 4,767, the highest score in the group, while y-cruncher produced the fastest completed results across the table, and 7-Zip decompression reached 117.863 GIPS. The gains over the 14s AMD are not universal, but sustained CPU workloads are where the move to 16 inches pays off most. Battery life also increases slightly to 15 hours and 5 minutes, while the larger QHD+ 120Hz display and full numeric keypad provide considerably more workspace.

Dell Pro Precision 5 16s AMD from the rear three-quarter angle showing the hinge and exhaust

Choosing the AMD version over the 16s Intel depends heavily on the applications being used. The Intel model is faster in general productivity, Geekbench, GPU compute, Blender GPU rendering, most local AI workloads, BRAW decoding, and storage, while its 24-hour and 43-minute battery result is more than nine and a half hours longer. AMD counters with stronger results in several heavily threaded CPU workloads, a win in V-Ray, excellent y-cruncher performance where memory capacity allows the test to run, and a few application-specific graphics wins in SPECviewperf and Topaz. Users whose work revolves around CPU rendering, numerical workloads, compression, or other highly threaded software have good reasons to choose the HX PRO 475, while graphics-heavy and local AI work generally favors the Intel configuration.

The choice between the 16s AMD and 14s AMD is much simpler because their CPU and GPU hardware is essentially the same. The 16s gives up roughly 1.1 lb of portability in exchange for the larger 16-inch display, numeric keypad, slightly longer battery life, and better sustained CPU performance in several tests, while Radeon 890M performance changes very little between the two sizes. Engineers, analysts, developers, and other users who spend most of the day working in the notebook will probably appreciate the extra display and keyboard space, while anyone who carries the system frequently can get very similar overall performance from the lighter 14s AMD.

The Pro Precision 5 16s AMD now sits at #15 on our Laptop Battery Life Leaderboard with its 15 hour 5 minute result, and appears in our Best Mobile Workstations and Best Laptops for Local AI coverage.

Dell Pro Precision 5 Series 16S Laptop (AMD)

The post Dell Pro Precision 5 16s AMD Review: Ryzen AI 9 HX PRO 475 and Radeon 890M in a 16-Inch Workstation appeared first on StorageReview.com.

HP EliteBook X G2i Review: 17 Hours of OLED Battery in a 2.4-Pound Business Flagship

18 August 2026 at 11:16
HP EliteBook X G2i open on the lab bench with the 14-inch display on HP EliteBook X G2i open on the lab bench with the 14-inch display on

The HP EliteBook X G2i is HP’s premium 14-inch business notebook, and the company is not shy about the AI branding: the formal model name is the EliteBook X G2i 14-inch Notebook Next Gen AI PC. Our review unit runs Intel’s Core Ultra 7 366H, a Series 3 Panther Lake part with 16 cores and vPro, with 32GB of LPDDR5x at 8533 MT/s, a 1 TB SK hynix Gen5 SSD, and a 14-inch 2880 x 1800 display. It is a Copilot+ PC aimed squarely at the corporate fleet, and in our testing, it posted the strongest PCMark 10 Productivity score we have recorded from this class of machine.

HP EliteBook X G2i in Atmospheric Blue, closed, three-quarter rear view showing the HP logo on the lid

HP positions this generation around choice in two places most business laptops treat as fixed. There are two display options, and the shell comes in three finishes: Eclipse Gray, Glacier Silver, and the Atmospheric Blue on our review unit, a splash of personality that is unusual in a segment that defaults to silver and shades of black. Our review unit had two display options: a 1920×1200 OLED with 300 nits of brightness and a 3 K 120 Hz OLED with 500 nits of brightness. Higher resolution and brightness do have the trade-off of increased battery drain, which is quite evident in our battery testing.

Two configuration notes matter. First, HP sent us both members of the family: this EliteBook X G2i and its convertible twin, the EliteBook X Flip G2i. The full benchmark suite reflects the clamshell; we ran battery testing only on the Flip because the two differ meaningfully in display, and we wanted to isolate the panel’s impact on runtime. The Flip earns a brief word in Build and Design but is otherwise not the subject of this review.

Second, and worth being direct about: our unit is not where this platform tops out. HP builds the EliteBook X G2i in two graphics tiers, the 4 Xe-core integrated graphics in our Core Ultra 7 366H unit, which HP positions as the mainstream configuration for everyday productivity, and a 12 Xe-core Arc B390 tier on the Core Ultra X7 358H, paired with a 3K OLED panel, that HP describes as delivering near-discrete GPU performance for analytics, content creation, and local AI work. HP’s own workshop figures claim 3.2 times faster AI image generation and 2.3 times faster hardware-accelerated workflows for the 12 Xe tier, and our comparison data supports the scale of that claim: the same Arc B390 silicon in the Dell Pro 5 14 Intel runs 2.2 to 2.3 times ahead of our review unit in Geekbench GPU compute, Blender, and Stable Diffusion. Every GPU result in this review should be read with that ceiling in mind; we tested the volume build, not the fastest one.

HP does not have a full configurator live for the EliteBook X G2i, so pricing is a snapshot of current stock rather than a build-to-order quote. Our exact build, the Core Ultra 7 366H with the non-touch 3K OLED, was not orderable at this writing. The closest in-stock clamshell is the Arc B390 tier we reference throughout this review: the Core Ultra X7 358H with the same 32GB, 1TB, and 3K OLED fit-out, listed at $6,270 but selling for $3,399 during HP’s current sale. The Flip variant of our 366H configuration sells for $2,999. HP list prices carry heavy standing discounts, so the street figures are the realistic reference points.

HP EliteBook X G2i Specifications

Specification HP EliteBook X G2i
Model HP EliteBook X G2i 14-inch Notebook Next Gen AI PC 
Processor Intel Core Ultra 7 366H vPro (Series 3), 16 cores / 16 threads, up to 4.8GHz, 50 TOPS Intel AI Boost NPU
Graphics Integrated Intel Graphics, 4 Xe cores (HP offers a 12 Xe Arc B390 tier on the X7 358H config)
Memory 32GB LPDDR5x, 8533 MT/s, soldered
Storage 1TB SK hynix PCB01 (HFS001TFM9X187N), PCIe Gen5 NVMe
Display 14-inch 3K (2880 x 1800) OLED, 120Hz, anti-glare, 500 nits, 100% DCI-P3
Operating System Windows 11 Pro, Copilot+ PC
Battery 68 Watt-hour battery
Ports 1 HDMI 2.1
1 stereo headphone/microphone combo jack
1 nano security lock slot
1 USB Type-A 5Gbps signaling rate (powered)
2 Thunderbolt 4 with USB Type-C 40Gbps signaling rate (USB Power Delivery 3.0, DisplayPort 2.1)
1 USB Type-C 10Gbps signaling rate (USB Power Delivery 3.0, DisplayPort 1.4)
Wireless Intel Wi-Fi 7 BE211 2×2, Bluetooth 6
Weight Starting at 0.99kg (2.18 lb) Tested Clamshell 2.4lb/1.088kg, 2-in-1 3.18lb/1.37kg
Colors Eclipse Gray, Glacier Silver, Atmospheric Blue (as tested)
Price Exact configuration not currently orderable; closest in-stock build (Core Ultra X7 358H / Arc B390, 32GB, 1TB, 3K OLED) $3,399 at this writing

Build and Design

The EliteBook X G2i is HP’s lead design for its business line, and our review unit makes a strong case for Atmospheric Blue, one of three finishes offered alongside Eclipse Gray and Glacier Silver. This range of color choices is rare in a segment that usually defaults to silver, and in person, the Atmospheric Blue finish feels corporate-professional rather than consumer-focused, with a deep matte tone that hides fingerprints well. The chassis starts at 0.99kg for the lightest build and carries MIL-STD 810H testing, ENERGY STAR certification, and EPEAT Climate+ Gold registration. Our clamshell model weighed 2.4 pounds, and the 2-in-1 model weighed 3.18 pounds, which we believe is mainly due to the aluminum top shell on the 2-in-1 compared to the plastic top shell on the clamshell version.

HP EliteBook X G2i open on the lab bench with the 14-inch display on

HP sent us both members of this family, and the pair photographed well together. We benchmarked the clamshell. The EliteBook X Flip G2i convertible folds into tent mode and then into a tablet, and it accepts an optional rechargeable pen that nests inside the chassis. The Flip carries touch panels across its range and gives up the clamshell’s brightest options, which is why it appears in our battery table and nowhere else in this review; the four extra hours it ran are due to the display difference doing the work.

HP EliteBook X Flip G2i in tent mode next to the HP EliteBook X G2i clamshell

Our unit’s panel is the 14-inch 3K at 2880 x 1800 with a 120Hz refresh, the resolution HP reserves for the top of the display stack. The two-screen strategy is the interesting choice here: the volume configurations run WUXGA at 1920 x 1200 in brightness tiers up to an 800-nit Sure View privacy option, while the 3K tier steps up to OLED, including a 700-nit Tandem OLED touch variant. That is a genuinely wide range for one chassis, and it means two EliteBook X G2i units on the same desk can carry very different screens.

HP pitches the new Tandem OLED at the top of that stack as significantly brighter, with double the panel lifespan and lower power draw. Though our brighter model lacks the all-glass display of its touchscreen counterpart, it still delivers a strong image, backed by its 3k resolution, as shown below. This display would likely perform better in high light or outdoor environments.

Close-up of the HP EliteBook X G2i display showing web content

The keyboard is HP’s spill-resistant, backlit Premium layout, and its party trick is invisible: the assembly is top-mounted and comes off in three steps with no screws, a swap HP says takes about ten minutes, against competitor designs the company says need many more screws and a full teardown to reach a bottom-mounted keyboard. HP sells a standalone keyboard replacement kit, around $100 to $150 per the workshop, and a QR code engraved on the bottom cover will link straight to replacement ordering. The power key integrates the fingerprint reader, so one press boots and authenticates.

HP EliteBook X G2i keyboard deck with backlit keyboard, glass trackpad, and EliteBook X branding

One item people tend not to pay much attention to when purchasing is the trackpad. Here, the trackpad features a haptic design that HP says is about 23% larger this generation, with a waterfall edge that doubles as a slider for brightness and volume, and it is its own module, replaceable without disturbing the keyboard. Our review units have haptic touchpads that let you adjust click sensitivity and haptic intensity directly in Windows settings, along with customizable multi-finger gestures for media, app, and desktop controls.

Close-up of the HP EliteBook X G2i trackpad and palm rest

Above the display, the 5MP IR camera handles Windows Hello and feeds HP’s Poly Camera Pro stack, which runs framing, spotlight, background blur, and virtual backgrounds on the NPU rather than the CPU, part of the AI PC story that holds up in our Procyon NPU results. Dynamic Voice Leveling and AI noise reduction ride along on the audio side.

HP EliteBook X G2i top bezel with the 5MP IR camera

Connectivity is stronger than the thin chassis suggests. One edge carries HDMI 2.1, two Thunderbolt 4 USB-C ports, and the headset jack; the other adds a third USB-C, a powered USB-A for legacy peripherals, and the lock slot, with an optional nano SIM position for WWAN configurations. Wireless is Intel’s Wi-Fi 7 BE211 with Bluetooth 6.

HP EliteBook X G2i edge with HDMI 2.1, two Thunderbolt 4 USB-C ports, and the headset jack

It is necessary to note that during hands-on testing of the clamshell variant of the EliteBook X G2i, we observed noticeable deflection in the center of the top case. Though it was noticeable when carrying the notebook one-handed and closed, there was not much flex when opening the lid from a single corner. We did not observe any deflection on the 2-in-1 model, but it appears to be due to material differences between the variants. The clamshell model offers lightweight portability, while the 2-in-1 has a bit more heft in exchange for a stiffer top case for the flip function.

HP EliteBook X G2i edge with USB-C, powered USB-A, and the nano security lock slot

The underside is a single vent field feeding two fans. HP’s SmartSense uses motion sensors to distinguish a lap from a table and cools the underside accordingly. The Smart Resource Optimizer prioritizes foreground applications, delivering up to 15% better performance under heavy load, according to HP. A Battery Extender mode on the Intel models trades refresh rate, brightness, and conferencing effects for what HP says adds up to two extra hours.

Underside of the HP EliteBook X G2i showing the intake vents

Inside, the layout is as serviceable as the keyboard story implies: two fans up top, the 68Wh Long Life 6-cell pack across the bottom, and the M.2 SSD accessible under a shield. The battery fast-charges to 50% in 30 minutes, and HP also ships a worldwide battery replacement kit for end-to-end swaps. For an IT fleet, this, plus the replaceable top-mount keyboard, is the difference between a bench repair and a chassis swap. The sustainability story runs deep: HP says 80% of the major parts contain recycled materials, down to magnesium from recycled wheel rims and carbon black from tires, and the redesigned 100W GaN adapter in our box is at least 90% recycled plastic.

HP EliteBook X G2i internals with dual fans and the 68Wh battery

HP EliteBook X G2i Performance

Our review unit runs the Core Ultra 7 366H with integrated Intel graphics, 32GB of LPDDR5X at 8533 MT/s, and a 1 TB SK hynix Gen5 SSD on Windows 11 Pro, with benchmarks tested in the Best Performance power mode. For battery life testing, we configure systems into Balanced power mode and set the screen brightness to 50%.

For comparables, we included the Dell Pro 7 14 Intel (Core Ultra 7 366H, 64GB), which runs the same processor and integrated graphics as our review unit and gives us a direct silicon-to-silicon read; the Dell Pro 5 14 Intel (Core Ultra X7 368H, Arc B390, 64GB), whose 12 Xe-core GPU is a useful proxy for the EliteBook X G2i configuration we did not test; and the Lenovo ThinkPad P14s Gen 7 (Core Ultra 7 366H, RTX PRO 1000, 64GB) as the workstation-class reference, again on the same CPU. Note that all three comparison systems have 64GB of memory compared to our unit’s 32GB, and a few comp cells are N/A where a system’s review predates a benchmark in the current suite.

PCMark 10

PCMark 10 measures general system performance across everyday work such as web browsing, video conferencing, spreadsheets, and content creation, providing a broad view of where a system’s strengths lie. Higher scores are better.

PCMark 10 HP EliteBook X G2i Dell Pro 7 14 Intel Dell Pro 5 14 Intel Lenovo ThinkPad P14s Gen 7
Overall Score 9,209 8,438 7,945 9,083
Essentials 10,760 10,981 10,751 10,686
Productivity 18,859 13,992 13,821 16,501
Digital Content Creation 10,445 10,610 9,158 11,534


The overall 9,209 leads every comparison system, but the Productivity sub-score is the headline: 18,859 is the highest we have recorded in this class, 14% ahead of the ThinkPad and roughly 35% ahead of both Dell Pro machines, driven by a 23,502 spreadsheet score. Digital Content Creation lands mid-pack, which fits an 8 Xe-core iGPU against the Arc and RTX silicon in the group.

PCMark 10 Modern Office Battery

The battery test repeatedly runs common office tasks until the battery reaches the test’s cutoff point, in Balanced mode at 50% display brightness. This is a rundown of the whole system rather than a synthetic idle drain, so it tracks closely with what a full day of productivity work does to the battery. Longer runtimes are better. This table adds the EliteBook X Flip G2i, which we battery-tested specifically to isolate the display’s impact on runtime; the two systems share a platform but carry different panels.

Modern Office Battery HP EliteBook X G2i HP EliteBook X Flip G2i Dell Pro 7 14 Intel Dell Pro 5 14 Intel Lenovo ThinkPad P14s Gen 7
Runtime (higher is better) 17 hours 13 minutes 21 hours 20 minutes* 26 hours 18 minutes 26 hours 48 minutes 15 hours 52 minutes


*The Flip result is the runtime recorded in the test log; the run ended with a benchmark error after logging 21 hours and 20 minutes.

Seventeen hours and 13 minutes clear two working days, but it sits mid-pack here: both Dell Pro machines run past 26 hours, and the Flip outlasts its own clamshell sibling by more than four hours on the same silicon. That gap is the display talking, and it is the clearest evidence in this review that panel choice is the battery decision on this platform. HP’s own workshop testing tells the same story at a larger scale: the company clocked around 31 hours of video playback on the 300-nit OLED against around 23 hours on the 500-nit panel, per HP’s internal figures.

Geekbench 6

Geekbench 6 measures processor performance using a mix of common tasks, with separate scores for single-core and multi-core workloads, plus GPU compute scores through OpenCL and Vulkan. Higher scores are better. The Dell Pro reviews predate our GPU compute captures on this test, so those cells are N/A.

Geekbench 6 HP EliteBook X G2i (Intel Graphics) Dell Pro 7 14 Intel (Intel Graphics) Dell Pro 5 14 Intel (Arc B390) Lenovo ThinkPad P14s Gen 7 (RTX PRO 1000)
CPU Single-Core 2,804 2,862 2,968 2,808
CPU Multi-Core 16,390 16,787 16,874 16,319
GPU OpenCL 24,453 23,741 32,458 87,537
GPU Vulkan 26,528 25,533 43,382 73,204


The three 366H systems land within 3% of each other on CPU, with the X7 368H in the Dell Pro 5 14 taking the single-core lead. The review unit’s integrated graphics turn in 24,453 in OpenCL and 26,528 in Vulkan, numbers that the RTX PRO 1000 more than triples; within integrated silicon, they are exactly where this iGPU should sit.

Geekbench 7

Geekbench 7 joins the suite alongside Geekbench 6 as comparison data accumulates. It uses updated workloads and a rebased scoring range, so results are not comparable between the two versions. Higher scores are better.

Geekbench 7 HP EliteBook X G2i (Intel Graphics) Dell Pro 7 14 Intel (Intel Graphics) Dell Pro 5 14 Intel (Arc B390) Lenovo ThinkPad P14s Gen 7 (RTX PRO 1000)
CPU Single-Core 2,527 2,589 2,701 2,533
CPU Multi-Core 17,345 17,805 18,737 17,651
GPU OpenCL 23,737 23,876 54,664 75,340
GPU Vulkan 23,036 23,484 47,233 70,067


The silicon-to-silicon read is tight: 2,527 and 17,345 against the Dell Pro 7 14’s 2,589 and 17,805 on the same processor, and the two integrated GPUs land within 2% of each other in both APIs. The Arc B390 in the Dell Pro 5 14 more than doubles both iGPU compute scores, which is the cleanest preview of what the untested X7 358H EliteBook config would add.

Cinebench 2026

Cinebench 2026 is the current release in the Cinebench line and the only version we report. It tests CPU and GPU performance using Maxon’s Redshift render engine, built on the latest Cinema 4D code. Because code and compiler changes accelerated scene rendering, scores use an adjusted range and should not be compared to previous Cinebench versions. Its GPU test does not run on Intel integrated graphics, so only the discrete-GPU ThinkPad posts a GPU score here.

Cinebench 2026 HP EliteBook X G2i Dell Pro 7 14 Intel Dell Pro 5 14 Intel Lenovo ThinkPad P14s Gen 7
CPU Single Thread 494 511 530 502
CPU Multiple Threads 4,060 3,807 3,656 4,492
GPU N/A N/A N/A 34,437


The review unit posts the best multi-thread result of the three integrated systems at 4,060, 7% ahead of the same-CPU Dell Pro 7 14, though the RTX-cooled ThinkPad still leads at 4,492. Single-thread runs the other way, with the EliteBook at the back of a pack separated by 7%.

3DMark CPU Profile

3DMark CPU Profile measures CPU performance at fixed thread counts, showing how a system scales from single-threaded work up to full saturation. Higher scores are better. The Dell Pro reviews predate this test in our suite, so their cells are N/A.

3DMark CPU Profile HP EliteBook X G2i Dell Pro 7 14 Intel Dell Pro 5 14 Intel Lenovo ThinkPad P14s Gen 7
Max Threads 9,179 9,699 10,370 10,500
16 Threads 8,995 9,679 10,355 10,421
8 Threads 5,814 6,450 6,669 6,550
4 Threads 3,812 4,240 4,256 4,219
2 Threads 2,095 2,230 2,269 2,251
1 Thread 1,108 1,163 1,181 1,165


Scaling is orderly from 1,108 at one thread to 9,179 at max threads, but the ThinkPad leads at every step on the same processor, by 13% at full saturation. Sustained-load thermal headroom is the likely difference between a 3-pound business chassis and a thicker workstation build.

7-Zip Compression

The built-in 7-Zip benchmark measures how quickly the processor can compress and decompress data using multiple threads, run with a 128MB dictionary across ten passes. Higher GIPS scores are better. The Dell Pro reviews recorded only the total rating, so their compression and decompression cells are N/A.

7-Zip 24.09 (GIPS) HP EliteBook X G2i Dell Pro 7 14 Intel Dell Pro 5 14 Intel Lenovo ThinkPad P14s Gen 7
Compressing 89.259 83.281 93.417 90.364
Decompressing 86.189 76.774 89.181 90.526
Total Rating 87.724 80.027 91.299 90.445


A total rating of 87.724 GIPS beats the same-CPU Dell Pro 7 14 by 8% and lands within 3% of the group-leading ThinkPad. For a 32GB system against 64GB comps, memory capacity clearly is not the constraint in this workload.

y-cruncher

y-cruncher measures how quickly the processor can calculate a large number of digits of Pi, placing a heavy load on the CPU and memory subsystem, while the BBP extracts hexadecimal digits of Pi. Results are in seconds, so lower times are better. The review unit could not run the 5-billion-digit computation because it exceeded the 32GB of memory, but in the lower tests, it held its own against the Dell units.

y-cruncher (seconds, lower is better) HP EliteBook X G2i Dell Pro 7 14 Intel Dell Pro 5 14 Intel Lenovo ThinkPad P14s Gen 7
Pi 1B 34.920 34.775 29.405 26.685
Pi 2.5B 97.527 104.586 90.719 76.787
Pi 5B N/A 240.554 204.685 172.994
Pi BBP 1B 1.842 1.835 1.718 1.621
Pi BBP 10B 22.451 21.280 20.212 18.200
Pi BBP 100B 269.011 301.611 256.416 219.969


At 1 billion digits, the review unit and the Dell Pro 7 14 are separated by a rounding error, which is what identical silicon should do. The 5B row is the one to notice: this is the first concrete cost of the 32GB configuration in this review, a workload the 64GB comps simply complete, and this machine cannot start.

Blender

The Blender benchmark measures rendering performance using three different 3D scenes: Monster, Junkshop, and Classroom. Results are reported in samples per minute, so higher scores are better. We test on the CPU and GPU. Scores are not comparable across Blender versions, so we report the scores for the current 5.2 release here.

Blender 5.2 (samples/min) HP EliteBook X G2i (Intel Graphics) Dell Pro 7 14 Intel (Intel Graphics) Dell Pro 5 14 Intel (Arc B390) Lenovo ThinkPad P14s Gen 7 (RTX PRO 1000)
GPU
Monster 250.14 254.40 560.28 922.95
Junkshop 154.95 189.59 466.36 795.65
Classroom 149.90 152.73 414.57 625.62
CPU
Monster 118.87 107.87 129.61 131.08
Junkshop 84.95 78.06 90.52 97.76
Classroom 57.45 53.90 62.20 68.45


GPU rendering tracks the silicon exactly: 250 samples per minute on Monster against 254 for the same iGPU in the Dell Pro 7 14, while the Arc B390 in the Dell Pro 5 14 renders at 2.2 times that rate and the RTX PRO 1000 at 3.7 times. CPU rendering is more flattering, with the review unit ahead of its silicon twin on all three scenes.

LuxMark

LuxMark is an OpenCL rendering benchmark built on LuxCoreRender, run on the Hall and Food scenes. Higher scores are better.

LuxMark v4 HP EliteBook X G2i Dell Pro 7 14 Intel Dell Pro 5 14 Intel Lenovo ThinkPad P14s Gen 7
Hall 2,481 2,168 3,287 11,342
Food 1,058 880 1,585 4,103


Hall at 2,481 and Food at 1,058 put the review unit 14% and 20% ahead of the same-CPU Dell Pro 7 14, with the usual integrated-versus-discrete gulf beyond that: the Arc B390 adds roughly a third again, and the ThinkPad’s RTX PRO 1000 is in a different category entirely.

V-Ray

V-Ray measures GPU path-tracing performance in vpaths using Chaos’ production renderer. Higher is better. The RTX engine requires NVIDIA hardware, so only the ThinkPad posts a score there.

V-Ray GPU (vpaths) HP EliteBook X G2i Dell Pro 7 14 Intel Dell Pro 5 14 Intel Lenovo ThinkPad P14s Gen 7
CUDA Engine 850 775 919 1,568
RTX Engine N/A N/A N/A 2,589


The 850 vpaths through the CUDA-compatible path are 10% up on the silicon twin and 8% behind the Arc B390. As with every GPU render test in this review, the class jump is from the discrete card to the integrated tier, not the other way around.

Blackmagic RAW Speed Test

The Blackmagic RAW Speed Test measures how quickly a system can decode Blackmagic RAW footage on the CPU and GPU, reported in frames per second at 8K with 12:1 compression. Higher is better. The Dell Pro reviews predate this test in our suite, so their cells are N/A.

Blackmagic RAW Speed Test HP EliteBook X G2i Dell Pro 7 14 Intel Dell Pro 5 14 Intel Lenovo ThinkPad P14s Gen 7
8K 12:1 CPU (fps) 72 68 76 77
8K 12:1 GPU (fps) 48 48 86 96


CPU decode at 72fps sits just behind the ThinkPad’s 77, while the GPU path at 48fps is half the RTX PRO 1000’s rate. For proxy-free 8K editing, this is a machine that leans on its CPU.

Topaz Video AI

The Topaz Video AI benchmark measures AI video upscaling and frame-interpolation performance in frames per second across the application’s enhancement models, run at 1080p input, where higher is better. The 16X Slowmo Aion model failed to complete on the review unit, the same failure we have recorded on other Intel integrated graphics systems.

Topaz Video AI (fps) HP EliteBook X G2i Dell Pro 7 14 Intel Dell Pro 5 14 Intel (Arc B390) Lenovo ThinkPad P14s Gen 7 (RTX PRO 1000)
Artemis 1X / 2X / 4X 2.45 / 2.48 / 0.91 2.51 / 2.53 / 0.95 6.27 / 5.23 / 1.88 5.17 / 3.19 / 1.12
Iris 1X / 2X / 4X 2.44 / 1.40 / 0.43 2.38 / 1.37 / 0.42 5.06 / 3.10 / 0.93 5.91 / 3.12 / 1.01
Proteus 1X / 2X / 4X 2.59 / 2.86 / 1.11 2.52 / 2.76 / 1.06 6.37 / 6.03 / 2.42 4.78 / 3.14 / 1.05
Gaia 1X / 2X / 4X 1.34 / 0.91 / 0.69 1.31 / 0.89 / 0.67 3.27 / 2.24 / 1.47 1.62 / 1.13 / 0.79
Nyx 1X / 2X 0.72 / 0.72 0.71 / 0.71 1.56 / 1.52 2.40 / 2.09
Hyperion HDR 1X 2.08 2.02 3.13 14.56
4X Slowmo Apollo / APFast 4.61 / 16.06 3.08 / 14.64 8.52 / 24.27 10.39 / 29.94
16X Slowmo Aion DNF DNF DNF N/A


The review unit and the Dell Pro 7 14 move in lockstep across every model, usually within a few hundredths of a frame, which is silicon parity on display. The Arc B390 roughly doubles throughput on the enhancement models, and the Aion interpolation failure remains an Intel iGPU pattern rather than an HP problem.

UL Procyon AI Text Generation

The Procyon AI Text Generation benchmark measures local LLM inference across four models of increasing size—Phi, Mistral, Llama3, and Llama2—run here using OpenVINO on the integrated GPU. The Pro 5 14 does bring a higher-class CPU than the other comparisons, as well as a higher-class iGPU, but we will have to see how it stands against the RTX PRO 1000 that the ThinkPad P14s Gen 7 brings. When testing the RTX PRO 1000, we have to use a different inference engine: ONNX Runtime, as OpenVINO is Intel-only.  Higher scores are better.

Procyon AI Text Generation HP EliteBook X G2i Dell Pro 7 14 Intel Dell Pro 5 14 Intel Lenovo ThinkPad P14s Gen 7 (IGPU / RTX PRO 1000)
Phi 1,082 1027 1772 1071 / 1,618
Mistral 1,053 1027 1767 1058 / 1,397
Llama3 952 1014 1741 1047 / 1,252
Llama2 993 1009 1731 1012 / DNF


We see a pretty tight comparison with the same silicon in the Dell Pro 7 14, with a 55-point gap on Phi and a 26-point gap on Mistral. Llama 3 widens the gap in the other direction, favoring Dell with a 62-point lead and a 16-point lead over Llama 2. The Pro 5 14 leads the comparison group by a wide margin, helped by its higher-class CPU and iGPU, and even outpaces the RTX PRO 1000 in this test. That result likely reflects the Arc B390’s unified memory setup compared with the dedicated VRAM available to the RTX GPU.

UL Procyon AI Image Generation

The Procyon AI Image Generation benchmark measures local Stable Diffusion inference, run here through OpenVINO on the integrated GPU. The INT8 test uses the quantized SD 1.5 model. Higher scores are better.

Procyon AI Image Generation HP EliteBook X G2i Dell Pro 7 14 Intel Dell Pro 5 14 Intel (Arc B390) Lenovo ThinkPad P14s Gen 7 (RTX PRO 1000)
SD 1.5 FP16 258 258 635 943
SD 1.5 INT8 3,529 3,575 7,693 12,403
SDXL FP16 307 268 646 765


SD 1.5 FP16 returns 258, matching the Dell Pro 7 14 to the point, and INT8 lands within 1.3%. Just like above, the Dell Pro 5 14 brings a bit of a performance boost with its higher-class iGPU, and the ThinkPad P14s Gen 7 shows off its RTX PRO 1000.

UL Procyon AI Computer Vision

The Procyon AI Computer Vision benchmark measures inference performance across a range of neural networks, including MobileNet V3, ResNet 50, Inception V4, YOLO V3, DeepLab V3, and REAL-ESRGAN. The WinML runs use float32 on CPU and GPU, giving a like-for-like view across vendors. Higher scores are better.

Procyon AI Computer Vision (WinML) HP EliteBook X G2i Dell Pro 7 14 Intel Dell Pro 5 14 Intel Lenovo ThinkPad P14s Gen 7
CPU 126 121 119 134
GPU 205 205 398 426


In the computer vision test, we see tight comparisons again with 126 on CPU and 205 on GPU, almost matching the Dell Pro 7 14’s 121 on CPU and 205 on GPU scoring. It still comes in behind the Dell Pro 5 14 and the Lenovo, which have better GPUs, but the CPU scores were all within 15 points of each other.

SPECviewperf 15

SPECviewperf 15 measures graphics performance using viewsets derived from professional applications in CAD, 3D modeling, rendering, engineering, and medical visualization, replayed here at 1080p. Higher scores are better, although this is a business notebook rather than a certified workstation, so these results are context rather than a purchase criterion.

SPECviewperf 15 (FHD) HP EliteBook X G2i Dell Pro 7 14 Intel Dell Pro 5 14 Intel (Arc B390) Lenovo ThinkPad P14s Gen 7 (RTX PRO 1000)
3dsmax-08 8.70 9.58 20.21 28.20
blender-01 9.26 9.11 21.19 40.69
catia-07 5.66 5.27 10.27 43.36
creo-04 18.85 18.27 32.53 107.59
energy-04 3.62 3.68 10.78 45.79
enscape-01 6.29 6.22 14.28 25.45
maya-07 52.56 49.54 82.42 112.84
medical-04 9.97 9.91 22.96 86.38
snx-05 37.45 37.74 46.22 103.61
solidworks-08 12.37 11.86 23.60 53.63
unreal_engine-01 21.47 21.36 38.77 49.24


The review unit and the Dell Pro 7 14 are within a few percent across all 11 viewsets, another clean silicon match. The Arc B390 roughly doubles most viewsets, and the RTX PRO 1000 runs far ahead, which is the certified-workstation premium in one table.

SPECworkstation 4

SPECworkstation 4 measures workstation performance across CPU, graphics, storage, AI, and industry-vertical workloads using real applications. Higher scores are better, and N/A means the system did not complete all workloads required for that category, while DNF indicates a failed workload.

SPECworkstation 4 HP EliteBook X G2i Dell Pro 7 14 Intel Dell Pro 5 14 Intel Lenovo ThinkPad P14s Gen 7
Hardware Subsystems
CPU 1.16 1.08 1.19 1.35
Graphics 0.80 0.82 1.68 4.51
Accelerator 1.46 N/A N/A 3.26
Storage 1.65 1.68 1.76 1.67
Industry Verticals
AI & Machine Learning 1.16 1.18 1.36 1.65
Energy 1.02 0.90 1.18 1.69
Financial Services 0.79 0.78 0.78 0.96
Life Sciences 1.14 1.04 1.34 1.82
Media & Entertainment 1.24 1.16 DNF 1.81
Product Design 1.47 1.41 1.64 1.89
Productivity & Development 0.93 1.04 1.10 1.34


The review unit completed all 23 workloads cleanly, including the 7-Zip workload that has recently tripped several systems in our lab. The scores themselves tell the business-laptop story: competitive CPU and storage subsystems, a 0.80 graphics subsystem reflecting the 8 Xe cores, and an Accelerator score of 1.46 from the NPU that neither Dell Pro nor the original run captured.

Storage Performance

We measure storage with 3DMark’s Storage benchmark, which replays real-world gaming and content traces, and the Blackmagic Disk Speed Test for sequential throughput. Higher is better for both.

Storage HP EliteBook X G2i Dell Pro 7 14 Intel Dell Pro 5 14 Intel Lenovo ThinkPad P14s Gen 7
3DMark Storage 3,156 3,259 3,144 3,094
Blackmagic Write (MB/s) 8,949.2 8,934.5 8,747.3 8,262.3
Blackmagic Read (MB/s) 7,919.3 8,398.6 8,609.6 8,511.5


The SK hynix Gen5 drive writes at 8,949 MB/s, the fastest in the group, and its 3DMark Storage score of 3,156 sits in the middle of a tightly packed field. Sequential read at 7,919 MB/s trails the comps by 6 to 8%, a gap nobody outside a synthetic benchmark will feel.

Conclusion

Through performance testing, the EliteBook X G2i held its own against the Dell Pro 7 14 on the same silicon, ahead in Cinebench 2026 multi-thread and LuxMark, and a step behind in Geekbench 7, while coming in meaningfully lighter. Battery life trailed the LCD-equipped Pro 7 14 at 17 hours 13 minutes versus 26:18, but most of that gap is due to the 3K OLED panel’s power draw. The 32GB LPDDR5x configuration cost it a little in memory-bound workloads, where the largest y-cruncher runs were out of reach; a 64GB option is available in the lineup for buyers who need the headroom.

HP EliteBook X Flip G2i and EliteBook X G2i clamshell side by side on a lab bench

For buyers who want more graphics, HP offers the Core Ultra X7 358H with Arc B390 graphics in this same chassis, a 12 Xe-core tier that should land close to the Dell Pro 5 14 columns in our charts, since both carry the same CPU and GPU package. As it happens, that is also the build HP is actually selling: with no configurator live, the closest in-stock clamshell to our unit is the B390 version with the same 32GB, 1TB, and 3K OLED fit-out at $3,399 on sale, while the Flip variant of our 366H configuration runs $2,999.

Our one real gripe on the build is lid flex. Pressing the center of the closed lid produces noticeable give that competitors, and even the Flip counterpart, resist better, though opening the lid from a single corner shows little deflection. Beyond that, the chassis feels premium, and the machine is comfortable to work on.

The EliteBook X G2i runs head-to-head with heavier competition in a 2.4-pound package with a respectable port selection, and HP’s repairability work deserves the call-out: the keyboard comes out from the top without screws, and the battery swap is also easy. For buyers who want a serviceable, genuinely light business machine with a panel worth looking at all day— and even three color options—this is a solid choice.

For configuration options and current pricing, visit the HP EliteBook X G2i product page.

Leaderboard: The HP EliteBook X G2i enters our Laptop Battery Life Leaderboard at #9 with 17 hr 13 min, its Flip sibling enters at #7 with 21 hr 20 min, and it takes Best Executive Thin-and-Light on the Best Business Laptops leaderboard.

The post HP EliteBook X G2i Review: 17 Hours of OLED Battery in a 2.4-Pound Business Flagship appeared first on StorageReview.com.

Intel Xeon 658X Review: Granite Rapids For Workstations

17 August 2026 at 18:00

Intel's Granite Rapids CPUs have finally made it to the workstation market as the Xeon 600 family. Today we are reviewing the Xeon 658X, a 24 core chip that packs a punch, thanks in part to its memory bandwidth

The post Intel Xeon 658X Review: Granite Rapids For Workstations appeared first on ServeTheHome.

Dell Pro Precision 7 16 Intel Review: RTX PRO 3000 Blackwell in a Tandem OLED Workstation

14 August 2026 at 20:02

The Dell Pro Precision 7 16 is the higher-end 16-inch mobile workstation in Dell’s current Pro Precision lineup. Our review unit is built around significantly more GPU power than the 5 16s Intel tested alongside it. It pairs a Series 3 Intel Core Ultra 9 386H, a 16-core Panther Lake processor with a 50 TOPS NPU, with NVIDIA RTX PRO 3000 Blackwell graphics and 12GB of GDDR7, 64GB of LPDDR5x at 8533 MT/s, and two 1TB Gen5 SSDs in RAID 0. The panel is a 16-inch UHD+ Tandem OLED with touch and a 120Hz variable refresh rate, running at 3840 x 2400. In testing, the discrete GPU rendered the Blender Monster scene at 1,555.53 samples per minute, roughly 2.7 times the integrated Arc Pro B390 in the 5 16s Intel, while the same configuration recorded the shortest battery runtime of any Pro Precision we have tested.

Dell Pro Precision 7 16 seen from behind with the lid open, showing the Magnetite aluminum lid and Dell badge

Compared with the Pro Precision 5 16s Intel, the 7 16 trades some portability and battery life for substantially more GPU performance and a higher-end feature set. Our configuration adds the RTX PRO 3000, a 96Wh battery, a 165 W adapter, a second Gen5 drive bay, and two Thunderbolt 5 ports alongside Thunderbolt 4. It is a better fit for engineers, designers, visualization specialists, video professionals, and other users whose applications benefit from dedicated NVIDIA graphics. The 7 16 also features a large haptic trackpad, which immediately differentiates the keyboard deck from the 5 16s.

The RTX PRO 3000 Blackwell is the mobile professional card in the NVIDIA Blackwell generation, with 12GB of GDDR7 and certified drivers for professional applications. Combined with the 50 TOPS NPU in the Core Ultra 9 386H, the system can run local AI work across the CPU, the discrete GPU, or the dedicated accelerator, and our Procyon testing covers all three paths. Coverage also includes professional graphics, rendering, content creation, storage, and battery.

The Dell Pro Precision 7 16 starts at $3,293, while the hardware in our review unit costs approximately $8,245. Dell’s public configurator does not currently allow us to reproduce the two-drive Gen5 RAID 0 configuration exactly, even though the otherwise equivalent single-drive configuration is priced at $7,795 in our brief. Applying the same $440 price difference for the second Gen5 SSD brings the as-shipped equivalent to that figure. Commercial buyers may see different pricing through account agreements and volume purchases, so Dell.com’s single-unit pricing is best used as a reference. The system is now available on the Dell Pro Precision 7 Series 16 product page.

Dell Pro Precision 7 16 Specifications

Specification Dell Pro Precision 7 16 (PW716260)
Model Dell Pro Precision 7 Series 16 (PW716260)
Processor Intel Core Ultra 9 386H vPro Enterprise (Series 3), 16 cores / 16 threads, up to 4.9GHz, 50 TOPS NPU
Graphics NVIDIA RTX PRO 3000 Blackwell, 12GB GDDR7
Memory 64GB LPDDR5x, 8533 MT/s, dual-channel, onboard, non-ECC
Storage Two 1TB Gen5 SED-ready SSDs in RAID 0
Display 16″ UHD+ Tandem OLED 3840 x 2400, touch, 120Hz VRR, 500 nits, 100% DCI-P3, VESA DisplayHDR True Black 1000, anti-reflection
Camera 8MP HDR RGB + IR with User Presence Detection and ExpressSign-In
Wireless Intel Wi-Fi 7 BE211 2×2, Bluetooth 6.0
Keyboard Zero-lattice spill-resistant with mini-LED backlighting
Security TPM 2.0, FIPS 140-3, TCG certified, post-quantum cryptography, chassis intrusion detection, SED storage, Windows Hello facial recognition
Battery 6-cell, 96Wh Long Life Cycle
Power 165W USB-C AC adapter
Ports Two Thunderbolt 5, one Thunderbolt 4, HDMI 2.1, headset, SD card slot
Operating System Windows 11 Pro, Copilot+ PC
Chassis Aluminum and magnesium, Magnetite
Systems Management Intel vPro Enterprise
Certifications ENERGY STAR, EPEAT Gold with Climate+, TCO Certified
Warranty 36 months ProSupport Next Business Day Onsite Service after Remote Diagnosis
Price $3,293 base / approximately $8,245 as shipped

Build and Design

Dell Pro Precision 7 16 closed at an angle, showing the Magnetite lid finish

The Dell Pro Precision 7 16 has a noticeably more substantial design than the 5 Series models, featuring aluminum and magnesium construction with Dell’s dark Magnetite finish. Our configuration remains fairly portable for a 16-inch workstation with RTX PRO 3000 graphics and a 96Wh battery, with Dell listing a starting weight of 4.78 lb. The OLED configuration measures 13.93 x 9.46 inches and ranges from 0.80 to 0.83 inches thick. Next to the Pro Precision 5 16s, the differences are easy to see: the 7 16 drops the numeric keypad in favor of a centered keyboard, a large haptic trackpad, and speaker grilles running along both sides of the deck.

Dell Pro Precision 7 16 keyboard deck with zero-lattice keyboard, numeric-free layout and large trackpadThe keyboard uses Dell’s zero-lattice design with mini-LED backlighting, and the centered layout makes good use of the wider 16-inch chassis. Removing the numeric keypad gives the main keyboard and trackpad a more symmetrical position in front of the display, while the large speaker grilles fill the space along either side. Dell uses two 2.5W woofers and two 2.5W tweeters for a total peak output of 10W, a much larger audio configuration than the basic stereo setup in the 5 16s. The keyboard also includes the dedicated Copilot key used across Dell’s current commercial lineup.

Close-up of the Dell Pro Precision 7 16 trackpad and keyboard edgeBelow the keyboard is one of the Pro Precision 7 16’s more distinctive features: a large haptic trackpad that takes up a substantial portion of the palm rest. Instead of using the hinged mechanism found in a conventional trackpad, the click response is generated electronically, allowing the surface to provide a similar click response across a much larger area. Combined with the centered keyboard layout, it gives the 7 16 a noticeably different feel from the Pro Precision 5 systems we have been testing.

Dell equips the Precision 7 16 with an 8MP HDR RGB and IR camera above the display, with User Presence Detection and ExpressSign-In available for automatic Windows locking and sign-in behavior. The camera supports Windows Hello facial recognition and is paired with dual-array microphones, although this camera configuration does not include a physical privacy shutter.

Dell Pro Precision 7 16 UHD+ Tandem OLED panel viewed at an angleThe 16-inch Tandem OLED display is a substantial upgrade over the IPS panels used in the Pro Precision 5 systems, particularly for creators and other users working with high-resolution visual content. Our configuration has a 3840 x 2400 resolution, 120Hz variable refresh rate, 500-nit brightness, 100% DCI-P3 coverage, anti-reflection treatment, and VESA DisplayHDR True Black 1000 certification. The combination of 4K-class resolution and a 16:10 aspect ratio gives applications a large working area, while the 120Hz refresh rate makes scrolling, window movement, and cursor motion noticeably smoother than on a conventional 60Hz workstation panel. OLED also delivers very deep blacks and strong contrast, which is useful when working with HDR media, photography, and other color-sensitive content.

Touch input on the Dell Pro Precision 7 16 UHD+ Tandem OLED displayOur OLED configuration also supports touch, which works particularly well on a display this large for quick navigation, selecting items, or moving through visual content. The conventional clamshell hinge limits the system’s usefulness for extended pen-style input compared with a convertible, since the display cannot fold flat against the keyboard. For occasional direct interaction, however, having touch available on a 16-inch workstation panel is a useful addition, especially with the high-resolution OLED display.

Left-side ports on the Dell Pro Precision 7 16For I/O and connectivity, the right side has a full-size SD card slot, one Thunderbolt 4 USB-C port, the 3.5mm headset connection, and a wedge-shaped lock slot. Having two Thunderbolt 5 ports plus a third Thunderbolt 4 connection gives the 7 16 an unusually strong USB-C layout, although Dell leaves out both USB-A and built-in Ethernet. So, users working with older USB peripherals or wired networks will need an adapter or dock, which is an important difference from the Pro Precision 5 16s and its wider selection of legacy ports.

Right-side ports on the Dell Pro Precision 7 16 including HDMI and USB-CMoving over to the left side, you’ll see that connectivity is heavily centered on Thunderbolt, with HDMI 2.1 alongside two Thunderbolt 5 USB-C ports. Those Thunderbolt 5 connections support Power Delivery and DisplayPort 2.1, with bandwidth reaching up to 120 Gbps for supported devices, giving the 7 16 a lot more external I/O bandwidth for fast storage, docks, and high-resolution displays. The two ports are positioned beside the HDMI connection, keeping most desk-oriented display and docking cables together on the same side.

Underside of the Dell Pro Precision 7 16 with rear exhaust vents and Pro Precision branding

The underside of the Pro Precision 7 16 features a broad two-row intake grille that feeds the dual-fan cooling system directly above it. The long, narrow rubber feet maintain clearance beneath the chassis for airflow, while the rear edge provides additional space for the cooling system to exhaust heat behind the display. Dell keeps access to the internals relatively simple, with the entire bottom panel secured by just four T5 screws. Once those are removed, the cover can be released from the recesses near the hinges and lifted away.

Dell Pro Precision 7 16 internals showing dual fans, two M.2 SSD slots and the 96Wh batteryHere, there is direct access to the 96Wh battery, both SSD positions, and the dual-fan cooling system. Our configuration uses two 1TB Gen5 SSDs in RAID 0, with SSD1 and SSD2 in separate positions on opposite sides of the motherboard. Dell classifies the battery, SSDs, cooling fans, wireless card, and speaker assembly as customer-replaceable components, while hardware such as the heatsink, I/O boards, display assembly, touchpad, and keyboard assembly is intended for technician service. The 64GB of LPDDR5x memory is integrated into the system board, so the memory capacity must be selected when the system is ordered.

Close-up of the Dell Pro Precision 7 16 cooling fan and SSD1 slotThe Pro Precision 7 16 uses a much beefier cooling setup than the single-fan design in the 5 16s, which is appropriate given the RTX PRO 3000 and higher power demands. Two large fans fill the rear corners and work with a wide thermal assembly covering the CPU and GPU, with hot air exhausted out the back of the chassis. Both SSDs are positioned outside that central cooling area and have their own covers, so either drive is easy to reach once the bottom panel is off. The large 96Wh battery takes up most of the lower half, but Dell still leaves the storage, cooling system, and other serviceable components easily accessible.

Dell Pro Precision 7 16 Performance

Our review unit runs the Core Ultra 9 386H with NVIDIA RTX PRO 3000 Blackwell graphics, 64GB of LPDDR5x at 8533 MT/s, and two 1TB Gen5 SSDs in RAID 0 on Windows 11 Pro, with benchmarks tested on the Best Performance power mode. For battery life testing, we configure systems into Balanced power mode and set the screen brightness to 50%.

For comparables, we included the Dell Pro Precision 5 16s Intel (Core Ultra X9 388H, Arc Pro B390, 64GB), the Dell Pro Precision 5 16s AMD (Ryzen AI 9 HX PRO 475, Radeon 890M, 64GB), and the Lenovo ThinkPad P14s Gen 7 (Core Ultra 7 366H, RTX PRO 1000, 64GB) as the external workstation reference.

PCMark 10

PCMark 10 measures general system performance across everyday work such as web browsing, video conferencing, spreadsheets, writing, photo editing, and rendering. The overall score is supported by the Essentials, Productivity, and Digital Content Creation subscores, which indicate where a system’s strengths lie. Higher scores are better.

PCMark 10 Dell Pro Precision 7 16 Dell Pro Precision 5 16s Intel Dell Pro Precision 5 16s AMD Lenovo ThinkPad P14s Gen 7
Overall Score 8,901 9,994 8,627 9,083
Essentials 9,671 12,106 10,744 10,686
Productivity 16,381 15,505 14,574 16,501
Digital Content Creation 12,081 14,433 11,127 11,534


PCMark 10 was one of the weaker results for the Pro Precision 7 16, with an overall score of 8,901, trailing both the 5 16s Intel and the ThinkPad P14s Gen 7. Essentials came in at 9,671, the lowest result of the four systems, while Productivity was much closer at 16,381 compared with 16,501 for the ThinkPad. These general productivity workloads do not take full advantage of the RTX PRO 3000, which becomes much more important in the GPU-focused tests later on.

PCMark 10 Modern Office Battery

The PCMark 10 Modern Office battery test repeatedly runs common office tasks until the battery reaches the test’s cutoff point, in Balanced mode at 50% display brightness. This is a rundown of the whole system rather than a synthetic idle drain, so it tracks closely with what a full day of productivity work does to the battery. Longer runtimes are better.

Modern Office Battery Dell Pro Precision 7 16 Dell Pro Precision 5 16s Intel Dell Pro Precision 5 16s AMD Lenovo ThinkPad P14s Gen 7
Runtime (higher is better) 11 hours 43 minutes 24 hours 43 minutes 15 hours 5 minutes 15 hours 52 minutes


This is the bill for the configuration. Eleven hours and 43 minutes is the shortest run of any Pro Precision we have tested, less than half the 24 hours and 43 minutes the 5 16s Intel manages, and that is with a 96Wh pack against the 5 series 70Wh. A discrete GPU, a 4K OLED at 120Hz, and two Gen5 drives all draw power from the same battery. It still clears a working day, but all-day-and-then-some belongs to the 5 series.

Geekbench 6

Geekbench 6 measures processor performance using a mix of common tasks, with separate scores for single-core and multi-core workloads, plus GPU compute scores through OpenCL and Vulkan. Higher scores are better. Our review unit’s CPU run was flagged as invalid by the benchmark’s tamper detection. We reviewed it and treated the flag as a false positive, so the scores are included below.

Geekbench 6 Dell Pro Precision 7 16 (RTX PRO 3000) Dell Pro Precision 5 16s Intel (Arc Pro B390) Dell Pro Precision 5 16s AMD (Radeon 890M) Lenovo ThinkPad P14s Gen 7 (RTX PRO 1000)
CPU Single-Core 2,915 2,969 2,854 2,808
CPU Multi-Core 17,280 17,401 14,169 16,319
GPU OpenCL 131,492 57,998 37,520 87,537
GPU Vulkan 104,344 63,015 53,969 73,204


The two Intel Precisions are effectively tied on CPU, with the 5 16s Intel a fraction ahead at 2,969 and 17,401 against 2,915 and 17,280. Everything that separates them is on the GPU side, where the RTX PRO 3000 returns 131,492 in OpenCL, 2.3 times the Arc Pro B390 and 50% clear of the RTX PRO 1000 in the ThinkPad.

Geekbench 7

Geekbench 7 joins the suite alongside Geekbench 6 as comparison data builds. Its CPU scores are calibrated against a baseline of 2,500, set by the AMD Ryzen 7700, while GPU scores are calibrated against a baseline of 100,000, set by the NVIDIA GeForce RTX 4060. Higher scores are better, and double the score indicates double the performance. Because Geekbench 7 uses new workloads and new baselines, its scores are not comparable to Geekbench 6 results.

Geekbench 7 Dell Pro Precision 7 16 (RTX PRO 3000) Dell Pro Precision 5 16s Intel (Arc Pro B390) Dell Pro Precision 5 16s AMD (Radeon 890M) Lenovo ThinkPad P14s Gen 7 (RTX PRO 1000)
CPU Single-Core 2,652 2,733 2,659 2,533
CPU Multi-Core 18,648 18,965 16,641 17,651
GPU OpenCL 96,919 54,247 31,874 75,340
GPU Vulkan 104,229 47,436 * 70,067
GPU CUDA 174,559 N/A N/A 114,469


Geekbench 7 repeats the pattern. The 386H trails its own 5 16s sibling slightly on both CPU metrics, then leads every GPU metric, topping out at 174,559 in CUDA against 114,469 for the RTX PRO 1000. Neither integrated system can run CUDA at all, which is the practical argument for the card.

Cinebench 2026

Cinebench 2026 is the current release in the Cinebench line and the only version we report. It tests CPU and GPU performance using Maxon’s Redshift render engine. It is built on the latest Cinema 4D 2026 code and is designed to show whether a machine is stable under high CPU load, whether a notebook’s cooling can sustain longer render tasks, and how it handles demanding real-world 3D work. Because code and compiler changes accelerated scene rendering, Cinebench 2026 scores use an adjusted range and should not be compared to scores from previous Cinebench versions. Its GPU test supports current NVIDIA and AMD hardware but does not yet run on Intel integrated graphics, and our review unit’s CPU results were confirmed by a repeat run.

Cinebench 2026 Dell Pro Precision 7 16 Dell Pro Precision 5 16s Intel Dell Pro Precision 5 16s AMD Lenovo ThinkPad P14s Gen 7
CPU Single Thread 518 535 471 502
CPU Multiple Threads 3,873 4,618 4,767 4,492
GPU 51,517 N/A 5,667 34,437


The GPU result is the headline here: 51,517 for the Radeon 890M versus 5,667, with the Arc Pro B390 unable to run the test. The CPU side is less flattering. Single thread at 518 sits mid-pack, and the multi-thread 3,873 is the lowest of the four, 16% behind the 5 16s Intel on a comparable 16-core, 16-thread part. We repeated the run and reproduced the same figure.

7-Zip Compression

The built-in 7-Zip benchmark measures how quickly the processor can compress and decompress data using multiple threads, run with a 128MB dictionary across ten passes. Decompression tends to scale with thread count while compression leans on memory latency, so the two halves often tell different stories. Higher GIPS scores are better.

7-Zip 24.09 (GIPS) Dell Pro Precision 7 16 Dell Pro Precision 5 16s Intel Dell Pro Precision 5 16s AMD Lenovo ThinkPad P14s Gen 7
Compressing 96.202 96.281 85.627 90.364
Decompressing 95.896 97.246 117.863 90.526
Total Rating 96.049 96.764 101.745 90.445


Compression was essentially tied between the two Intel Precisions, with the 7 16 scoring 96.202 GIPS compared with 96.281 GIPS from the 5 16s Intel. Decompression favors the 24-thread AMD system, which reached 117.863 GIPS and finished with the highest total rating at 101.745. The 7 16 placed second overall at 96.049, ahead of the ThinkPad but behind both the 5 16s Intel and AMD systems in total performance.

y-cruncher

y-cruncher measures how quickly the processor can calculate large numbers of digits of Pi, placing a heavy load on the CPU and memory subsystem. At the same time, the BBP runs to extract hexadecimal digits of Pi. Results are in seconds, so lower times are better. The AMD unit could not complete the 5-billion- and 10-billion-digit runs because its memory reservation for the integrated GPU reduces the available pool below the amount required for those sizes.

y-cruncher (seconds, lower is better) Dell Pro Precision 7 16 Dell Pro Precision 5 16s Intel Dell Pro Precision 5 16s AMD Lenovo ThinkPad P14s Gen 7
Pi 1B 31.557 26.422 22.840 26.685
Pi 2.5B 101.524 80.463 64.242 76.787
Pi 5B 226.255 183.822 N/A 172.994
Pi 10B 500.875 407.658 N/A 392.083
Pi BBP 1B 1.639 1.635 1.100 1.621
Pi BBP 10B 21.512 19.036 12.277 18.200
Pi BBP 100B 291.628 234.797 140.284 219.969


y-cruncher is the clearest CPU loss in the review. The 7 16 is the slowest of the four on every computation, taking 500.875 seconds at Pi 10B, compared with 392.083 for the ThinkPad and 407.658 for the 5 16s Intel, and the BBP runs repeat it exactly. There is no GPU component here, so the discrete card contributes nothing, and the sustained-clock behavior is left exposed.

Blender

The Blender benchmark measures rendering performance using three different 3D scenes: Monster, Junkshop, and Classroom. Results are reported in samples per minute, so higher scores are better. We test on both the CPU and GPU. Scores are not comparable across Blender versions, so we have trimmed the older releases from the suite and report the current Blender 5.2 results here. The GPU figures represent each system’s fastest renderer: the discrete card on the two NVIDIA systems and the integrated GPU on the 5 16s pair.

Blender 5.2 (samples/min) Dell Pro Precision 7 16 (RTX PRO 3000) Dell Pro Precision 5 16s Intel (Arc Pro B390) Dell Pro Precision 5 16s AMD (Radeon 890M) Lenovo ThinkPad P14s Gen 7 (RTX PRO 1000)
GPU
Monster 1,555.53 572.84 123.00 922.95
Junkshop 1,257.01 468.85 101.21 795.65
Classroom 1,000.62 420.48 82.84 625.62
CPU
Monster 137.49 138.88 130.86 131.08
Junkshop 101.34 94.97 99.74 97.76
Classroom 69.26 65.39 74.18 68.45


This is what the card is for. The RTX PRO 3000 renders Monster at 1,555.53 samples per minute, 2.7 times the Arc Pro B390 and 69% ahead of the RTX PRO 1000, and the margin holds across Junkshop and Classroom. CPU rendering is a different picture, with all four within a few percent of each other; the 7 16 takes Junkshop at 101.34 and loses to the 24-thread AMD part in Classroom.

LuxMark

LuxMark measures GPU compute performance by rendering complex scenes through OpenCL, based on LuxCoreRender. We run the Food and Hall scenes on all available OpenCL devices in each system, so single-GPU systems are scored on that GPU while the dual-GPU systems render on the discrete and integrated GPUs together, as noted in the column headers. Higher scores are better.

LuxMark v4 Dell Pro Precision 7 16 (RTX PRO 3000 + iGPU) Dell Pro Precision 5 16s Intel (Arc Pro B390) Dell Pro Precision 5 16s AMD (Radeon 890M) Lenovo ThinkPad P14s Gen 7 (RTX PRO 1000 + iGPU)
Hall 19,300 3,505 2,058 11,342
Food 7,624 1,713 1,034 4,103


LuxMark scales the same way. Hall at 19,300 is 5.5 times the Arc Pro B390 and 70% ahead of the ThinkPad, and Food widens that to 4.5 times and 86%. These are the margins that justify the chassis for anyone running OpenCL renderers.

V-Ray

Chaos V-Ray measures ray-traced rendering throughput, reported in vpaths, where higher is better. We run the CUDA-compatible engine on every system so results remain comparable to notebooks with only integrated graphics; on systems without a discrete GPU, that path executes on the integrated graphics, even though V-Ray reports the processor name in its device field. On dedicated NVIDIA hardware, we also capture V-Ray’s RTX engine, which engages the card’s ray tracing cores and is reported separately.

V-Ray GPU (vpaths) Dell Pro Precision 7 16 (RTX PRO 3000) Dell Pro Precision 5 16s Intel (Arc Pro B390) Dell Pro Precision 5 16s AMD (Radeon 890M) Lenovo ThinkPad P14s Gen 7 (RTX PRO 1000)
CUDA Engine 2,469 946 1,039 1,568
RTX Engine 3,891 N/A N/A 2,589


V-Ray shows a significant advantage for the two systems with dedicated NVIDIA graphics, especially when the RTX engine is used. The Pro Precision 7 16 reached 3,891 vpaths in the RTX test, compared with 2,589 for the RTX PRO 1000, while its CUDA result of 2,469 was 57% higher than that of the ThinkPad. The integrated systems can use only the CUDA path here, with both finishing at less than half of the 7 16’s score.

3DMark CPU Profile

The 3DMark CPU Profile benchmark measures CPU performance at fixed thread counts, from a single thread up to the maximum available, showing how performance scales as more cores are engaged. Higher scores are better.

3DMark CPU Profile Dell Pro Precision 7 16 Dell Pro Precision 5 16s Intel Dell Pro Precision 5 16s AMD Lenovo ThinkPad P14s Gen 7
Max Threads 10,557 10,748 9,267 10,500
8 Threads 5,996 6,818 6,573 6,550
4 Threads 4,261 4,483 4,238 4,219
1 Thread 1,185 1,210 1,178 1,165


The three Intel systems finish within about 2% of each other at max threads, with the 7 16 second at 10,557. The eight-thread result is the outlier, with 5,996 the lowest in the group by a clear margin, even behind the ThinkPad. Single-thread is a four-way tie inside 4%.

3DMark Storage and Blackmagic Disk Speed Test

3DMark Storage measures how an SSD performs during gaming-related tasks such as loading games, installing software, saving progress, and moving game files. Blackmagic Disk Speed Test measures an SSD’s sequential read and write speeds using large media files. Higher is better in both.

Storage Dell Pro Precision 7 16 Dell Pro Precision 5 16s Intel Dell Pro Precision 5 16s AMD Lenovo ThinkPad P14s Gen 7
3DMark Storage 2,189 2,804 2,325 3,094
Blackmagic Write (MB/s) 7,387.8 7,660.2 5,070.5 8,262.3
Blackmagic Read (MB/s) 6,776.2 8,418.1 5,071.2 8,511.5


On paper, the RAID 0 array does not deliver what the configuration implies. 3DMark Storage returns 2,189, the lowest of the four comparison systems and well behind the ThinkPad’s single drive at 3,094, and SPECworkstation independently puts Storage at 1.30, second lowest. The sequential numbers are healthier in absolute terms, with Blackmagic writes of 7,387.8 MB/s and reads of 6,776.2 MB/s, though both still trail the single-drive 5 16s Intel and ThinkPad. Those results are consistent with how striping behaves rather than a sign of a faulty array. Lightly threaded storage tests split a single queue across two drives, which adds overhead without adding parallelism, and RAID 0’s benefits only appear as demand climbs. We verified that the array is configured and performing as intended.

As always, we tested the system as it shipped, and this one shipped in RAID 0, which is a somewhat unusual factory choice. Buyers are not locked into it. The two Gen5 drives can be split into separate OS and data volumes, mirrored in RAID 1 for redundancy, or simply run as independent drives, and several of those layouts may net better storage performance in scenarios like the ones tested here. The catch is that moving away from the factory RAID 0 means reinstalling the operating system, so the storage layout is worth deciding at deployment time rather than after the machine is in service.

Blackmagic RAW Speed Test

The Blackmagic RAW Speed Test measures how many frames per second a system can decode Blackmagic RAW video on the CPU and on the GPU. We quote the 8K results at 12:1 compression, and higher is better.

Blackmagic RAW Speed Test Dell Pro Precision 7 16 (RTX PRO 3000) Dell Pro Precision 5 16s Intel (Arc Pro B390) Dell Pro Precision 5 16s AMD (Radeon 890M) Lenovo ThinkPad P14s Gen 7 (RTX PRO 1000)
8K 12:1 CPU (fps) 77 77 74 77
8K 12:1 GPU (fps) 137 87 49 96


CPU decode is identical across the three Intel systems at 77fps. The GPU path is where the card shows up, reaching 137fps, 57% ahead of the Arc Pro B390 and 43% ahead of the RTX PRO 1000.

Topaz Video AI

The Topaz Video AI benchmark measures AI video upscaling and frame-interpolation performance in frames per second across the application’s enhancement models, run here at 1080p input, where higher is better. The 16X Slowmo Aion model failed to complete on our review unit and on the 5 16s Intel, while the 5 16s AMD ran it without issue.

Topaz Video AI (fps) Dell Pro Precision 7 16 (RTX PRO 3000) Dell Pro Precision 5 16s Intel (Arc Pro B390) Dell Pro Precision 5 16s AMD (Radeon 890M) Lenovo ThinkPad P14s Gen 7 (RTX PRO 1000)
Artemis 1X / 2X / 4X 12.38 / 8.94 / 3.15 6.24 / 5.21 / 1.90 3.72 / 2.21 / 0.78 5.17 / 3.19 / 1.12
Iris 1X / 2X / 4X 13.06 / 7.49 / 2.32 5.29 / 3.19 / 0.96 4.91 / 2.72 / 0.92 5.91 / 3.12 / 1.01
Proteus 1X / 2X / 4X 12.06 / 8.60 / 2.66 6.45 / 6.09 / 2.47 3.99 / 2.70 / 1.18 4.78 / 3.14 / 1.05
Gaia 1X / 2X / 4X 3.73 / 2.66 / 2.02 3.30 / 2.26 / 1.51 1.87 / 1.34 / 0.96 1.62 / 1.13 / 0.79
Nyx 1X / 2X 3.59 / 3.08 1.56 / 1.57 1.87 / 1.53 2.40 / 2.09
Hyperion HDR 1X 15.58 3.23 11.48 14.56
4X Slowmo Apollo / APFast 18.04 / 30.60 8.48 / 22.00 6.08 / 17.59 10.39 / 29.94
16X Slowmo Aion DNF DNF 9.05 N/A


The 7 16 leads every model it completed, roughly doubling the 5 16s Intel on Artemis and Iris and better than doubling the ThinkPad. The one gap in the row is the 16X Slowmo Aion model, which did not finish (the same failure we recorded on the 5 16s Intel).

UL Procyon AI Text Generation

The Procyon AI Text Generation Benchmark streamlines LLM performance testing by providing a concise, consistent evaluation method. It enables repeated testing across four local models (Phi, Mistral, Llama3, and Llama2) while minimizing the complexity of large models and the number of variables. Developed with AI hardware leaders, it optimizes the use of local AI accelerators to deliver more reliable, efficient performance assessments. All four systems ran the models through ONNX Runtime with DirectML on their GPUs.

Procyon AI Text Generation Dell Pro Precision 7 16 (RTX PRO 3000) Dell Pro Precision 5 16s Intel (Arc Pro B390) Dell Pro Precision 5 16s AMD (Radeon 890M) Lenovo ThinkPad P14s Gen 7 (RTX PRO 1000)
Phi 2,244 893 434 1,618
Mistral 2,062 646 403 1,397
Llama3 1,859 669 357 1,252
Llama2 1,990 750 390 DNF


Local LLM inference is the widest AI margin in the review. The 7 16 leads every model, 2,244 on Phi against 893 for the Arc Pro B390, and it still holds a 39% lead over the ThinkPad on the same test. The ThinkPad did not complete Llama2.

UL Procyon AI Computer Vision

The Procyon AI Computer Vision Benchmark measures AI inference performance across CPUs, GPUs, and dedicated accelerators using a range of neural networks, evaluating tasks such as image classification, object detection, segmentation, and super-resolution with models including MobileNet V3, Inception V4, YOLO V3, DeepLab V3, Real ESRGAN, and ResNet 50. The WinML runs use float32 on CPU and GPU, giving a like-for-like view across vendors. We also run the newer Computer Vision 2 suite through each vendor’s native path: OpenVINO in int8 on the Intel NPUs and fp16 on their iGPUs, TensorRT in fp16 on the RTX PRO 3000, and Ryzen AI on the AMD NPU; those results are listed separately since precision and runtime differ by platform. Higher scores are better.

Procyon AI Computer Vision (WinML) Dell Pro Precision 7 16 Dell Pro Precision 5 16s Intel Dell Pro Precision 5 16s AMD Lenovo ThinkPad P14s Gen 7
CPU 122 143 114 134
GPU 553 410 245 426


Procyon AI Computer Vision 2 (native runtimes) Dell Pro Precision 7 16 Dell Pro Precision 5 16s Intel Dell Pro Precision 5 16s AMD
NPU (int8) 1,614 1,630 1,189
iGPU (fp16) 837 1,529 N/A
dGPU (TensorRT fp16) 3,470 N/A N/A


The WinML float32 path puts the 7 16 last on CPU at 122 and first on GPU at 553, 35% ahead of the Arc Pro B390 and 30% ahead of the ThinkPad. Running each vendor native runtime instead, the discrete card more than doubles anything the integrated silicon manages at 3,470 through TensorRT. The NPU result of 1,614 is a virtual tie with the 5 16s Intel, which is expected since both use the same 50 TOPS engine, and the 837 on integrated graphics reflects the smaller iGPU in the 386H rather than the Arc Pro B390.

UL Procyon AI Image Generation

The Procyon AI Image Generation Benchmark provides a consistent method for measuring AI inference performance from low-power NPUs to high-end GPUs, with three tests: Stable Diffusion XL FP16 for high-end GPUs, Stable Diffusion 1.5 FP16 for moderately powerful GPUs, and Stable Diffusion 1.5 INT8 for low-power devices. The benchmark uses the optimal inference path for each platform: OpenVINO on Intel systems, the AMD-optimized DirectML pipeline on Radeon GPUs, and TensorRT on NVIDIA GPUs. The INT8 test uses Intel’s quantized SD 1.5 model where supported; the AMD pipeline does not offer a comparable quantized run. Our review unit runs this suite through TensorRT on the RTX PRO 3000. New with this round, we also ran the INT8 workload on the Intel NPU.

Procyon AI Image Generation Dell Pro Precision 7 16 (RTX PRO 3000) Dell Pro Precision 5 16s Intel (Arc Pro B390) Dell Pro Precision 5 16s AMD (Radeon 890M) Lenovo ThinkPad P14s Gen 7 (RTX PRO 1000)
SD 1.5 FP16 1,424 638 316 943
SD 1.5 INT8 17,287 7,778 2,855 12,403
SDXL FP16 1,273 738 200 765
SD 1.5 INT8 NPU 2,870 2,881 N/A N/A


TensorRT leads every row. The INT8 workload returns 17,287 against 12,403 for the ThinkPad and 7,778 for the Arc Pro B390, and SDXL comes in at 1,273, where the two integrated systems sit at 738 and 200. The NPU score of 2,870 is effectively identical to the 5 16s Intel score of 2,881, again, the same Intel accelerator doing the same work.

SPECviewperf 15

SPECviewperf 15 measures graphics performance using viewsets derived from professional applications in CAD, 3D modeling, rendering, engineering, and medical visualization. Our review unit ran the suite at its native 4K and produced scores in all 11 viewsets. The comparison systems ran at 1080p, which is not comparable to a 4K run, so this table includes only the review unit.

SPECviewperf 15 (4K) Dell Pro Precision 7 16 (RTX PRO 3000)
3dsmax-08 32.38
blender-01 30.20
catia-07 42.71
creo-04 114.70
energy-04 26.28
enscape-01 11.65
maya-07 71.18
medical-04 50.48
snx-05 82.27
solidworks-08 63.99
unreal_engine-01 50.42


Run at the panel native 4K, the 7 16 completed all 11 viewsets. creo-04 at 114.70 and snx-05 at 82.27 are the strongest results, and enscape-01 at 11.65 is the weakest. Because the comparison systems ran these viewsets at 1080p, these figures should not be read against the other tables in this review.

SPECworkstation 4

SPECworkstation 4 measures workstation performance across CPU, graphics, storage, AI, product design, engineering, financial services, and other professional workloads, using real applications grouped into seven industry verticals. Higher scores are better, and N/A means the system did not complete every workload required for that category. The standalone 7-Zip workload inside SPECworkstation failed on our review unit and on the 5 16s AMD, which suppresses the CPU subsystem and Productivity and Development scores for both; reruns reproduced the same failure on each, and our separate 7-Zip section above covers that ground.

SPECworkstation 4 Dell Pro Precision 7 16 Dell Pro Precision 5 16s Intel Dell Pro Precision 5 16s AMD Lenovo ThinkPad P14s Gen 7
Hardware Subsystems
Graphics 6.54 2.67 2.65 4.51
Accelerator 3.88 2.25 2.31 3.26
Storage 1.30 1.80 1.00 1.67
CPU N/A 1.34 N/A 1.35
Industry Verticals
AI & Machine Learning 1.76 1.47 1.45 1.65
Energy 1.87 1.55 1.38 1.69
Financial Services 1.03 0.94 1.29 0.96
Life Sciences 2.03 1.84 1.47 1.82
Media & Entertainment 1.87 1.60 1.48 1.81
Product Design 1.87 1.75 1.41 1.89
Productivity & Development N/A 1.35 N/A 1.34


The Graphics subsystem score of 6.54 is 2.4 times that of the integrated system and 45% higher than the ThinkPad, while the 7 16 leads four of the six industry verticals it completed. Product Design goes to the ThinkPad by a narrow 1.89 to 1.87 margin, while the AMD system leads Financial Services. The CPU and Productivity and Development scores are N/A because the standalone 7-Zip workload failed, the same failure recorded on the 5 16s AMD. Storage finished at 1.30, the second-lowest result of the group, which also follows the relatively weak storage performance recorded in 3DMark Storage.

Conclusion

The Dell Pro Precision 7 16 is built around a very different set of priorities than the Pro Precision 5 16s Intel, and the RTX PRO 3000 is the reason to spend the extra money. GPU rendering was where the gap became especially large, with the 7 16 producing 1,555.53 samples per minute in Blender Monster compared with 572.84 from the Arc Pro B390, with similarly large gains in Junkshop and Classroom. V-Ray, local AI text generation, Topaz Video AI, and Blackmagic RAW also benefited heavily from the discrete GPU, including 137 fps in the BRAW GPU test compared with 87 fps from the 5 16s Intel. CPU performance does not provide the same advantage; however, the less expensive 5 16s Intel was as fast or faster in several processor-heavy tests, including Geekbench, Cinebench, and y-cruncher.

Dell Pro Precision 7 16 closed at an angle, showing the Magnetite lid finish

The additional hardware also comes with a substantial battery penalty, even with the 7 16 carrying a much larger 96Wh brick. Its 11 hours and 43 minutes in the Modern Office test is less than half the 24 hours and 43 minutes delivered by the 5 16s Intel, which is a major difference for anyone regularly working away from a desk. There are some excellent upgrades beyond the RTX PRO 3000, including the 3840 x 2400 Tandem OLED with 120Hz VRR, the large haptic trackpad, two Thunderbolt 5 ports, a full-size SD card reader, and room for two Gen5 SSDs. Dell also keeps the battery, SSDs, and cooling fans accessible once the bottom cover is removed, although the 64GB of LPDDR5x memory is soldered and cannot be upgraded later. Our RAID 0 configuration was also light in storage testing, as the two Gen5 drives did not outperform the single-drive systems, contrary to what their configuration would suggest.

Pricing ultimately makes the choice between these two systems fairly easy. Our exact dual-drive configuration works out to approximately $8,245 based on the hardware Dell shipped, putting the 7 16 roughly $1,900 to $2,300 above the 5 16s Intel, depending on how the configurations are compared. Engineers, 3D artists, visualization professionals, video editors, and users running GPU-accelerated local AI workloads can see enormous performance gains from the RTX PRO 3000, and those workloads give the added cost a valuable purpose. Users spending most of their time in CPU-heavy applications, development work, office workloads, or anything that does not benefit substantially from NVIDIA graphics should look closely at the 5 16s Intel instead. It offers similar or better CPU performance, more than twice the battery life, and a considerably lower price, while the Pro Precision 7 16 earns its premium specifically for users who can put its much faster GPU to work.

For configuration options and current pricing, visit the Dell Pro Precision 7 Series 16 product page.

Leaderboard: The Dell Pro Precision 7 16 Intel ranks #19 on our Laptop Battery Life Leaderboard and appears in the field on our Best Mobile Workstations and Best Laptops for Local AI pages.

The post Dell Pro Precision 7 16 Intel Review: RTX PRO 3000 Blackwell in a Tandem OLED Workstation appeared first on StorageReview.com.

Dell Pro Precision 5 14s AMD Review: 24 Threads in a 3.08-Pound Workstation

13 August 2026 at 20:43

The Dell Pro Precision 5 14s AMD is the Ryzen half of Dell’s newest 14-inch mobile workstation. Our review unit runs the Ryzen AI 9 HX PRO 475, a 12-core, 24-thread processor with a 60 TOPS NPU, alongside Radeon 890M integrated graphics, 64GB of LPDDR5x memory, a 1TB Gen4 SSD, and a 14-inch QHD+ display running at 120Hz. It is the same chassis Dell sells with Intel silicon, but the two configurations diverge more than the shared shell suggests.

Dell Pro Precision 5 14s AMD open at a three-quarter angle with the QHD+ display on

The headline for this one is threads. Where most 14-inch workstations in this class ship 16 cores without simultaneous multithreading, the HX PRO 475 brings 24 threads to bear, and it shows up everywhere rendering and compression workloads scale. The panel is the other differentiator: this configuration gets a 2560 x 1600 120Hz screen, whereas the Intel build we tested shipped a 1920 x 1200 panel with no high-refresh option listed.

The Dell Pro Precision 5 14s AMD starts at $2,253, and our review configuration prices out at $5,404 as a single-unit purchase on Dell.com, with the 16GB to 64GB LPDDR5x jump being the largest line item at $1,700. As with all commercial systems, most business buyers purchase through an account team at volume discounts, so the web price is best viewed as a reference ceiling rather than a typical fleet cost. The system is available now on the Dell Pro Precision 5 Series 14S product page.

Dell Pro Precision 5 14s AMD Specifications

Specification Dell Pro Precision 5 14s AMD (PW514265)
Processor AMD Ryzen AI 9 HX PRO 475 (12 cores/24 threads, up to 5.2GHz, 36MB cache, 60 TOPS NPU)
Graphics AMD Radeon 890M (integrated)
Memory 64GB LPDDR5x, 8533 MT/s rated, dual-channel, non-ECC
Storage 1TB SSD, PCIe Gen4
Display 14-inch QHD+/WQXGA (2560 x 1600), non-touch, 120Hz, 500 nits, IPS, 100% sRGB, ComfortView Plus, anti-glare
Camera 8MP HDR RGB + IR with User Presence Detection
Wireless MediaTek Wi-Fi 7 MT7925, Bluetooth 5.4
Keyboard English US mini-LED backlit with Copilot key
Security Fingerprint reader, smart card reader, ControlVault 3+, TPM 2.0, FIPS 140-3 certified, post-quantum cryptography, chassis intrusion detection
Battery 3-cell, 70Wh Long Lifecycle, ExpressCharge and ExpressCharge Boost
Power 100W USB-C adapter
Operating System Windows 11 Pro (Copilot+ PC)
Chassis Aluminum alloy
Certifications ENERGY STAR, EPEAT Gold with Climate+
Warranty 36 months Basic Onsite Service after Remote Diagnosis
Price $2,253 starting; $5,404 as tested (Dell.com single-unit)

Build and Design

The Dell Pro 5 14 AMD arrives in a dark gray aluminum-alloy chassis with a sleek matte finish and a subtle Dell logo centered on the lid. Measuring just 0.75 inches thick and weighing approximately 3.08 pounds, it offers a portable design without sacrificing performance. Processor options range from the AMD Ryzen AI 5 PRO to the Ryzen AI 9 HX PRO, paired with integrated AMD Radeon 840M through 890M graphics, depending on the configuration. Our review unit features the Ryzen AI 9 HX PRO 475 processor with integrated Radeon 890M graphics.

Dell Pro Precision 5 14s AMD rear three-quarter view showing the lid and left side ports

The unit features a 14-inch non-touch QHD+ IPS display with a 120Hz refresh rate and a rated 35ms response time. Its 500-nit brightness and anti-glare finish produce a bright, easily visible image under a variety of lighting conditions, while 100% sRGB coverage provides vibrant and accurate colors. AMD FreeSync support helps deliver smoother motion, and Dell ComfortView Plus reduces potentially harmful blue-light emissions without significantly affecting color accuracy.

Dell Pro Precision 5 14s AMD closed showing the aluminum lid and Dell logo

The keyboard deck features a mini-LED backlit keyboard with a dedicated Copilot key. As expected for a compact 14-inch system, there is no numeric keypad, leaving enough room for a comfortable, well-spaced layout. A square power button with an integrated fingerprint reader sits at the upper-right corner, providing convenient biometric authentication.

Dell Pro Precision 5 14s AMD keyboard deck with mini-LED backlit keys and fingerprint reader

Below the keyboard is a large, centered glass touchpad that offers plenty of room for navigation and multitouch gestures.

Dell Pro Precision 5 14s AMD trackpad and palm rest with Copilot key

The right side of the Dell Pro 5 includes a 1GbE RJ-45 port, a USB 3.2 Gen 1 Type-A port, and a universal audio jack. It also features a wedge-shaped lock slot for physically securing the laptop, along with optional eSIM support for mobile broadband connectivity.

Dell Pro Precision 5 14s AMD right side ports with headset jack, USB-A, RJ45 Ethernet, and lock slot

The left side provides the remainder of the laptop’s connectivity, including two Thunderbolt 4 USB-C ports with Power Delivery and DisplayPort 1.4 support. It also includes a USB 3.2 Gen 1 Type-A port with PowerShare and a full-size HDMI 2.1 output. An optional Smart Card reader is available for organizations that require card-based authentication.

Dell Pro Precision 5 14s AMD left side ports with HDMI, USB-A, and two USB-C

Above the display is an 8MP HDR RGB+IR camera with user-presence detection, enabling high-resolution video conferencing, Windows Hello facial authentication, and presence-aware security features. Dual-array microphones help capture clear audio during calls, while an integrated sliding privacy shutter provides a simple physical way to block the camera when it is not in use.

Dell Pro Precision 5 14s AMD 8MP IR webcam with physical privacy shutter

Removing the bottom panel provides a clear view of the Dell Pro 5’s internal layout. The cooling solution uses a single fan and heat-pipe assembly to manage the processor’s heat, while two 2W speakers are positioned along the lower corners of the chassis. Powering the system is a three-cell, 70Wh lithium-ion battery pack that occupies much of the lower portion of the unit.

Wireless connectivity is handled by a replaceable MediaTek Wi-Fi 7 MT7925 card supporting 2×2 802.11be MIMO and Bluetooth 5.4. Our configuration also includes a replaceable 1TB Kioxia TLC PCIe Gen4 SSD. The system memory is soldered to the motherboard and cannot be upgraded by the user, making the initial configuration an important purchasing decision. Our review unit shipped with 64GB of dual-channel LPDDR5 memory operating at 8,533MT/s.

Dell Pro Precision 5 14s AMD internals with 70Wh battery, single blower fan, and M.2 SSD slot

The bottom cover features a generously sized ventilation section that provides the cooling system with a consistent supply of fresh air. Long rubber feet run along the front and rear edges, slightly elevating the laptop to improve airflow while keeping it stable and preventing it from sliding across a desk.

Dell Pro Precision 5 14s AMD underside with Pro Precision branding and intake grille

Dell Pro Precision 5 14s AMD Performance

Our review unit runs the Ryzen AI 9 HX PRO 475 with Radeon 890M graphics, 64GB of LPDDR5x, and a 1TB Gen4 SSD on Windows 11 Pro, with benchmarks tested in the Best Performance power mode. For battery life testing, we configure systems into Balanced power mode and set the screen brightness to 50%. One note on the memory: Dell rates this configuration at 8533 MT/s, but Task Manager, the system BIOS, and our SPEC runs all report 8000 MT/s on the review unit.

For comparables, we included the Intel version of the same machine, the Dell Pro Precision 5 14s Intel (Core Ultra X9 388H, Arc Pro B390, 64GB), the 16-inch Dell Pro Precision 5 16s AMD (Ryzen AI 9 HX PRO 475, Radeon 890M, 64GB), and the previous-generation Dell Pro 5 16 AMD (Ryzen AI 9 HX PRO 470, Radeon 890M, 64GB) as the generational reference. There is no 14-inch AMD system in the prior Pro 5 lineup, so both AMD comparisons are 16-inch machines; the comparisons here are about silicon and platform rather than chassis size.

PCMark 10

PCMark 10 measures general system performance across everyday work such as web browsing, video conferencing, spreadsheets, writing, photo editing, and rendering. The overall score is supported by Essentials, Productivity, and Digital Content Creation subscores that show where a system’s strengths sit. Higher scores are better.

PCMark 10 Dell Pro Precision 5 14s AMD Dell Pro Precision 5 14s Intel Dell Pro Precision 5 16s AMD Dell Pro 5 16 AMD
Overall Score 8,762 10,019 8,627 8,268
Essentials 11,442 12,188 10,744 10,870
Productivity 14,272 15,827 14,574 14,322
Digital Content Creation 11,178 14,147 11,127 9,852

The review unit scored 8,762 overall, a 6% gain on the previous-generation Pro 5 16 AMD and effectively a tie with its own 16-inch sibling. The Intel twin is 14% clear of it here, with the gap concentrated in Digital Content Creation, where Arc Pro B390 graphics do most of the work.

PCMark 10 Modern Office Battery

The PCMark 10 Modern Office battery test repeatedly runs common office tasks until the battery reaches the test’s cutoff point, in Balanced mode at 50% display brightness. This is a rundown of the whole system rather than a synthetic idle drain, so it tracks closely with what a full day of productivity work does to the battery. Longer runtimes are better.

Modern Office Battery Dell Pro Precision 5 14s AMD Dell Pro Precision 5 14s Intel Dell Pro Precision 5 16s AMD Dell Pro 5 16 AMD
Runtime (higher is better) 14 hours 26 minutes 23 hours 50 minutes 15 hours 5 minutes 15 hours 22 minutes

This is the review unit’s weakest showing. At 14 hours and 26 minutes, it trails the previous-generation Pro 5 16 AMD by nearly an hour, gives up 39 minutes to its own 16-inch sibling, and concedes more than nine hours to the Intel version of the same laptop. A 120Hz QHD+ panel accounts for part of that against the Intel unit’s lower-resolution screen, but not nine hours of it. Buyers who value all-day unplugged runtime should look hard at the Intel build.

Geekbench 6

Geekbench 6 measures processor performance using a mix of common tasks, with separate scores for single-core and multi-core workloads, plus GPU compute scores through OpenCL and Vulkan. Higher scores are better.

Geekbench 6 Dell Pro Precision 5 14s AMD (Radeon 890M) Dell Pro Precision 5 14s Intel (Arc Pro B390) Dell Pro Precision 5 16s AMD (Radeon 890M) Dell Pro 5 16 AMD (Radeon 890M)
CPU Single-Core 2,831 3,010 2,854 2,989
CPU Multi-Core 14,611 17,396 14,169 14,348
GPU OpenCL 36,322 56,745 37,520 33,449
GPU Vulkan 49,868 55,581 53,969 48,348

Geekbench 6 is the one CPU test in this review where the Intel twin’s 16 cores beat 24 threads outright, taking multi-core by 19%. The generational gain over the HX PRO 470 is modest at 2% multi-core, and single-core goes to the older chip. On GPU compute, the Radeon 890M is roughly two-thirds of the Arc Pro B390 in OpenCL and close to 90% in Vulkan.

Geekbench 7

Geekbench 7 joins the suite alongside Geekbench 6 as comparison data builds. Its CPU scores are calibrated against a baseline of 2,500, set by the AMD Ryzen 7700, while GPU scores are calibrated against a baseline of 100,000, set by the NVIDIA GeForce RTX 4060. Higher scores are better, and double the score indicates double the performance. Because Geekbench 7 uses new workloads and new baselines, its scores are not comparable to Geekbench 6 results.

Geekbench 7 Dell Pro Precision 5 14s AMD (Radeon 890M) Dell Pro Precision 5 14s Intel (Arc Pro B390) Dell Pro Precision 5 16s AMD (Radeon 890M) Dell Pro 5 16 AMD (Radeon 890M)
CPU Single-Core 2,571 2,702 2,659 2,602
CPU Multi-Core 15,514 18,788 16,641 14,860
GPU OpenCL 31,423 54,854 31,874 29,645
GPU Vulkan * 46,906 * 14,451

*Both Precision AMD units failed workload validation in the Geekbench 7 Vulkan run, which assigns a score of zero to the affected subtest. We traced it to the fluid simulation workload and have discarded both results pending clean runs.

The newer suite tells the same story as Geekbench 6, with the Intel twin 21% ahead in multi-core. Worth noting the 16-inch AMD sibling lands 7% above this unit on the same silicon, the clearest thermal-headroom signal in the review.

Cinebench 2026

Cinebench 2026 is the current release in the Cinebench line and the only version we report. It tests CPU and GPU performance using Maxon’s Redshift render engine. It is built on the latest Cinema 4D 2026 code and is designed to show whether a machine is stable under high CPU load, whether a notebook’s cooling can sustain longer render tasks, and how it handles demanding real-world 3D work. Because code and compiler changes accelerated scene rendering, Cinebench 2026 scores use an adjusted range and should not be compared to scores from previous Cinebench versions. Its GPU test supports current AMD and NVIDIA hardware but does not yet run on Intel integrated graphics, and the Dell Pro 5 16 AMD has not completed a GPU run.

Cinebench 2026 Dell Pro Precision 5 14s AMD Dell Pro Precision 5 14s Intel Dell Pro Precision 5 16s AMD Dell Pro 5 16 AMD
CPU Single Thread 466 513 471 485
CPU Multiple Threads 4,230 4,513 4,767 4,407
GPU 5,313 N/A 5,667 N/A

The Radeon 890 M’s ability to run the GPU test at all is a practical advantage over the Arc Pro B390 here, since Cinebench 2026 does not yet support Intel integrated graphics. On the CPU side, the 16-inch AMD sibling pulls 13% ahead of the review unit, again pointing to sustained-load headroom rather than silicon differences.

7-Zip Compression

The built-in 7-Zip benchmark measures how quickly the processor can compress and decompress data using multiple threads, run with a 128MB dictionary across ten passes. Decompression tends to scale with thread count, while compression leans on memory latency, so the two halves often tell different stories. Higher GIPS scores are better.

7-Zip 24.09 (GIPS) Dell Pro Precision 5 14s AMD Dell Pro Precision 5 14s Intel Dell Pro Precision 5 16s AMD Dell Pro 5 16 AMD
Compressing 89.099 92.836 85.627 92.443
Decompressing 117.545 93.089 117.863 115.362
Total Rating 103.322 92.963 101.745 103.903

Decompression scales almost perfectly with thread count, and all three 24-thread AMD systems land near 116 GIPS, while the 16-thread Intel unit manages 93. That carries the total rating: 103.322 for the review unit against 92.963 for the Intel twin, an 11% win. Compression, which leans more on memory latency, goes the other way.

y-cruncher

y-cruncher measures how quickly the processor can calculate large numbers of digits of Pi, placing a heavy load on the CPU and memory subsystem. At the same time, the BBP runs to extract hexadecimal digits of Pi. Results are in seconds, so lower times are better. Neither Pro Precision AMD unit could complete the 5-billion or 10-billion digit runs, because the memory these platforms reserve for the integrated GPU leaves less available than those problem sizes require; the previous-generation Pro 5 16 AMD completed 5 billion but not 10 billion.

y-cruncher (seconds, lower is better) Dell Pro Precision 5 14s AMD Dell Pro Precision 5 14s Intel Dell Pro Precision 5 16s AMD Dell Pro 5 16 AMD
Pi 1B 24.648 28.404 22.840 25.160
Pi 2.5B 71.084 83.968 64.242 73.320
Pi 5B N/A 190.356 N/A 163.768
Pi 10B N/A 417.224 N/A N/A
Pi BBP 1B 1.104 1.684 1.100 1.249
Pi BBP 10B 14.333 20.028 12.277 14.141
Pi BBP 100B 166.762 241.409 140.284 161.401

At the sizes it can run, the review unit is quicker than the Intel twin across the board, finishing Pi to 2.5 billion digits 15% faster and the 100 billion BBP extraction 31% faster. The asterisk is that the Intel machine finishes the two largest runs at all, which matters for anyone whose workloads scale past what the shared memory pool allows.

Blender

The Blender benchmark measures rendering performance using three different 3D scenes: Monster, Junkshop, and Classroom. Results are reported in samples per minute, so higher scores are better, and we test on both the CPU and GPU. Scores are not comparable across Blender versions, so we report the current 5.2 release here.

Blender 5.2 (samples/min) Dell Pro Precision 5 14s AMD (Radeon 890M) Dell Pro Precision 5 14s Intel (Arc Pro B390) Dell Pro Precision 5 16s AMD (Radeon 890M) Dell Pro 5 16 AMD (Radeon 890M)
GPU
Monster 124.50 567.52 123.00 118.77
Junkshop 101.06 463.30 101.21 95.75
Classroom 82.95 417.38 82.84 78.42
CPU
Monster 127.02 133.46 130.86 127.45
Junkshop 95.84 94.27 99.74 98.89
Classroom 71.63 64.26 74.18 69.52

Blender is the clearest illustration of the tradeoff in this review. The Radeon 890M renders Monster at 124.50 samples per minute against 567.52 for the Arc Pro B390, more than four and a half times faster on the Intel twin. CPU rendering runs the other direction but by far smaller margins, with the review unit taking Junkshop and Classroom from the Intel twin on thread count. Against the previous generation, the GPU gain is 5%, so the 890M in this platform performs essentially as it did last round.

LuxMark

LuxMark measures GPU compute performance by rendering complex scenes through OpenCL, based on LuxCoreRender. We run the Food and Hall scenes on all available OpenCL devices in each system, so the GPU listed in each column header did the rendering. Higher scores are better.

LuxMark v4 Dell Pro Precision 5 14s AMD (Radeon 890M) Dell Pro Precision 5 14s Intel (Arc Pro B390) Dell Pro Precision 5 16s AMD (Radeon 890M) Dell Pro 5 16 AMD (Radeon 890M)
Hall 2,077 3,494 2,058 2,125
Food 1,041 1,705 1,034 982

The Arc Pro B390 is 68% faster in Hall and 64% faster in Food. Against its own predecessor, the review unit is flat in Hall and 6% up in Food, which matches the Blender picture: this is the same GPU generation, not a step forward.

V-Ray

Chaos V-Ray measures ray-traced rendering throughput, reported in vpaths, where higher is better. We run the CUDA-compatible engine on every system so results remain comparable to notebooks with discrete graphics; on systems without a discrete GPU, that path executes on the integrated graphics, even though V-Ray reports the processor name in its device field.

V-Ray GPU (vpaths) Dell Pro Precision 5 14s AMD (Radeon 890M) Dell Pro Precision 5 14s Intel (Arc Pro B390) Dell Pro Precision 5 16s AMD (Radeon 890M) Dell Pro 5 16 AMD (Radeon 890M)
CUDA Engine 897 890 1,039 861

The four systems land within 20% of each other, and the review unit edges the Intel twin by less than 1%. That tight grouping is consistent with what we saw across the Precision family. This compatibility path leans on the CPU and memory subsystem as much as the GPU, so it does not separate these platforms the way LuxMark and Blender do.

3DMark CPU Profile

The 3DMark CPU Profile benchmark measures CPU performance at fixed thread counts, from a single thread up to the maximum available, showing how performance scales as more cores are engaged. Higher scores are better.

3DMark CPU Profile Dell Pro Precision 5 14s AMD Dell Pro Precision 5 14s Intel Dell Pro Precision 5 16s AMD Dell Pro 5 16 AMD
Max Threads 8,778 10,277 9,267 6,696
8 Threads 6,270 6,441 6,573 5,153
4 Threads 4,047 4,176 4,238 3,513
1 Thread 1,160 1,174 1,178 1,176

All four are within 2% on one thread, and the field only separates as threads are added. The generational gain is the story here: 8,778 at max threads is 31% ahead of the previous-generation Pro 5 16 AMD, the largest generational CPU gain in this review. The Intel twin still leads at 10,277.

3DMark Storage and Blackmagic Disk Speed Test

3DMark Storage measures how an SSD performs during gaming-related tasks such as loading games, installing software, saving progress, and moving game files. Blackmagic Disk Speed Test measures an SSD’s sequential read and write speeds using large media files. Higher is better in both.

Storage Dell Pro Precision 5 14s AMD Dell Pro Precision 5 14s Intel Dell Pro Precision 5 16s AMD Dell Pro 5 16 AMD
3DMark Storage 2,424 3,093 2,325 2,477
Blackmagic Write (MB/s) 4,772.0 9,000.8 5,070.5 5,166.5
Blackmagic Read (MB/s) 4,900.4 9,809.2 5,071.2 4,758.0

Our review unit shipped with a Gen4 Kioxia BG7, and it shows: sequential throughput sits near 4.8 GB/s in both directions, whereas the Intel configuration’s Gen5 drive reads at nearly 9.8 GB/s, roughly twice as fast. Dell’s configurator lists this AMD build with Gen4 storage, while the Intel build is Gen5, so this is a platform difference rather than a bad sample, and it is worth attention from anyone moving large media files.

Blackmagic RAW Speed Test

The Blackmagic RAW Speed Test measures how many frames per second a system can decode Blackmagic RAW video on the CPU and on the GPU. We quote the 8K results at 12:1 compression, and higher is better.

Blackmagic RAW Speed Test Dell Pro Precision 5 14s AMD (Radeon 890M) Dell Pro Precision 5 14s Intel (Arc Pro B390) Dell Pro Precision 5 16s AMD (Radeon 890M) Dell Pro 5 16 AMD (Radeon 890M)
8K 12:1 CPU (fps) 77 79 74 72
8K 12:1 GPU (fps) 49 85 49 45

CPU decode is close across the group at 72 to 79 fps. The GPU path is where the Radeon 890M struggles, at 49 fps against 85 for the Arc Pro B390, which is the difference between falling short of real-time 8K playback and clearing it comfortably.

Topaz Video AI

The Topaz Video AI benchmark measures AI video upscaling and frame-interpolation performance in frames per second across the application’s enhancement models, run here at 1080p input, where higher is better. The previous-generation Pro 5 16 AMD was not tested with Topaz.

Topaz Video AI (fps) Dell Pro Precision 5 14s AMD (Radeon 890M) Dell Pro Precision 5 14s Intel (Arc Pro B390) Dell Pro Precision 5 16s AMD (Radeon 890M) Dell Pro 5 16 AMD (Radeon 890M)
Artemis 1X / 2X / 4X 3.75 / 2.24 / 0.79 6.22 / 5.28 / 1.89 3.72 / 2.21 / 0.78 3.25 / 1.94 / 0.68
Iris 1X / 2X / 4X 4.86 / 2.70 / 0.86 5.18 / 3.14 / 0.94 4.91 / 2.72 / 0.92 4.20 / 2.38 / 0.78
Proteus 1X / 2X / 4X 3.93 / 2.69 / 1.19 6.43 / 6.08 / 2.46 3.99 / 2.70 / 1.18 3.42 / 2.35 / 1.03
Gaia 1X / 2X / 4X 1.90 / 1.35 / 0.94 3.24 / 2.25 / 1.50 1.87 / 1.34 / 0.96 1.66 / 1.15 / 0.83
Nyx 1X / 2X 1.86 / 1.56 1.57 / 1.54 1.87 / 1.53 1.56 / 1.34
Hyperion HDR 1X 11.34 3.22 11.48 9.49
4X Slowmo Apollo / APFast 6.05 / 17.72 8.57 / 22.13 6.08 / 17.59 5.72 / 16.11
16X Slowmo Aion 9.13 DNF 9.05 7.98

The Intel twin wins most of the upscaling models, in some cases by wide margins. Still, the Radeon 890M owns the two places it matters for AMD buyers: Hyperion HDR at 11.34 fps against 3.22, more than triple, and the 16X Slowmo Aion model, which completed here and on the 16-inch sibling but failed on the Intel twin. If your pipeline depends on either of those, the AMD build is the safer machine.

UL Procyon AI Text Generation

The Procyon AI Text Generation Benchmark streamlines LLM performance testing by providing a concise, consistent evaluation method. It enables repeated testing across four local models, Phi, Mistral, Llama3, and Llama2, while minimizing the complexity of large models and the number of variables. Developed with AI hardware leaders, it optimizes the use of local AI accelerators to deliver more reliable, efficient performance assessments. All four systems ran the models through ONNX Runtime with DirectML on their GPUs.

Procyon AI Text Generation Dell Pro Precision 5 14s AMD (Radeon 890M) Dell Pro Precision 5 14s Intel (Arc Pro B390) Dell Pro Precision 5 16s AMD (Radeon 890M) Dell Pro 5 16 AMD (Radeon 890M)
Phi 424 887 434 371
Mistral 396 646 403 346
Llama3 352 674 357 306
Llama2 379 786 390 329

The Arc Pro B390 roughly doubles the Radeon 890M in Phi, Llama2, and Llama3, and leads Mistral by 63%, the widest AI gap in the review. Generationally, the review unit gains 14 to 15% on the HX PRO 470, and all four systems complete Llama2 thanks to their 64GB shared memory pools, which is the practical advantage integrated platforms hold over small-VRAM discrete cards for local inference.

UL Procyon AI Computer Vision

The Procyon AI Computer Vision Benchmark measures AI inference performance across CPUs, GPUs, and dedicated accelerators using a range of neural networks, evaluating tasks such as image classification, object detection, segmentation, and super-resolution with models including MobileNet V3, Inception V4, YOLO V3, DeepLab V3, Real ESRGAN, and ResNet 50. The WinML runs use float32 on CPU and GPU, giving a like-for-like view across vendors. We also run the newer Computer Vision 2 suite through each vendor’s native path, Ryzen AI in int8 on the AMD NPUs and OpenVINO on the Intel NPU and iGPU; those results are listed separately since precision and runtime differ by platform. Higher scores are better.

Procyon AI Computer Vision (WinML) Dell Pro Precision 5 14s AMD Dell Pro Precision 5 14s Intel Dell Pro Precision 5 16s AMD Dell Pro 5 16 AMD
CPU 106 141 114 91
GPU 247 404 245 214


Procyon AI Computer Vision 2 (native runtimes) Dell Pro Precision 5 14s AMD Dell Pro Precision 5 14s Intel Dell Pro Precision 5 16s AMD Dell Pro 5 16 AMD
NPU 1,176 1,647 1,189 611
iGPU N/A 1,517 N/A N/A

The generational NPU gain is the standout number: 1,176 against 611 for the HX PRO 470, nearly double, reflecting the move from a 50 TOPS to a 60 TOPS engine plus a newer Ryzen AI runtime. It is worth noting that the Intel twin still scores higher at 1,647 despite its 50 TOPS rating, a reminder that vendor TOPS figures do not translate directly into benchmark throughput.

UL Procyon AI Image Generation

The Procyon AI Image Generation Benchmark provides a consistent method for measuring AI inference performance from low-power NPUs to high-end GPUs, with three tests: Stable Diffusion XL FP16 for high-end GPUs, Stable Diffusion 1.5 FP16 for moderately powerful GPUs, and Stable Diffusion 1.5 INT8 for low-power devices. The benchmark uses the optimal inference path for each platform, meaning the AMD-optimized DirectML pipeline on the Radeon systems and OpenVINO on the Intel unit. The INT8 test runs on the NPU where a supported quantized model exists; the current Pro Precision AMD units do not yet have one available through Procyon, so those cells are blank pending a supported path.

Procyon AI Image Generation Dell Pro Precision 5 14s AMD (Radeon 890M) Dell Pro Precision 5 14s Intel (Arc Pro B390) Dell Pro Precision 5 16s AMD (Radeon 890M) Dell Pro 5 16 AMD (Radeon 890M)
SD 1.5 FP16 281 632 316 255
SDXL FP16 197 731 200 173
SD 1.5 INT8 (iGPU) N/A 7,873 N/A N/A
SD 1.5 INT8 (NPU) N/A 3,003 N/A 3,598

On the FP16 runs, the Arc Pro B390 is more than twice as fast in SD 1.5 and nearly four times as fast in SDXL, which is a real gap for anyone generating images locally. The interesting cell is the NPU row: the previous-generation Pro 5 16 AMD has a genuine quantized NPU running at 3,598 using AMD’s Ryzen AI path, ahead of the Intel twin’s 3,003, and we would expect this unit’s newer 60 TOPS NPU to beat it once Procyon exposes a supported quantized model for the platform.

SPECviewperf 15

SPECviewperf 15 measures graphics performance using viewsets derived from professional applications in CAD, 3D modeling, rendering, engineering, and medical visualization, replayed here at 1080p. Higher scores are better, although performance can vary considerably between applications and graphics architectures. The enscape-01 viewset failed to complete on the review unit across multiple runs, and catia-07 failed on the Intel twin.

SPECviewperf 15 (FHD) Dell Pro Precision 5 14s AMD (Radeon 890M) Dell Pro Precision 5 14s Intel (Arc Pro B390) Dell Pro Precision 5 16s AMD (Radeon 890M) Dell Pro 5 16 AMD (Radeon 890M)
3dsmax-08 26.30 19.51 26.23 23.21
blender-01 23.01 21.55 23.17 19.89
catia-07 22.70 DNF 22.70 20.16
creo-04 49.27 63.57 49.42 44.27
energy-04 29.51 38.07 29.69 25.39
enscape-01 DNF 14.92 8.45 8.02
maya-07 53.30 83.86 53.48 48.67
medical-04 73.42 69.41 73.31 65.45
snx-05 59.58 78.74 61.33 51.67
solidworks-08 36.66 33.38 36.40 33.12
unreal_engine-01 27.31 41.38 27.38 26.61

This table is more competitive than the raw GPU compute results suggest. The review unit beats the Intel twin in four of the nine viewsets, both completed, taking 3dsmax, blender, medical, and solidworks. At the same time, Intel’s certified driver advantage shows up in the CAD and engineering traces, where it leads by 29 to 57%. Against its own predecessor, the review unit gains in all ten viewsets it completed, by about 12% on average.

SPECworkstation 4

SPECworkstation 4 measures workstation performance across CPU, graphics, storage, AI, product design, engineering, financial services, and other professional workloads, using real applications grouped into seven industry verticals. Higher scores are better, and N/A means the system did not complete every workload required for that category.

SPECworkstation 4 Dell Pro Precision 5 14s AMD Dell Pro Precision 5 14s Intel Dell Pro Precision 5 16s AMD Dell Pro 5 16 AMD
Hardware Subsystems
CPU 1.15 N/A N/A 1.09
Graphics 2.57 2.70 2.65 2.36
Accelerator 2.22 2.29 2.31 N/A
Storage 0.93 1.70 1.00 0.89
Industry Verticals
AI & Machine Learning 1.38 1.45 1.45 1.37
Energy 1.28 1.67 1.38 1.24
Financial Services 1.07 0.93 1.29 0.98
Life Sciences 1.41 N/A 1.47 1.34
Media & Entertainment 1.39 1.53 1.48 N/A
Product Design 1.34 1.80 1.41 1.34
Productivity & Development 1.03 1.32 N/A 0.78

The review unit beats the Intel twin in Financial Services, where the 16-inch AMD sibling leads the group outright, and trails Intel in the graphics-weighted verticals, while its 0.93 Storage subsystem score tracks with the Gen4 drive.

Conclusion

The Dell Pro Precision 5 14s AMD packs substantial multi-threaded performance into a compact 3.08-pound chassis. Its Ryzen AI 9 HX PRO 475 delivered its strongest results in CPU-intensive workloads, beating the Intel version by 11% in the overall 7-Zip benchmark. It also completed every y-cruncher workload that fit within its available memory. Compared with the previous-generation AMD platform, the 31% improvement in the 3DMark CPU Profile and near doubling of NPU performance represent meaningful progress.

The trade-offs are equally clear. Radeon 890M graphics fall well behind the Intel model’s Arc Pro B390 in most GPU compute, rendering, and AI workloads. At the same time, the Gen4 Kioxia SSD provides roughly half the sequential throughput of the Intel configuration’s Gen5 drive. Battery life reached a respectable 14 hours and 26 minutes, but that remains more than nine hours behind the Intel version. The AMD system does have a few workload-specific advantages, including support for the Cinebench 2026 GPU test and successful completion of Topaz Video AI’s 16X Slowmo Aion model.

Dell Pro Precision 5 14s AMD side profile showing the full chassis and left side ports

Outside of performance, the AMD configuration benefits from an excellent 14-inch QHD+ 120Hz display, a durable aluminium-alloy chassis, strong port selection, Wi-Fi 7, and a comprehensive set of business security features. The soldered memory makes choosing the correct capacity upfront important, especially considering the steep $1,700 upgrade to 64GB in Dell’s online configurator.

Configurations on the Dell Store start at $2,253 and reach $5,404 as tested. The Dell Pro Precision 5 14s AMD carries a high single-unit price, but commercial customers will typically buy through negotiated volume agreements. It is best suited to mobile professionals whose workloads benefit from 24 CPU threads, ample shared memory, and a high-resolution display. Buyers prioritizing GPU acceleration, maximum battery life, or faster storage will find the Intel configuration more compelling, but for CPU-heavy workstation tasks in a highly portable form factor, the AMD version makes a strong case.

For configuration options and current pricing, visit the Dell Pro Precision 5 Series 14S product page.

Leaderboard: The Dell Pro Precision 5 14s AMD ranks #13 on our Laptop Battery Life Leaderboard at 14 hours 26 minutes.

The post Dell Pro Precision 5 14s AMD Review: 24 Threads in a 3.08-Pound Workstation appeared first on StorageReview.com.

CPS PCCOOLER reveals new workstation‑grade hardware for AI systems

12 August 2026 at 13:00

CPS PCCOOLER is expanding beyond traditional PC cooling and into professional computing, introducing a new range of coolers, cases and PSUs designed for AI workstations and servers. With more than 20 years of thermal engineering experience, the company is now targeting high‑density, sustained workloads that demand robust thermal and power delivery hardware.

AI workloads increasingly run on creator workstations, engineering systems, edge servers and on‑premises clusters rather than exclusively in large data centres. These environments place continuous strain on CPUs, GPUs and power supplies, requiring platforms built to manage significant heat output. CPS PCCOOLER’s new lineup leans in that direction, combining air and liquid cooling options, a high‑capacity workstation chassis and a 2500W power supply aimed at multi‑GPU systems.

The cooling lineup includes three products. The TR620M X is a compact dual‑tower air cooler standing just 115mm tall, using six heatpipes and a centrally mounted 100mm fan capable of reaching up to 5,000 rpm, making it suitable for compact workstations and 4U servers. The TS700D is a larger single‑tower cooler for high‑power workstations, featuring seven heatpipes and dual 120mm fans rated up to 3,000 rpm, with a reverse‑blade rear fan to optimise airflow. For liquid cooling, the LR480S offers a 480mm radiator paired with four high‑speed 120mm fans to handle sustained AI workloads. A more compact 360mm version, the LR360S, is also launching soon.

For system builders, the SR700 chassis supports HPTX motherboards, dual 480mm radiators, dual PSUs and extensive multi‑GPU configurations, with space for up to 30 case fans. Rounding out the lineup, the SU Series workstation PSU delivers up to 2500W capacity and includes up to four native PCIe 5.1 12V‑2×6 connectors, backed by Cybenetics Titanium efficiency certification.

KitGuru Says: CPS PCCOOLER will have more workstation-grade hardware coming in the future too, including new liquid cooling solutions for rack-mounted systems. 

The post CPS PCCOOLER reveals new workstation‑grade hardware for AI systems first appeared on KitGuru.

Luisuantech GP Spark Review: Nearly 10GB/s of Plug-and-Play Storage for the DGX Spark

12 August 2026 at 17:27
Luisuantech GP Spark stacked on top of the GIGABYTE DGX Spark in the StorageReview lab Luisuantech GP Spark stacked on top of the GIGABYTE DGX Spark in the StorageReview lab

When we reviewed the NVIDIA DGX Spark, storage was the platform’s clearest design flaw, and it is a form-factor problem before it is anything else. The Spark’s internal slots take short M.2 drives, the 2230 and 2242 class, where packaging wins, and capacity loses. The high-capacity end of the client SSD market lives in full-size 2280 drives, where 8TB models ship today, and the Spark simply has nowhere to put one. That leaves a machine built for serious AI work with a storage ceiling better suited to a thin-and-light laptop, and no internal path around it. The Luisuantech GP Spark is a solution for exactly that problem: a 0.58-liter, four-bay box for full-size M.2 drives that cables to the Spark’s 100GbE port, shows up as native NVMe devices with no drivers or formatting, and serves GPU Direct Storage traffic at close to line rate.

Luisuantech GP Spark front panel with perforated fascia and illuminated logo power button, lab racks behind

The pitch is simplicity with client-drive economics. The GP Spark’s four bays take ordinary M.2 2280 or 22110 NVMe SSDs, the form factors the Spark itself locks out, and presents them over NVMe-oF RDMA through a hardware offload engine on a dedicated chip. Luisuantech’s spec sheet validates drives up to 4TB today, 16TB per enclosure, though these are the same slots where 8TB client drives already ship, so the practical ceiling is a validation question rather than a mechanical one. There is no enterprise array here, no licensing, and no storage OS to learn. Plug a DAC or AOC cable between the GP Spark and the DGX Spark, run modprobe nvme-rdma on the Spark’s Ubuntu base, and the drives appear as /dev/nvme devices ready for GDS access.

Design and Build

The GP Spark is a 150mm x 150mm x 26mm box, a smaller footprint than the Spark itself, wrapped in a perforated metal chassis with a single power button that doubles as a status light: green for normal, red for fault. Power comes over USB-C PD from a 20V/5.4A external adapter, with the whole unit rated under 100W, including drives. The rear panel carries exactly three connectors: the USB-C power input, a USB-C factory debug port, and the QSFP28 100GbE data port, which accepts copper DACs or optical modules. Inside, a dedicated data processor and coprocessor handle the NVMe-oF offload, and the four M.2 bays sit under the top cover.

GP Spark rear panel with two USB-C ports, copper heatsink fins behind the vents, and the QSFP28 100GbE cage

The rear panel is all business: USB-C power and debug ports on the left, the QSFP28 cage on the right, and a row of copper fin stacks visible through the vents between them. Cooling is entirely passive.

GP Spark with top cover removed showing four KIOXIA XG8 client NVMe SSDs installed in the M.2 bays

Pop the top cover, and the four M.2 bays sit in a row, here populated with our KIOXIA XG8 test drives. The lid itself is the drive cooler: blue thermal pads on its underside couple each SSD to the finned heatsink that forms the top of the chassis, a clean passive solution for client drives that never see sustained enterprise duty cycles.

GP Spark opened beside its lid, with blue thermal pads coupling the four KIOXIA XG8 drives to the finned heatsink cover

A disclosure before the numbers: our unit is a prototype. The bottom label reads GP-Spark-1000, marks the device Prototype, Not for Resale, and carries a February 2026 build date under the Swingsoon brand Luisuantech uses on hardware. Production units may differ in fit and finish, though the platform behavior we tested is what Luisuantech is shipping to reviewers today. Two further notes on the out-of-box experience. Our unit shipped with two printed manuals entirely in Chinese, and initial setup appears to route through Wi-Fi onboarding. Neither is a blocker for the audience this box targets, but a Western launch will need English documentation.

GP Spark bottom label showing model GP-Spark-1000, 100W USB-C PD rating, and prototype not-for-resale marking

Setup and Architecture

There is no RAID controller and no storage abstraction onboard: the GP Spark is a JBOF in the literal sense, exposing each installed SSD as its own NVMe-oF namespace. In our configuration, four drives appeared as four /dev/nvme devices on the host. Redundancy or striping is the host’s job. The vendor spec sheet lists a single 100GbE port at 10GB/s and 2.7M IOPS; the product report separately references 2x100GbE configurations and up to 24GB/s, a figure Luisuantech confirmed is aggregate read plus write. Our unit and testing used the single-port configuration.

Luisuantech GP Spark Specifications

Specification Luisuantech GP Spark
Platform Overview
Drive Bays 4 x M.2 NVMe (2280 / 22110)
Mixed capacities supported, up to 4TB per drive
Network QSFP28 100GbE (DAC or optical)
RDMA required
Protocols NVMe-oF
RDMA
GPU Direct Storage (GDS)
Performance (Vendor-Stated)
Throughput 10GB/s per 100GbE port
Up to 24GB/s aggregate read plus write
IOPS 2.7M
Access Latency Under 20 microseconds
Power and Physical
Power Under 100W total
20V/5.4A USB-C PD external adapter
Dimensions 150mm x 150mm x 26mm (0.58L)
Operating Temperature 0 to 40C
Compatibility NVIDIA DGX Spark
DGX Station
Workstations and servers with RDMA-capable NICs

Performance

Our test configuration paired the GP Spark with a GIGABYTE DGX Spark over a direct 100GbE connection, with four 1TB KIOXIA XG8 client NVMe SSDs populating the bays. It’s important to keep in mind that the drives you pick will play a significant role in the measured performance. We leveraged client Gen5 SSDs; some models, especially enterprise SSDs, may offer higher sustained write performance. We ran FIO sweeps across 4K and 64K random and 1M sequential workloads, read and write, stepping iodepth and numjobs to map the full envelope. Results reflect the final retest after applying Luisuantech’s MTU guidance, which improved transfer behavior over our initial runs.

Luisuantech GP Spark stacked on top of the GIGABYTE DGX Spark in the StorageReview lab

4K Random Performance

Line chart of GP Spark FIO 4K random read IOPS across iodepth and numjobs, peaking at 2.43 million IOPS

Small-block reads are where the offload engine shows its worth. 4K random reads scaled with queue depth to a peak of 2.43 million IOPS at 9,475 MiB/s, within sight of the vendor’s 2.7M claim and effectively saturating the 100GbE link with 4K transfers. For a passively powered four-bay box feeding a desk-side AI system, that is a remarkable figure.

Line chart of GP Spark FIO 4K random write IOPS, peaking at 1.19 million IOPS

Writes follow the same shape at roughly half the height, peaking at 1.19 million IOPS. The gap between read and write ceilings is consistent across every workload we ran. The performance is directly related to the underlying drives, so results here will vary depending on configuration.

Line chart of GP Spark FIO 4K random read average latency, with a floor of 65 microseconds at low queue depth

Read latency bottoms out at 65.3 microseconds on average at low queue depth. That is higher than the vendor’s sub-20-microsecond claim, but results will vary depending on drive selection and network configuration. The network round trip is also doing work in that number; latency stays flat and predictable until the link saturates.

Line chart of GP Spark FIO 4K random write average latency, with a floor of 20 microseconds at minimal depth

Write latency is the one place the spec sheet claim lands: 20.4 microseconds average at minimal depth, right at the vendor’s under-20-microsecond figure and low enough that the fabric is effectively invisible to the application.

64K Random Performance

Line chart of GP Spark FIO 64K random read bandwidth holding near 9.5 GiB/s across the sweep

At 64K, the story becomes purely about bandwidth. Random reads hold 9,503 MiB/s at peak, statistically identical to the 4K and 1M ceilings. Whatever block size the workload brings, the GP Spark delivers the same answer: the full line rate of its 100GbE port.

Line chart of GP Spark FIO 64K random write bandwidth plateauing near 4.7 GiB/s

64K random writes plateau at 4,742 MiB/s, the same ceiling we measured at every other block size.

1M Sequential Performance

Line chart of GP Spark FIO 1M sequential read bandwidth saturating the 100GbE link at 9.5 GiB/s

Large-block sequential reads, the profile of model loading and dataset streaming, reach 9,496 MiB/s and hold there from modest queue depths onward. This is the workload the GP Spark exists for, and it runs at the wire.

Line chart of GP Spark FIO 1M sequential write bandwidth holding near 4.7 GiB/s

Sequential writes hold 4,742 MiB/s, roughly half of read throughput, and that ceiling is identical at every block size we tested. We flagged the asymmetry to Luisuantech during testing and worked through a round of tuning with the company, including MTU changes; the figures here represent the best the platform delivers in its current single-port configuration, and Luisuantech confirmed they are consistent with its specifications for the write path. For the read-dominated workloads this box targets, model loading, dataset streaming, and RAG retrieval, it is a footnote; for heavy ingest, size expectations accordingly.

Conclusion

The GP Spark does one thing and does it cleanly: it gives one or more DGX Spark the storage the platform really needs for heavy lifting. Cable it up, load the kernel module, and nearly 10GB/s of GDS-accessible flash appears without a driver install, a storage OS, or an enterprise invoice. Filling it with client M.2 drives is the point; capacity gets relatively cheap when the box accepts whatever 2280 or 22110 SSDs you have, and the offload engine handles the protocol work the drives never see.

Rear view of the GP Spark connected to the DGX Spark ConnectX port with a 100GbE DAC cable, copper heatsink visible through the vents

Our take is that this is a neat, well-executed add-on rather than a breakthrough. Reads stop at the single link’s line rate; writes stop at roughly half of that. Pricing is the open question: the GP Spark is not yet listed at retail in the US or China, our test unit is a prototype, and Luisuantech has not published pricing. The value argument rests on the box coming in meaningfully below enterprise NVMe-oF alternatives, which its client-drive design should allow. For Spark owners who hit the internal storage wall, and our original review suggests that many of them will, this is an easy path to solve that issue without carving out storage from a large enterprise storage estate.

Product page: Luisuantech GP Spark

The post Luisuantech GP Spark Review: Nearly 10GB/s of Plug-and-Play Storage for the DGX Spark appeared first on StorageReview.com.

Dell Pro Precision 5 16s Intel Review: 24 Hours of Battery in a 16-Inch Workstation

11 August 2026 at 16:39

The Dell Pro Precision 5 16s Intel is a 16-inch mobile workstation built for users who want more screen space while keeping the system reasonably portable. Our review unit pairs the Core Ultra X9 388H with Intel Arc Pro B390 graphics, 64GB of LPCAMM2-8533 memory, and a 1TB Gen5 SED SSD. The 2560 x 1600 IPS display gives plenty of room for larger spreadsheets, development tools, and creative applications, while the added numeric keypad makes better use of the wider chassis. It also manages to pack all of this in while delivering excellent battery life.

The 16s is built for engineers, developers, analysts, creators, and other professionals who need workstation-level performance in a system that is still fairly easy to carry around. Intel vPro Enterprise, Wi-Fi 7, a fingerprint reader, smart card support, TPM 2.0, and Dell’s management tools also make it a good fit for managed business environments. Our 64GB LPCAMM2 configuration has plenty of memory for heavier multitasking, professional applications, and local AI workloads. Dell also offers the same chassis with an AMD Ryzen AI 9 HX PRO 475, so potential buyers have another platform option with a very similar overall design.

Dell Pro Precision 5 16s Intel rear three-quarter view showing aluminum lid and left side ports

The Arc Pro B390 gives the 16s considerably more graphics capability than most business laptops with integrated graphics, along with 12 Xe cores and certified drivers for professional applications. The Core Ultra X9 388H also includes a 50 TOPS NPU, giving the system dedicated hardware for supported local AI workloads without relying entirely on the CPU or GPU. The larger 16-inch chassis gives the cooling system more room to work as well, and, as you will see in our testing below, the 16s posted the strongest multicore results we have seen from a B390-based system.

Our review configuration is priced at $5,929.25 as a single-unit purchase on Dell.com, with the jump from 16GB to 64GB of LPCAMM2 memory accounting for $1,600 of that total. Commercial pricing can vary considerably depending on configuration, support agreements, volume, and account-level discounts, so the listed web price is better treated as a reference point than a typical fleet purchase price. The system is available now through the Dell Pro Precision 5 Series 16S product page.

Dell Pro Precision 5 16s Specifications

Specification Dell Pro Precision 5 16s (PW516260)
Processor Intel Core Ultra X9 388H vPro (Series 3, 16 cores/16 threads, up to 5.1GHz, 50 TOPS NPU)
Graphics Intel Arc Pro B390 (12 Xe cores, integrated)
Memory 64GB LPCAMM2, 8533 MT/s, dual-channel
Storage 1TB SED PCIe NVMe 2280 SSD, Gen5 x4
Display 16-inch QHD+/WQXGA (2560 x 1600), non-touch, 500 nits, IPS, 100% sRGB, anti-glare, low blue light
Camera 8MP HDR RGB + IR with User Presence Detection
Wireless Intel Wi-Fi 7 BE211, 2×2
Keyboard English US backlit with numeric keypad and Copilot key
Security Fingerprint reader, smart card reader, ControlVault 3+, TPM 2.0
Battery 3-cell, 70Wh Long Lifecycle, ExpressCharge and ExpressCharge Boost
Power 100W USB-C adapter
Operating System Windows 11 Pro (Copilot+ PC)
Chassis Aluminum top cover, palm rest, and bottom cover
Systems Management Intel vPro Enabled
Certifications ENERGY STAR, EPEAT Gold with Climate+, TCO Certified
Warranty 36 months Basic Onsite Service after Remote Diagnosis
Price $5,929.25 as tested (Dell.com single-unit)

Build and Design

The Dell Pro Precision 5 16s uses aluminum across the top cover, palm rest, and bottom cover, giving the 16-inch chassis a solid feel while keeping the design fairly slim for a mobile workstation. It measures 14.12 x 9.98 inches, reaches 0.79 inches at its thickest point, and starts at 4.20 lb. Compared with the 14-inch Pro Precision 5 14s, which starts at 3.12 lb, the added size and roughly 1.1 lb of extra weight are easy to notice in a bag, but the larger chassis gives users considerably more screen and keyboard space. The AMD version of the 16s uses the same chassis, so the exterior design, dimensions, keyboard, port layout, and service access are essentially identical between the two platforms.

Dell Pro Precision 5 16s Intel front three-quarter view with Windows 11 desktop on QHD+ display

The 16-inch display is a 2560 x 1600 IPS panel with a 16:10 aspect ratio, 500-nit brightness, 100% sRGB coverage, an anti-glare finish, and low-blue-light support. That combination works nicely for a workstation this size, especially when working with larger spreadsheets, development environments, timelines, or applications with several tool panels open at once. The extra vertical room from the 16:10 panel is particularly useful beside a conventional 16:9 display, and the 500-nit rating gives the screen enough brightness for offices with stronger overhead lighting. Our configuration is non-touch.

Dell uses a wide hinge across the rear of the chassis, with most of the mechanism tucked behind the display rather than occupying space along the keyboard deck. The lid itself is fairly thin, which helps keep the 16s from looking bulky when viewed from the side, and the aluminum construction gives the display assembly more rigidity than a typical plastic business notebook. Compared with the 14s, the overall design is very similar, but the wider base gives the keyboard, touchpad, and display more room without dramatically increasing chassis thickness.

For audio, it has two internal 2W speakers for 4W of total output, with the speaker modules visible at the lower corners when the bottom cover is removed. Their placement keeps speaker grilles away from the keyboard deck and directs audio through openings along the lower chassis. The setup is primarily geared toward conferencing, calls, and everyday media use, with keyboard controls available for quick volume adjustment. Dell also pairs the speakers with dual digital-array microphones for conferencing.

Dell Pro Precision 5 16s Intel touchpad and palm rest detail with Copilot key

The larger keyboard deck is put to good use with a full numeric keypad, which is a useful addition for spreadsheet work, financial applications, engineering software, and other number-heavy workloads. Our unit has a backlit keyboard with a dedicated Copilot key, while the power button at the upper-right corner also houses the fingerprint reader. Dell shifts the large clickpad slightly toward the left so it lines up more closely with the main typing area instead of centering it across the entire width of the notebook. There is still plenty of palm-rest space around it, even with the wider keyboard and number pad.

Dell Pro Precision 5 16s Intel keyboard deck with numeric keypad and glass touchpad

Port selection is the strongest practical argument for working from this machine without a dock. Dell fits nine ports and slots across the two sides, which is a lot for a chassis that measures 0.79 inches at its thickest point, and almost none of it is legacy that has been quietly dropped on competitive systems. The left side carries HDMI 2.1, one USB-A port, two Thunderbolt 4 USB-C ports with DisplayPort and Power Delivery, and the smart card reader.

Dell Pro Precision 5 16s Intel left side ports with HDMI, USB-A, two Thunderbolt USB-C, and smart card slot

The right side adds the 3.5mm headset jack, a second USB-A port, Gigabit Ethernet on a drop-jaw hinge that lets a full-size RJ45 fit a chassis this thin, and a wedge lock slot. The small blank ahead of the headset jack is an eSIM cover rather than a card slot.

Dell Pro Precision 5 16s Intel right side ports with headphone jack, USB-A, RJ45 Ethernet, and lock slot

The effect is a full desk setup that needs nothing extra. Displays can hang off HDMI 2.1 or either Thunderbolt port; wired networking does not need a dongle or a USB adapter; and the two USB-A ports are split, one per side, for the peripherals that never moved to USB-C. The smart card reader is one that most competitors have given up, and it remains a requirement in government, healthcare, and finance deployments where CAC or PIV login is mandatory. The only layout quibble is that both USB-C ports sit on the left, so charging is left-side-only.

Above the display, Dell includes an 8MP HDR RGB and IR camera with dual-array microphones, user presence detection, and a physical privacy shutter. The 8MP sensor provides considerably more image resolution than the basic 1080p webcams still common in business notebooks, which can help retain facial detail during calls and conferencing. IR support provides Windows Hello facial authentication, while presence detection can work with supported Windows features to wake or lock the notebook as the user approaches or leaves. The physical shutter is built directly into the camera housing and can be closed with a small slider above the display. Dell lists several camera configurations for the 16s, with the 8MP HDR RGB+IR setup used in our review unit sitting at the top of that range.

Dell Pro Precision 5 16s Intel 8MP IR webcam with privacy shutter

In addition to the fingerprint reader and IR camera, security hardware with our configuration also includes a smart card reader, TPM 2.0, and Dell ControlVault 3+. There is no NFC reader on this configuration, which is one difference from the 14s unit we tested. Intel vPro Enterprise adds another layer for organizations using remote administration and hardware-assisted security features, which gives IT departments several authentication and management options without requiring external hardware.

Opening the bottom cover shows several major components accessible instead of fixing everything permanently to the motherboard. The 70Wh long-lifecycle battery in our configuration stretches across much of the lower half of the chassis and is customer-replaceable, while the LPCAMM2 memory module, M.2 SSD, WLAN card, fan, and several other components can also be replaced. Below, you can also see a single large cooling fan and heat pipe covering the processor area, with the LPCAMM2 module and storage positioned nearby for direct access once the cover is removed. Dell officially classifies the battery, memory, SSD, WLAN card, fan, speakers, and fingerprint reader as customer-replaceable components, which gives IT departments a lot more flexibility when it comes to repairs and upgrades over the life of the notebook.

Dell Pro Precision 5 16s Intel internals with 70Wh battery, LPCAMM2 memory, and single fan cooling

Dell Pro Precision 5 16s Performance

Our review unit runs the Core Ultra X9 388H with Arc Pro B390 graphics, 64GB of LPCAMM2 at 8533 MT/s, and a 1TB Gen5 SED SSD on Windows 11 Pro, with benchmarks tested on the Best Performance power mode. For battery life testing, we configure systems into Balanced power mode and set the screen brightness to 50%.

For comparables, we included the AMD version of the same machine, the Dell Pro Precision 5 16s AMD (Ryzen AI 9 HX PRO 475, Radeon 890M, 64GB), the step-up Dell Pro Precision 7 16 (Core Ultra 9 386H, NVIDIA RTX PRO 3000 Blackwell 12GB, 64GB, dual-drive RAID 0), and the Lenovo ThinkPad P14s Gen 7 (Core Ultra 7 366H, RTX PRO 1000, 64GB) as the external workstation reference. A few comp cells are marked N/A where a system could not complete a workload. The 7 16 Geekbench 6 run carried an invalid flag from tamper detection, which we reviewed and treated as a false positive, and its Cinebench CPU results were confirmed by a repeat run. We also tested the Dell Pro Precision 5 14s Intel, which shares this unit’s CPU and GPU; its results land within a few percent across the suite, so we left it off the tables and call out the places where the chassis difference shows up.

Dell Pro Precision 5 16s Intel front three-quarter view with Windows 11 desktop on QHD+ display

PCMark 10

PCMark 10 measures general system performance across everyday work such as web browsing, video conferencing, spreadsheets, writing, photo editing, and rendering. The overall score is supported by Essentials, Productivity, and Digital Content Creation subscores that show where a system’s strengths sit. Higher scores are better.

PCMark 10 Dell Pro Precision 5 16s Intel Dell Pro Precision 5 16s AMD Dell Pro Precision 7 16 Lenovo ThinkPad P14s Gen 7
Overall Score 9,994 8,627 8,901 9,083
Essentials 12,106 10,744 9,671 10,686
Productivity 15,505 14,574 16,381 16,501
Digital Content Creation 14,433 11,127 12,081 11,534


At 9,994 overall, the 5 16s Intel leads this group by a comfortable margin, 12% over the far more expensive 7 16 and 16% over its AMD twin, though it stops just six points short of the 10,000 mark its 14-inch sibling crossed. Its Digital Content Creation score of 14,433 is the best of the four, while the 7 16 and ThinkPad claw back ground in the Productivity subscore.

PCMark 10 Modern Office Battery

The PCMark 10 Modern Office battery test repeatedly runs common office tasks until the battery reaches the test’s cutoff point, in Balanced mode at 50% display brightness. This is a rundown of the whole system rather than a synthetic idle drain, so it tracks closely with what a full day of productivity work does to the battery. Longer runtimes are better.

Modern Office Battery Dell Pro Precision 5 16s Intel Dell Pro Precision 5 16s AMD Dell Pro Precision 7 16 Lenovo ThinkPad P14s Gen 7
Runtime (higher is better) 24 hours 43 minutes 15 hours 5 minutes 11 hours 43 minutes 15 hours 52 minutes


This is the longest battery run of the entire Pro Precision fleet. At 24 hours and 43 minutes, the 5 16s Intel more than doubles the dGPU-equipped 7 16, adds nine hours and 38 minutes over the AMD version of the same chassis, runs nearly nine hours past the ThinkPad, and even outlasts its own 14-inch twin by 53 minutes despite the larger, higher-resolution panel, a credit to the same 70Wh pack paired with the 16-inch chassis thermals. For all-day-and-then-some field work, this is the unit in the family to pick.

Geekbench 6

Geekbench 6 measures processor performance using a mix of common tasks, with separate scores for single-core and multi-core workloads, plus GPU compute scores through OpenCL and Vulkan. Higher scores are better. The 7 16 CPU run was flagged as invalid by the benchmark’s tamper detection; we reviewed it and treated the flag as a false positive, so its scores are included below.

Geekbench 6 Dell Pro Precision 5 16s Intel (Arc Pro B390) Dell Pro Precision 5 16s AMD (Radeon 890M) Dell Pro Precision 7 16 (RTX PRO 3000) Lenovo ThinkPad P14s Gen 7 (RTX PRO 1000)
CPU Single-Core 2,969 2,854 2,915 2,808
CPU Multi-Core 17,401 14,169 17,280 16,319
GPU OpenCL 57,998 37,520 131,492 87,537
GPU Vulkan 63,015 53,969 104,344 73,204


The X9 388H leads the CPU runs on both metrics, edging the Core Ultra 9 386H in the 7 16 by 2% single-core and under 1% multi-core, and the Arc Pro B390’s 63,015 Vulkan score is the best we have recorded from this iGPU, edging past even its own OpenCL result. The RTX PRO 3000 resets the scale on GPU compute, more than doubling the review unit in OpenCL.

Geekbench 7

Geekbench 7 joins the suite alongside Geekbench 6 as comparison data builds. Its CPU scores are calibrated against a baseline of 2,500, set by the AMD Ryzen 7700, while GPU scores are calibrated against a baseline of 100,000, set by the NVIDIA GeForce RTX 4060. Higher scores are better, and double the score indicates double the performance. Because Geekbench 7 uses new workloads and new baselines, its scores are not comparable to Geekbench 6 results.

Geekbench 7 Dell Pro Precision 5 16s Intel (Arc Pro B390) Dell Pro Precision 5 16s AMD (Radeon 890M) Dell Pro Precision 7 16 (RTX PRO 3000) Lenovo ThinkPad P14s Gen 7 (RTX PRO 1000)
CPU Single-Core 2,733 2,659 2,652 2,533
CPU Multi-Core 18,965 16,641 18,648 17,651
GPU OpenCL 54,247 31,874 96,919 75,340
GPU Vulkan 47,436 * 104,229 70,067
GPU CUDA N/A N/A 174,559 114,469


*The AMD unit’s Vulkan run failed workload validation in Geekbench 7 and was assigned a zero score for the affected subtest; we have discarded the result and will update the table when a clean run is available. Separately, on the dual-GPU 7 16, Geekbench’s Vulkan device selector runs the workload on the opposite GPU from the one selected; the scores above are attributed to the device that did the work.

Here is the quiet upset of the review: at 18,965 multi-core, the 5 16s Intel beats every system in the group, including the Core Ultra 9-equipped 7 16, and its 2,733 single-core leads as well. On the GPU side, the Arc Pro B390’s OpenCL score lands at just over half of Geekbench 7’s RTX 4060 baseline, while the RTX PRO 3000 clears the baseline in Vulkan and beats it by three-quarters in CUDA.

Cinebench 2026

Cinebench 2026 is the current release in the Cinebench line and the only version we report. It tests CPU and GPU performance using Maxon’s Redshift render engine. It is built on the latest Cinema 4D 2026 code and is designed to show whether a machine is stable under high CPU load, whether a notebook’s cooling can sustain longer render tasks, and how it handles demanding real-world 3D work. Because code and compiler changes accelerated scene rendering, Cinebench 2026 scores use an adjusted range and should not be compared to scores from previous Cinebench versions. Its GPU test supports current NVIDIA and AMD hardware but does not yet run on Intel integrated graphics, and the 7 16’s CPU results were confirmed by a repeat run.

Cinebench 2026 Dell Pro Precision 5 16s Intel Dell Pro Precision 5 16s AMD Dell Pro Precision 7 16 Lenovo ThinkPad P14s Gen 7
CPU Single Thread 535 471 518 502
CPU Multiple Threads 4,618 4,767 3,873 4,492
GPU N/A 5,667 51,517 34,437


The review unit takes a single thread at 535, the best Cinebench 2026 single-thread result we have recorded from a laptop, while the AMD twin’s 24 threads edge it in the multi-thread test by 3%. On GPU, the RTX PRO 3000’s 51,517 is the number that justifies the 7 16’s existence for supported renderers, half as quick as the RTX PRO 1000 in the ThinkPad.

7-Zip Compression

The built-in 7-Zip benchmark measures how quickly the processor can compress and decompress data using multiple threads, run with a 128MB dictionary across ten passes. Decompression tends to scale with thread count while compression leans on memory latency, so the two halves often tell different stories. Higher GIPS scores are better.

7-Zip 24.09 (GIPS) Dell Pro Precision 5 16s Intel Dell Pro Precision 5 16s AMD Dell Pro Precision 7 16 Lenovo ThinkPad P14s Gen 7
Compressing 96.281 85.627 96.202 90.364
Decompressing 97.246 117.863 95.896 90.526
Total Rating 96.764 101.745 96.049 90.445


The AMD unit’s 24-thread decompression hands it the total rating. Still, the review unit wins compression outright, and its 96.764 total edges the 7 16 while beating its own 14-inch twin by 4%, one of the clearest examples of what the bigger chassis buys from identical silicon.

y-cruncher

y-cruncher measures how quickly the processor can calculate large numbers of digits of Pi, placing a heavy load on the CPU and memory subsystem. At the same time, the BBP runs to extract hexadecimal digits of Pi. Results are in seconds, so lower times are better. The AMD unit could not complete the 5-billion- and 10-billion-digit runs because its memory reservation for the integrated GPU reduces the available pool below what those sizes require.

y-cruncher (seconds, lower is better) Dell Pro Precision 5 16s Intel Dell Pro Precision 5 16s AMD Dell Pro Precision 7 16 Lenovo ThinkPad P14s Gen 7
Pi 1B 26.422 22.840 31.557 26.685
Pi 2.5B 80.463 64.242 101.524 76.787
Pi 5B 183.822 N/A 226.255 172.994
Pi 10B 407.658 N/A 500.875 392.083
Pi BBP 1B 1.635 1.100 1.639 1.621
Pi BBP 10B 19.036 12.277 21.512 18.200
Pi BBP 100B 234.797 140.284 291.628 219.969


The AMD unit’s SMT threads dominate every run it completed, and the ThinkPad stays slightly ahead of the review unit at the largest Pi sizes. The surprise is the 7 16 trailing the whole group at every size, 23% behind the review unit at 10 billion digits, a result consistent with its lower memory throughput in the SPEC runs and worth revisiting alongside its Cinebench reruns.

Blender

The Blender benchmark measures rendering performance using three different 3D scenes: Monster, Junkshop, and Classroom. Results are reported in samples per minute, so higher scores are better, and we test on both the CPU and GPU. Scores are not comparable across Blender versions, so we have trimmed the older releases from the suite and report the current Blender 5.2 results here. The GPU figures are each system’s fastest renderer, meaning the discrete card on the two NVIDIA systems and the integrated GPU on the 5 16s pair.

Blender 5.2 (samples/min) Dell Pro Precision 5 16s Intel (Arc Pro B390) Dell Pro Precision 5 16s AMD (Radeon 890M) Dell Pro Precision 7 16 (RTX PRO 3000) Lenovo ThinkPad P14s Gen 7 (RTX PRO 1000)
GPU
Monster 572.84 123.00 1,555.53 922.95
Junkshop 468.85 101.21 1,257.01 795.65
Classroom 420.48 82.84 1,000.62 625.62
CPU
Monster 138.88 130.86 137.49 131.08
Junkshop 94.97 99.74 101.34 97.76
Classroom 65.39 74.18 69.26 68.45


The RTX PRO 3000 renders Monster at 1,555.53 samples per minute, 69 percent ahead of the RTX PRO 1000 in the ThinkPad and nearly triple the Arc Pro B390, which is what the 7 16’s dGPU premium buys in a supported renderer. Among the integrated GPUs, the review unit leads the Radeon 890M by more than four times across all three scenes, and it lands at 37 percent of the RTX PRO 3000, a respectable showing for a system with no discrete graphics. CPU rendering separates the four by only a few percent, with the review unit taking Monster outright.

LuxMark

LuxMark measures GPU compute performance by rendering complex scenes through OpenCL, based on LuxCoreRender. We run the Food and Hall scenes on all available OpenCL devices in each system, so single-GPU systems are scored on that GPU while the dual-GPU systems render on the discrete and integrated GPUs together, as noted in the column headers. Higher scores are better.

LuxMark v4 Dell Pro Precision 5 16s Intel (Arc Pro B390) Dell Pro Precision 5 16s AMD (Radeon 890M) Dell Pro Precision 7 16 (RTX PRO 3000 + iGPU) Lenovo ThinkPad P14s Gen 7 (RTX PRO 1000 + iGPU)
Hall 3,505 2,058 19,300 11,342
Food 1,713 1,034 7,624 4,103


The review unit led the single-GPU systems by 70% in Hall, essentially matching its 14-inch twin, while the 7 16’s combined RTX PRO 3000 and iGPU output is in a different class at 19,300.

V-Ray

Chaos V-Ray measures ray-traced rendering throughput, reported in vpaths, where higher is better. We run the CUDA-compatible engine on every system so results remain comparable to notebooks with only integrated graphics; on systems without a discrete GPU, that path executes on the integrated graphics, even though V-Ray reports the processor name in its device field. On dedicated NVIDIA hardware, we also capture V-Ray’s RTX engine, which engages the card’s ray tracing cores and is reported separately.

V-Ray GPU (vpaths) Dell Pro Precision 5 16s Intel (Arc Pro B390) Dell Pro Precision 5 16s AMD (Radeon 890M) Dell Pro Precision 7 16 (RTX PRO 3000) Lenovo ThinkPad P14s Gen 7 (RTX PRO 1000)
CUDA Engine 946 1,039 2,469 1,568
RTX Engine N/A N/A 3,891 2,589


The Radeon 890M takes the integrated matchup here by 10%, one of the few GPU tests where it beats the Arc Pro B390. The 7 16’s RTX PRO 3000 is the clear headliner, and its 3,891 vpaths on the RTX engine are 50% up on the ThinkPad’s RTX PRO 1000 in the same mode.

3DMark CPU Profile

The 3DMark CPU Profile benchmark measures CPU performance at fixed thread counts, from a single thread up to the maximum available, showing how performance scales as more cores are engaged. Higher scores are better.

3DMark CPU Profile Dell Pro Precision 5 16s Intel Dell Pro Precision 5 16s AMD Dell Pro Precision 7 16 Lenovo ThinkPad P14s Gen 7
Max Threads 10,748 9,267 10,557 10,500
8 Threads 6,818 6,573 5,996 6,550
4 Threads 4,483 4,238 4,261 4,219
1 Thread 1,210 1,178 1,185 1,165


The review unit sweeps every thread count, and its 10,748 max threads score is the best of any Pro Precision unit we have tested, 4.6% up on its 14-inch twin from the same silicon.

3DMark Storage and Blackmagic Disk Speed Test

3DMark Storage measures how an SSD performs during gaming-related tasks such as loading games, installing software, saving progress, and moving game files. Blackmagic Disk Speed Test measures an SSD’s sequential read and write speeds using large media files. Higher is better in both.

Storage Dell Pro Precision 5 16s Intel Dell Pro Precision 5 16s AMD Dell Pro Precision 7 16 Lenovo ThinkPad P14s Gen 7
3DMark Storage 2,804 2,325 2,189 3,094
Blackmagic Write (MB/s) 7,660.2 5,070.5 7,387.8 8,262.3
Blackmagic Read (MB/s) 8,418.1 5,071.2 6,776.2 8,511.5


The review unit’s SK hynix PCB01 posted solid Gen5 numbers, though this is one place the 14-inch twin’s Micron 4600 pulls ahead, reading nearly 9.8 GB/s against 8.4 here and scoring 3,093 in 3DMark Storage versus 2,804. Drive assignments vary within the family: the AMD twin’s SanDisk SN7100S lands near 5 GB/s in both directions, and the 7 16’s dual-drive RAID 0 volume wins nothing in these traces, trailing even in reads. Buyers with storage-sensitive workflows should watch which SSD their configuration ships with.

Blackmagic RAW Speed Test

The Blackmagic RAW Speed Test measures how many frames per second a system can decode Blackmagic RAW video on the CPU and on the GPU. We quote the 8K results at 12:1 compression, and higher is better.

Blackmagic RAW Speed Test Dell Pro Precision 5 16s Intel (Arc Pro B390) Dell Pro Precision 5 16s AMD (Radeon 890M) Dell Pro Precision 7 16 (RTX PRO 3000) Lenovo ThinkPad P14s Gen 7 (RTX PRO 1000)
8K 12:1 CPU (fps) 77 74 77 77
8K 12:1 GPU (fps) 87 49 137 96


CPU decode is effectively flat across the group at 74 to 77 fps. On the GPU, the 7 16 RTX PRO 3000 runs away with it at 137 fps through CUDA, while the review unit’s 87 fps over OpenCL comfortably clears real-time 8K playback, and the Radeon 890M falls short at 49.

Topaz Video AI

The Topaz Video AI benchmark measures AI video upscaling and frame-interpolation performance in frames per second across the application’s enhancement models, run here at 1080p input, where higher is better. The 16X Slowmo Aion model failed to complete on both Intel-graphics Precisions, this unit and the 7 16, while the AMD twin ran it without issue.

Topaz Video AI (fps) Dell Pro Precision 5 16s Intel (Arc Pro B390) Dell Pro Precision 5 16s AMD (Radeon 890M) Dell Pro Precision 7 16 (RTX PRO 3000) Lenovo ThinkPad P14s Gen 7 (RTX PRO 1000)
Artemis 1X / 2X / 4X 6.24 / 5.21 / 1.90 3.72 / 2.21 / 0.78 12.38 / 8.94 / 3.15 5.17 / 3.19 / 1.12
Iris 1X / 2X / 4X 5.29 / 3.19 / 0.96 4.91 / 2.72 / 0.92 13.06 / 7.49 / 2.32 5.91 / 3.12 / 1.01
Proteus 1X / 2X / 4X 6.45 / 6.09 / 2.47 3.99 / 2.70 / 1.18 12.06 / 8.60 / 2.66 4.78 / 3.14 / 1.05
Gaia 1X / 2X / 4X 3.30 / 2.26 / 1.51 1.87 / 1.34 / 0.96 3.73 / 2.66 / 2.02 1.62 / 1.13 / 0.79
Nyx 1X / 2X 1.56 / 1.57 1.87 / 1.53 3.59 / 3.08 2.40 / 2.09
Hyperion HDR 1X 3.23 11.48 15.58 14.56
4X Slowmo Apollo / APFast 8.48 / 22.00 6.08 / 17.59 18.04 / 30.60 10.39 / 29.94
16X Slowmo Aion DNF 9.05 DNF N/A


The 7 16’s RTX PRO 3000 leads the upscaling models across the board, roughly doubling the review unit in Artemis and Proteus, which is the expected order of things. More interesting is the middle of the table: the Arc Pro B390 beats the RTX PRO 1000 in Artemis, Proteus, and Gaia while losing the interpolation models and Hyperion HDR, the same split we saw on the 14s. The Aion failure on Intel graphics repeats here, one for the driver team.

UL Procyon AI Text Generation

The Procyon AI Text Generation Benchmark streamlines LLM performance testing by providing a concise, consistent evaluation method. It enables repeated testing across four local models, Phi, Mistral, Llama3, and Llama2, while minimizing the complexity of large models and the number of variables. Developed with AI hardware leaders, it optimizes the use of local AI accelerators to deliver more reliable, efficient performance assessments. All four systems ran the models through ONNX Runtime with DirectML on their GPUs.

Procyon AI Text Generation Dell Pro Precision 5 16s Intel (Arc Pro B390) Dell Pro Precision 5 16s AMD (Radeon 890M) Dell Pro Precision 7 16 (RTX PRO 3000) Lenovo ThinkPad P14s Gen 7 (RTX PRO 1000)
Phi 893 434 2,244 1,618
Mistral 646 403 2,062 1,397
Llama3 669 357 1,859 1,252
Llama2 750 390 1,990 DNF


The 7 16 owns this table, with its 12GB card also completing Llama2 at 1,990, where the 8GB RTX PRO 1000 could not load the model. Among the integrated GPUs, the Arc Pro B390 roughly doubles the Radeon 890M in Phi and Llama2, and the review unit’s 64GB memory pool finishes everything; the quiet advantage shared-memory platforms hold for local AI.

UL Procyon AI Computer Vision

The Procyon AI Computer Vision Benchmark measures AI inference performance across CPUs, GPUs, and dedicated accelerators using a range of neural networks, evaluating tasks such as image classification, object detection, segmentation, and super-resolution with models including MobileNet V3, Inception V4, YOLO V3, DeepLab V3, Real ESRGAN, and ResNet 50. The WinML runs use float32 on CPU and GPU, giving a like-for-like view across vendors. We also run the newer Computer Vision 2 suite through each vendor’s native path: OpenVINO in int8 on the Intel NPUs and fp16 on their iGPUs, TensorRT in fp16 on the RTX PRO 3000, and Ryzen AI on the AMD NPU; those results are listed separately since precision and runtime differ by platform. Higher scores are better.

Procyon AI Computer Vision (WinML) Dell Pro Precision 5 16s Intel Dell Pro Precision 5 16s AMD Dell Pro Precision 7 16 Lenovo ThinkPad P14s Gen 7
CPU 143 114 122 134
GPU 410 245 553 426


Procyon AI Computer Vision 2 (native runtimes) Dell Pro Precision 5 16s Intel Dell Pro Precision 5 16s AMD Dell Pro Precision 7 16
NPU (int8) 1,630 1,189 1,614
iGPU (fp16) 1,529 N/A 837
dGPU (TensorRT fp16) N/A N/A 3,470


In the vendor-neutral WinML view, the review unit posts the best CPU score and lands within 4% of the ThinkPad’s dGPU on graphics. On the native paths, the Intel AI Boost NPUs in the review unit and the 7 16 are within 1% of each other, both more than a third ahead of the Ryzen AI NPU, and the review unit’s iGPU nearly matches its NPU. Note the 7 16’s iGPU score of 837 comes from the smaller integrated Arc in the Core Ultra 9 386H, not the B390 class part in the 5-series units; its TensorRT result on the RTX PRO 3000 towers over everything at 3,470.

UL Procyon AI Image Generation

The Procyon AI Image Generation Benchmark provides a consistent method for measuring AI inference performance from low-power NPUs to high-end GPUs, with three tests: Stable Diffusion XL FP16 for high-end GPUs, Stable Diffusion 1.5 FP16 for moderately powerful GPUs, and Stable Diffusion 1.5 INT8 for low-power devices. The benchmark uses the optimal inference path for each platform: OpenVINO on Intel systems, the AMD-optimized DirectML pipeline on Radeon GPUs, and TensorRT on NVIDIA GPUs. The INT8 test uses Intel’s quantized SD 1.5 model where supported; the AMD pipeline does not offer a comparable quantized run. The 7 16 runs this suite through TensorRT on its RTX PRO 3000. New with this round, we also ran the INT8 workload on the Intel NPU.

Procyon AI Image Generation Dell Pro Precision 5 16s Intel (Arc Pro B390) Dell Pro Precision 5 16s AMD (Radeon 890M) Dell Pro Precision 7 16 (RTX PRO 3000) Lenovo ThinkPad P14s Gen 7 (RTX PRO 1000)
SD 1.5 FP16 638 316 1,424 943
SD 1.5 INT8 7,778 2,855 17,287 12,403
SDXL FP16 738 200 1,273 765
SD 1.5 INT8 NPU 2,881 2,870 N/A N/A


At 50.8 seconds per SDXL image, the review unit sits within 4% of the RTX PRO 1000, mirroring the 14s result, while the 7 16’s TensorRT run turns in 1,273 at 29.4 seconds per image for those who need volume. The NPU run at 2,881 delivers about 37% of the iGPU’s INT8 throughput while leaving the GPU free. Scores are not comparable between the FP16 and INT8 rows since the workloads use different batch sizes and step counts.

SPECviewperf 15

SPECviewperf 15 measures graphics performance using viewsets derived from professional applications in CAD, 3D modeling, rendering, engineering, and medical visualization, replayed here at 1080p. Higher scores are better, although performance can vary considerably between applications and graphics architectures. The 7 16 ran SPECviewperf at its native 4K resolution, which is not comparable to the FHD runs, so it sits this table out; the enscape-01 viewset also produced an unusually low score on the AMD twin that is worth a driver revisit.

SPECviewperf 15 (FHD) Dell Pro Precision 5 16s Intel (Arc Pro B390) Dell Pro Precision 5 16s AMD (Radeon 890M) Lenovo ThinkPad P14s Gen 7 (RTX PRO 1000)
3dsmax-08 21.46 26.23 28.20
blender-01 23.15 23.17 40.69
catia-07 26.35 22.70 43.36
creo-04 68.14 49.42 107.59
energy-04 38.86 29.69 45.79
enscape-01 15.24 8.45 25.45
maya-07 85.61 53.48 112.84
medical-04 70.91 73.31 86.38
snx-05 80.24 61.33 103.61
solidworks-08 32.99 36.40 53.63
unreal_engine-01 42.15 27.38 49.24


The review unit wins seven of the eleven viewsets against the Radeon 890M, with the certified CAD and engineering traces (creo, maya, snx, energy) showing the Arc Pro driver stack at its best. Unlike its 14-inch twin, it completed catia-07 cleanly at 26.35. The RTX PRO 1000 sweeps the table. For the record, the 7 16 native-4K run posted 114.70 in creo-04 and 63.99 in solidworks-08 even at four times the pixels, so its FHD equivalents would land higher still.

SPECworkstation 4

SPECworkstation 4 measures workstation performance across CPU, graphics, storage, AI, product design, engineering, financial services, and other professional workloads, using real applications grouped into seven industry verticals. Higher scores are better, and N/A means the system did not complete every workload required for that category. The standalone 7-Zip workload inside SPECworkstation failed on both the AMD twin and the 7 16, which suppresses their CPU subsystem and Productivity and Development scores; a rerun of the AMD twin reproduced the same failure, and our separate 7-Zip section above covers that ground.

SPECworkstation 4 Dell Pro Precision 5 16s Intel Dell Pro Precision 5 16s AMD Dell Pro Precision 7 16 Lenovo ThinkPad P14s Gen 7
Hardware Subsystems
Graphics 2.67 2.65 6.54 4.51
Accelerator 2.25 2.31 3.88 3.26
Storage 1.80 1.00 1.30 1.67
CPU 1.34 N/A N/A 1.35
Industry Verticals
AI & Machine Learning 1.47 1.45 1.76 1.65
Energy 1.55 1.38 1.87 1.69
Financial Services 0.94 1.29 1.03 0.96
Life Sciences 1.84 1.47 2.03 1.82
Media & Entertainment 1.60 1.48 1.87 1.81
Product Design 1.75 1.41 1.87 1.89
Productivity & Development 1.35 N/A N/A 1.34


The review unit posts the best Storage subsystem score of the four systems. The 7 16’s Graphics subsystem score of 6.54 shows the dGPU gap at its widest, while the review unit and its AMD twin split the verticals, with AMD ahead in Financial Services and the review unit well ahead in Life Sciences and Product Design. Against the ThinkPad, the review unit trades verticals rather than trailing across the board, taking Life Sciences and splitting the productivity scores.

Conclusion

The Dell Pro Precision 5 16s Intel ended up delivering the strongest CPU performance we have seen from any B390-based system, along with the longest battery life across the Pro Precision lineup we tested. Its 18,965 Geekbench 7 multicore score even beat the Core Ultra 9-equipped Pro Precision 7 16, and 7-Zip compression topped the group. PCMark 10 was equally strong at 9,994, six points shy of the 10,000 mark and 25 behind the 14-inch Intel model. Battery life was even more impressive at 24 hours and 43 minutes, more than double the Pro Precision 7 16, nearly nine hours beyond the ThinkPad P14s Gen 7, and 53 minutes longer than the 14s Intel despite its larger QHD+ display.

Dell Pro Precision 5 16s Intel underside showing Pro Precision branding and intake vents

The Arc Pro B390 also performed well across the professional graphics and AI tests, including strong certified ISV results, good Topaz upscaling performance, SDXL image generation within 4% of the RTX PRO 1000, and an NPU image generation score of 2,881.

Choosing between the Pro Precision models depends heavily on the workload. The AMD 16s has an advantage in heavily threaded rendering and y-cruncher, while the Intel model performed better in single-threaded work, graphics, AI, storage, and battery testing. Buyers who need substantially more GPU performance can move up to the Pro Precision 7 16, which was roughly 2.7 times faster in Blender and much faster in V-Ray, local AI text generation, and BRAW processing, but that configuration costs roughly $1,900 to $2,300 more and lasts less than half as long on battery. Compared with the Intel 14s, the 16s delivers very similar overall performance while adding the larger QHD+ display, numeric keypad, slightly better sustained CPU results, and another 53 minutes of battery life, although it is larger and heavier, and our review unit shipped with a slower SSD. The 16s also gives IT teams good service access, with a customer-replaceable battery along with replaceable LPCAMM2 memory, SSD, WLAN card, fan, and other internal components.

For configuration options and current pricing, visit the Dell Pro Precision 5 Series 16S product page.

Leaderboard: The Dell Pro Precision 5 16s Intel also holds the Best Battery Life spot on our Best Mobile Workstations leaderboard.

The post Dell Pro Precision 5 16s Intel Review: 24 Hours of Battery in a 16-Inch Workstation appeared first on StorageReview.com.

Dell Pro Precision 5 14s Intel Review: Certified Workstation Graphics Without a Discrete GPU

7 August 2026 at 21:22

The Dell Pro Precision 5 14s is a compact mobile workstation built around Intel’s latest professional laptop platform. Our review unit combines a Series 3 Intel Core Ultra X9 388H, a 16-core Panther Lake processor with a 50 TOPS NPU, with Intel Arc Pro B390 graphics, 64GB of LPCAMM2 memory running at 8533 MT/s, and a 1TB Gen5 SED-ready SSD. During testing, this configuration produced the strongest productivity results we have recorded from a 14-inch laptop while lasting nearly a full day on battery.

Dell Pro Precision 5 14s Intel open on desk showing display and keyboard

Within Dell’s lineup, the Pro Precision 5 14s adds workstation-focused graphics drivers and enterprise features without moving to a heavier discrete GPU design. It is designed for engineers, developers, analysts, and creators who need certified application support, strong CPU performance, and easier business deployment in a portable system. Dell also offers the same chassis with an AMD Ryzen AI 9 HX PRO 475, giving us a direct platform comparison throughout the review. This size also keeps the portability expected from a 14-inch business laptop: it’s compact, has a decent selection of ports, and features a replaceable LPCAMM2 memory.

Dell Pro Precision 5 14s rear view showing aluminum lid and Dell logo

Intel’s Arc Pro B390 is the professional version of the Arc B390 integrated GPU, pairing 12 Xe cores with certified drivers for professional applications. Alongside the Core Ultra X9 388H’s NPU, the system can run local AI workloads across the CPU, GPU, or dedicated 50 TOPS accelerator. Our testing covers all three, along with professional graphics, content creation, storage, and battery performance.

The Dell Pro Precision 5 14s starts at $2,228. Our review configuration prices out at $5,725.11 as a single-unit purchase on Dell.com, with the 16GB to 64GB LPCAMM2 memory jump representing the largest single line item. As with all commercial systems, most business buyers purchase through an account team at volume discounts, so the web price is best viewed as a reference ceiling rather than a typical fleet cost. The system is available now on the Dell Pro Precision 5 Series 14S product page.

Dell Pro Precision 5 14s Specifications

Specification Dell Pro Precision 5 14s (PW514260)
Processor Intel Core Ultra X9 388H vPro (Series 3, 16 cores/16 threads, up to 5.1GHz, 18MB cache, 50 TOPS NPU)
Graphics Intel Arc Pro B390 (12 Xe cores, integrated)
Memory 64GB LPCAMM2, 8533 MT/s, dual-channel
Storage 1TB Performance SSD, PCIe Gen5, SED-ready
Display 14-inch FHD+/WUXGA (1920 x 1200), non-touch, 500 nits, IPS, 100% sRGB, anti-glare, low blue light, low power
Camera 8MP HDR RGB + IR with User Presence Detection
Wireless Intel Wi-Fi 7 BE211
Keyboard English US backlit (mini-LED backlight)
Security Fingerprint reader, smart card reader, NFC, ControlVault 3+, TPM 2.0
Battery 3-cell, 70Wh Long Lifecycle, ExpressCharge and ExpressCharge Boost
Power 100W USB-C adapter
Operating System Windows 11 Pro (Copilot+ PC)
Chassis Aluminum top cover, palm rest, and bottom cover
Systems Management Intel vPro Enabled
Warranty 36 months Onsite Service after Remote Diagnosis
Price $2,228 starting; $5,725.11 as tested (Dell.com single-unit)

Build and Design

The 5 14s is the thin system. Dell builds two 14-inch machines in this family, and the S gives up internal volume to hit a travel weight. It starts at 3.12 pounds against 3.98 for the standard Pro Precision 5 14, and measures 19.1mm at its thickest point against 23.65mm, in a chassis with effectively the same footprint at 315.5 by 226mm. Losing 0.86 pounds and roughly 4.5mm off a 14-inch workstation is the entire premise of the model, and the compromises it forces are visible once the bottom comes off.

Dell Pro Precision 5 14s closed showing aluminum lid with Dell logo

The top cover is aluminum in a dark graphite that reads closer to blue than black under lab light, with a fine matte texture that hides fingerprints far better than the gloss lids Dell used to ship on this line. A mirrored Dell badge sits dead center and is the only marking on the surface. Dell specifies a three-sided aluminum chassis across the top cover, palm rest, and bottom, and states that it uses 50% recycled and 50% low-emissions aluminum. The wedge is pronounced for a machine this thin, tapering from 14.72mm at the hinge to 10.80mm at the front lip. The aluminum top cover provides good rigidity with minimal flex when opening the lid from a far corner. The hinge also provides a consistent, low-effort glide when opening the lid single-handedly.

Dell Pro Precision 5 14s keyboard deck with backlit keyboard and Intel Core Ultra vPro badge

The keyboard is a standard 79-key US layout with no number pad, mini-LED backlighting, and a function row that earns its keys: microphone mute on F4, a presence-detection toggle on F5, keyboard backlight on F6, display switching on F9, and a camera privacy toggle on F10. Dell puts home, end, insert, and delete in a column down the right edge rather than doubling them onto the arrows, which is a sensible call on a keyboard this size. The power button at the top right integrates the fingerprint reader. A Copilot key sits between the right alt and the arrow cluster, and that cluster is the one place the layout gives ground: full-size left and right arrows with half-height up and down keys that double as page up and page down. The keyboard layout is pretty typical of other Dell notebooks in its class, with a noticeable spacing between the keys, compared to others with tightly-neighboring keycaps. The mini-LED backlighting features two brightness levels, and both are respectable but not too bright in low-light environments, and even visible in well-lit environments.

Dell Pro Precision 5 14s glass touchpad and palm rest

The touchpad is a seamless clickpad, generously sized for a 14-inch deck, featuring a smooth coating for effortless navigation, and utilizes a typical diving board-style click mechanism. There is a tap target printed in the center for the NFC reader Dell builds into the palm rest, which is a good place for it on a machine aimed at badge-in environments.

Dell Pro Precision 5 14s right side ports with USB-A, RJ45 Ethernet, headphone jack, and lock slot

The right edge carries a slim tray at the front, the headset jack, a USB-A port at 5Gbps, gigabit Ethernet, and a wedge lock slot at the rear corner. Beyond the headphone jack, we also see a blank for an optional nano-SIM tray for configurations with WWAN. The RJ45 is the surprise. Dropping a full-height Ethernet jack into a chassis that is 10.8mm at the front is the kind of thing that disappears from consumer machines first, and its presence here says more about the intended buyer than any spec-sheet line does.

Dell Pro Precision 5 14s left side ports with HDMI, USB-A, and two Thunderbolt USB-C

The left edge holds HDMI 2.1, a second 5Gbps USB-A, and two Thunderbolt 4 ports rated at 40Gbps with Power Delivery and DisplayPort, either of which takes the 100W charger. Further back along the palm rest edge is the smart card reader slot. Counting it up, this is a workstation that drives external displays over HDMI or either USB-C port, takes legacy USB-A peripherals on both sides, has wired networking, and reads both smart cards and NFC badges, all without a dock. Very few 3.1-pound machines can say that.

Dell Pro Precision 5 14s 8MP IR webcam with privacy shutter

The top bezel is thin without resorting to a notch or a pop-up camera. The 8MP HDR module sits center with IR emitters flanking it for Windows Hello and user presence detection, and a mechanical shutter slides across the lens, visible as the textured tab in the middle of the housing. That is a physical shutter rather than an electronic kill switch, which is what security-minded IT actually wants. Audio comes from stereo speakers driven by Cirrus CS35L63 amplifiers at 2W per channel, with a dual-array microphone alongside the camera. The 8MP webcam produces a more than respectable image for use in conference calls without much grain or light distortion noticeable. The bottom-firing stereo speakers also produce a noticeable stereo effect for how close they are together, and make a pretty full sound, without a lot of distortion or rattle at full volume.

Dell Pro Precision 5 14s internals with 70Wh battery, CAMM2 memory, and cooling

With the bottom cover off, the serviceability claims hold up better than they usually do at this thickness. Memory is an LPDDR5X CAMM2 module under a metal retention plate, not soldered, and Dell prints the tightening order and an 18 to 20 kgf/cm torque spec directly on the shield. That is the single most consequential thing in this photo: a 3.12-pound workstation where a customer can change the RAM is quite rare. The Wi-Fi card is socketed M.2 rather than soldered down; the SSD sits under its own thermal plate on the right, with service instructions silkscreened next to it; and the 70Wh battery, Dell type 77C3X, lifts out with the connector at the center. Cooling is a single AVC blower and one heatpipe, which is the price of the thin chassis and the thing to watch in the sustained load results below.

For a machine built to a weight target, very little has been engineered out. The port selection is fuller than most thin-and-lights twice its class, the security hardware is all present, and the parts a fleet manager expects to replace over three years are the parts that come out first. What the 5 14s trades away is thermal headroom rather than features, and that shows up in the numbers rather than the hands.

Dell Pro Precision 5 14s Performance

Our review unit runs the Core Ultra X9 388H with Arc Pro B390 graphics, 64GB of LPCAMM2 at 8533 MT/s, and a 1TB Gen5 SSD on Windows 11 Pro, with benchmarks tested on the Best Performance power mode. For battery life testing, we configure systems into Balanced power mode and set the screen brightness to 50%.

Dell Pro Precision 5 14s front view with Windows 11 desktop on display

For comparables, we included the AMD version of the same machine, the Dell Pro Precision 5 14s AMD (Ryzen AI 9 HX PRO 475, Radeon 890M, 64GB LPDDR5x), the standard Dell Pro 5 14 Intel (Core Ultra X7 368H with Arc B390 integrated graphics, 64GB), and the Lenovo ThinkPad P14s Gen 7 (Core Ultra 7 366H, NVIDIA RTX PRO 1000, 64GB), the closest competing 14-inch mobile workstation. The Pro 5 14 predates our adoption of Geekbench 7, Cinebench 2026, and standalone 7-Zip, so it sits out those tables. We also tested the 16-inch Dell Pro Precision 5 16s Intel, which shares this unit’s exact CPU and GPU; its results land within a few percent of the 14s across the suite, so we left it off the tables and call out the handful of places where the bigger chassis makes a substantial difference.

A note on GPU labeling: the three systems in this group without a discrete GPU run V-Ray’s GPU test through the CUDA-compatible engine on their integrated graphics, and V-Ray reports the processor name in its device field. We label those results by the GPU that did the work.

PCMark 10

PCMark 10 measures general system performance across everyday work such as web browsing, video conferencing, spreadsheets, writing, photo editing, and rendering. The overall score is supported by the Essentials, Productivity, and Digital Content Creation subscores, which show where a system’s strengths lie. Higher scores are better.

PCMark 10 Dell Pro Precision 5 14s Intel Dell Pro Precision 5 14s AMD Dell Pro 5 14 Intel Lenovo ThinkPad P14s Gen 7
Overall Score 10,019 8,762 7,945 9,083
Essentials 12,188 11,442 10,751 10,686
Productivity 15,827 14,272 13,821 16,501
Digital Content Creation 14,147 11,178 9,158 11,534


The Pro Precision 5 14s posted an overall score of 10,019, the first laptop in our 14-inch group to cross the 10,000 mark. It led every subscore except Productivity, where the ThinkPad P14s Gen 7 edged ahead, and its Digital Content Creation score of 14,147 ran 23% ahead of the P14s and 54% ahead of the standard Pro 5 14.

PCMark 10 Modern Office Battery

The PCMark 10 Modern Office battery test repeatedly runs common office tasks until the battery reaches the test’s cutoff point, in Balanced mode at 50% display brightness. This is a rundown of the whole system rather than a synthetic idle drain, so it tracks closely with what a full day of productivity work does to the battery. Longer runtimes are better.

Modern Office Battery Dell Pro Precision 5 14s Intel Dell Pro Precision 5 14s AMD Dell Pro 5 14 Intel Lenovo ThinkPad P14s Gen 7
Runtime (higher is better) 23 hours 50 minutes 14 hours 26 minutes 26 hours 48 minutes 15 hours 52 minutes


At 23 hours and 50 minutes, the 5 14s Intel ran more than nine hours past the AMD version of the same chassis and eight hours past the dGPU-equipped ThinkPad. The standard Pro 5 14 remains our overall champion at 26 hours and 48 minutes, helped by its lower-power X7 silicon, but Precision gets remarkably close while carrying much stronger sustained performance. For what it is worth, the 16-inch 5 16s Intel and its larger thermal envelope stretched the same platform to 24 hours and 43 minutes.

Geekbench 6

Geekbench 6 measures processor performance using a mix of common tasks, with separate scores for single-core and multi-core workloads, plus GPU compute scores through OpenCL and Vulkan. Higher scores are better.

Geekbench 6 Dell Pro Precision 5 14s Intel (Arc Pro B390) Dell Pro Precision 5 14s AMD (Radeon 890M) Dell Pro 5 14 Intel (Arc B390) Lenovo ThinkPad P14s Gen 7 (RTX PRO 1000)
CPU Single-Core 3,010 2,831 2,952 2,808
CPU Multi-Core 17,396 14,611 10,372 16,319
GPU OpenCL 56,745 36,322 32,458 87,537
GPU Vulkan 55,581 49,868 43,382 73,204


The X9 388H took the single-core lead at 3,010 and posted 17,396 multi-core, ahead of every comp, including the ThinkPad. The GPU results are where the Arc Pro B390 separates itself from its non-Pro sibling in the Pro 5 14: 56,745 in OpenCL versus 32,458, a 75% gap between two GPUs with the same core count, reflecting the X9 platform’s higher graphics clocks and the Pro driver stack. The RTX PRO 1000 in the ThinkPad still owns outright GPU compute.

Geekbench 7

Geekbench 7 joins the suite alongside Geekbench 6 as comparison data builds. Its CPU scores are calibrated against a baseline of 2,500, set by the AMD Ryzen 7700, while GPU scores are calibrated against a baseline of 100,000, set by the NVIDIA GeForce RTX 4060. Higher scores are better, and double the score indicates double the performance. Because Geekbench 7 uses new workloads and new baselines, its scores are not comparable to Geekbench 6 results. The Dell Pro 5 14 was tested before we adopted Geekbench 7, so it sits this table out.

Geekbench 7 Dell Pro Precision 5 14s Intel (Arc Pro B390) Dell Pro Precision 5 14s AMD (Radeon 890M) Lenovo ThinkPad P14s Gen 7 (RTX PRO 1000)
CPU Single-Core 2,702 2,571 2,533
CPU Multi-Core 18,788 15,514 17,651
GPU OpenCL 54,854 31,423 75,340
GPU Vulkan 46,906 * 70,067
GPU CUDA N/A N/A 114,469


*The AMD unit’s Vulkan run failed workload validation in Geekbench 7 and was assigned a zero score for the affected subtest; we have discarded the result and will update the table when a clean run is available.

The story repeats on the newer suite: the X9 388H leads both CPU metrics in this group, with 18,788 multi-core putting it 6% ahead of the ThinkPad and 21% ahead of the AMD sibling. In GPU compute, the Arc Pro B390 lands at roughly half of Geekbench 7’s RTX 4060 baseline, which is strong territory for integrated graphics but well short of the RTX PRO 1000.

Cinebench R23 and 2024

Cinebench measures how quickly the processor can render a complex photorealistic scene, with separate single-core and multi-core tests. R23 uses the legacy Cinema 4D engine that remains the most widely quoted version, while Cinebench 2024 moves to the Redshift render engine with a rebased score range. Hence, scores are not comparable between the two versions. The GPU test in Cinebench 2024 requires more graphics memory than these integrated platforms expose, so it did not run on the Dell systems. Higher scores are better.

Cinebench Dell Pro Precision 5 14s Intel Dell Pro Precision 5 14s AMD Dell Pro 5 14 Intel Lenovo ThinkPad P14s Gen 7
Cinebench R23
Single-Core 2,137 2,028 2,010 2,056
Multi-Core 18,466 20,884 16,915 18,546
Cinebench 2024
Single-Core 125 114 122 123
Multi-Core 1,106 1,089 807 1,118


The AMD unit’s 24-thread Ryzen takes R23 multi-core at 20,884, a workload that has long favored AMD’s thread count, while the X9 388H wins single-core in both versions. In Cinebench 2024, the three current-generation machines bunch within 3% of each other in multi-core, all well clear of the Pro 5 14’s 807.

Cinebench 2026

Cinebench 2026 joins the suite alongside R23 and 2024. It tests CPU and GPU performance using Maxon’s Redshift render engine. It is built on the latest Cinema 4D 2026 code and is designed to show whether a machine is stable under high CPU load, whether a notebook’s cooling can sustain longer render tasks, and how it handles demanding real-world 3D work. Because code and compiler changes accelerated scene rendering, Cinebench 2026 scores use an adjusted range and should not be compared to scores from previous Cinebench versions. Its GPU test supports current NVIDIA and AMD hardware but does not yet run on Intel integrated graphics, so the two Intel Dell systems have no GPU score.

Cinebench 2026 Dell Pro Precision 5 14s Intel Dell Pro Precision 5 14s AMD Lenovo ThinkPad P14s Gen 7
CPU Single Thread 513 466 502
CPU Multiple Threads 4,513 4,230 4,492
GPU N/A 5,313 34,437


On the Redshift-based CPU test, the X9 388H again finishes first, though the margin over the ThinkPad is under 1%. The Radeon 890M managed a GPU score of 5,313, and the RTX PRO 1000 shows what a workstation dGPU adds in a supported renderer.

7-Zip Compression

The built-in 7-Zip benchmark measures how quickly the processor can compress and decompress data using multiple threads, run with a 128MB dictionary across ten passes. Decompression tends to scale with thread count while compression leans on memory latency, so the two halves often tell different stories. Higher GIPS scores are better.

7-Zip 24.09 (GIPS) Dell Pro Precision 5 14s Intel Dell Pro Precision 5 14s AMD Lenovo ThinkPad P14s Gen 7
Compressing 92.836 89.099 90.364
Decompressing 93.089 117.545 90.526
Total Rating 92.963 103.322 90.445


Decompression scales with thread count, which gives the 24-thread AMD unit a total rating of 103.322 GIPS. The Intel unit’s 92.963 edges the ThinkPad, and for reference, the 16-inch 5 16s Intel squeezed out 96.764 GIPS from the same silicon with more thermal room.

y-cruncher

y-cruncher measures how quickly the processor can calculate large numbers of digits of Pi, placing a heavy load on the CPU and memory subsystem. At the same time, the BBP runs extract hexadecimal digits of Pi. Results are in seconds, so lower times are better. The AMD unit could not complete the 5 billion and 10 billion digit runs because its memory reservation for the integrated GPU reduces the available pool below what those sizes require.

y-cruncher (seconds, lower is better) Dell Pro Precision 5 14s Intel Dell Pro Precision 5 14s AMD Dell Pro 5 14 Intel Lenovo ThinkPad P14s Gen 7
Pi 1B 28.404 24.648 29.405 26.685
Pi 2.5B 83.968 71.084 90.719 76.787
Pi 5B 190.356 N/A 204.685 172.994
Pi 10B 417.224 N/A 512.277 392.083
Pi BBP 1B 1.684 1.104 1.718 1.621
Pi BBP 10B 20.028 14.333 20.210 18.200
Pi BBP 100B 241.409 166.762 256.416 219.969


The AMD unit’s SMT threads give it a clear edge in every run it completed, and the ThinkPad finishes ahead of the review unit at the larger sizes. The Precision still beats the Pro 5 14 across the board, with the gap widening to 19% at 10 billion digits.

Blender

The Blender benchmark measures rendering performance using three different 3D scenes: Monster, Junkshop, and Classroom. Results are reported in samples per minute, so higher scores are better, and we test on both the CPU and GPU. Scores are not comparable across Blender versions, so each version gets its own table. Starting with this review, we are trimming the older Blender releases from the suite and reporting the current 5.1 and 5.2 results; the Pro 5 14 predates Blender 5.2, and the ThinkPad P14s Gen 7 will join these tables once it completes the expanded version sweep.

Blender 5.1 (samples/min) Dell Pro Precision 5 14s Intel (Arc Pro B390) Dell Pro Precision 5 14s AMD (Radeon 890M) Dell Pro 5 14 Intel (Arc B390)
GPU
Monster 559.73 134.65 360.50
Junkshop 467.52 107.84 309.81
Classroom 418.63 95.60 232.02
CPU
Monster 131.04 130.35 70.12
Junkshop 97.86 100.31 52.95
Classroom 66.98 76.40 34.97


Blender 5.2 (samples/min) Dell Pro Precision 5 14s Intel (Arc Pro B390) Dell Pro Precision 5 14s AMD (Radeon 890M)
GPU
Monster 567.52 124.50
Junkshop 463.30 101.06
Classroom 417.38 82.95
CPU
Monster 133.46 127.02
Junkshop 94.27 95.84
Classroom 64.26 71.63


The Arc Pro B390 rendered Monster at 559.73 samples per minute in Blender 5.1, more than four times the Radeon 890M and 55 percent ahead of the Arc B390 in the Pro 5 14, and the 5.2 results hold the same level. On CPU rendering the Intel and AMD Precision twins trade scenes, with AMD’s extra threads winning Junkshop and Classroom, while the Pro 5 14 falls off sharply in the 5.x releases.

LuxMark

LuxMark measures GPU compute performance by rendering complex scenes through OpenCL, based on LuxCoreRender. We run the Food and Hall scenes on all available OpenCL devices in each system, so the GPU listed in each column header did the rendering. Higher scores are better.

LuxMark v4 Dell Pro Precision 5 14s Intel (Arc Pro B390) Dell Pro Precision 5 14s AMD (Radeon 890M) Dell Pro 5 14 Intel (Arc B390) Lenovo ThinkPad P14s Gen 7 (RTX PRO 1000)
Hall 3,494 2,077 3,287 11,342
Food 1,705 1,041 1,585 4,103


The Arc Pro B390 led the integrated pack in both scenes, finishing 68% ahead of the Radeon 890M in Hall. The gap to its non-Pro sibling is modest here, unlike the Geekbench compute results, suggesting LuxCoreRender is less sensitive to the clock and driver differences between the two B390 variants.

V-Ray

Chaos V-Ray measures ray-traced rendering throughput, reported in vpaths, where higher is better. We run the CUDA-compatible engine on every system so results remain comparable to notebooks with only integrated graphics; on systems without a discrete GPU, that path executes on the integrated graphics, even though V-Ray reports the processor name in its device field. On dedicated NVIDIA hardware, we also capture V-Ray’s RTX engine, which engages the card’s ray tracing cores and is reported separately.

V-Ray GPU (vpaths) Dell Pro Precision 5 14s Intel (Arc Pro B390) Dell Pro Precision 5 14s AMD (Radeon 890M) Dell Pro 5 14 Intel (Arc B390) Lenovo ThinkPad P14s Gen 7 (RTX PRO 1000)
CUDA Engine 890 897 919 1,568
RTX Engine N/A N/A N/A 2,589


The three integrated platforms cluster within about 3% of each other, an unusually tight grouping given how differently they behave elsewhere, which points to this compatibility path leaning on CPU and memory as much as the GPU. The ThinkPad pulls well clear on either engine.

3DMark CPU Profile

The 3DMark CPU Profile benchmark measures CPU performance at fixed thread counts, from a single thread up to the maximum available, showing how performance scales as more cores are engaged. Higher scores are better.

3DMark CPU Profile Dell Pro Precision 5 14s Intel Dell Pro Precision 5 14s AMD Dell Pro 5 14 Intel Lenovo ThinkPad P14s Gen 7
Max Threads 10,277 8,778 10,370 10,500
8 Threads 6,441 6,270 6,669 6,550
4 Threads 4,176 4,047 4,256 4,219
1 Thread 1,174 1,160 1,181 1,165


The four systems are effectively tied at every thread count except max, where the AMD unit trails; its strength in rendering workloads does not carry over to this physics test. The 16-inch 5 16s Intel posted the group’s best max threads result at 10,748, one of the few places its extra thermal headroom shows up.

3DMark Storage and Blackmagic Disk Speed Test

3DMark Storage measures how an SSD performs during gaming-related tasks such as loading games, installing software, saving progress, and moving game files. Blackmagic Disk Speed Test measures an SSD’s sequential read and write speeds using large media files. Higher is better in both.

Storage Dell Pro Precision 5 14s Intel Dell Pro Precision 5 14s AMD Dell Pro 5 14 Intel Lenovo ThinkPad P14s Gen 7
3DMark Storage 3,093 2,424 3,144 3,094
Blackmagic Write (MB/s) 9,000.8 4,772.0 8,747.3 8,262.3
Blackmagic Read (MB/s) 9,809.2 4,900.4 8,609.6 8,511.5


The review unit’s Micron 4600 posted the best sequential numbers in the group, reading at nearly 9.8 GB/s. The AMD twin ships with a Kioxia BG7 in this configuration and lands at roughly half the sequential throughput, a config difference worth noting for video-heavy workflows. Buyers of the 16-inch model should also know its drive tested lower here, with the 5 16s Intel’s SSD reaching 7,660 MB/s writes, and 8,418 MB/s reads and a 3DMark Storage score of 2,804, about 9% behind the 14s.

Blackmagic RAW Speed Test

The Blackmagic RAW Speed Test measures how many frames per second a system can decode Blackmagic RAW video on the CPU and on the GPU. We quote the 8K results at 12:1 compression, and higher is better.

Blackmagic RAW Speed Test Dell Pro Precision 5 14s Intel (Arc Pro B390) Dell Pro Precision 5 14s AMD (Radeon 890M) Dell Pro 5 14 Intel (Arc B390) Lenovo ThinkPad P14s Gen 7 (RTX PRO 1000)
8K 12:1 CPU (fps) 79 77 76 77
8K 12:1 GPU (fps) 85 49 86 96


Decode is effectively CPU-bound at these settings, with all four systems between 76 and 79 fps on the processor. On the GPU side, the RTX PRO 1000 leads at 96 fps through CUDA, the two B390-class systems decode in the mid-80s over OpenCL, and the Radeon 890M trails at 49 fps.

Topaz Video AI

The Topaz Video AI benchmark measures AI video upscaling and frame-interpolation performance in frames per second across the application’s enhancement models, run here at 1080p input, where higher is better. The Dell Pro 5 14 was not tested with Topaz, and the 16X Slowmo Aion model failed to complete on the review unit, an error we also saw on the 5 16s Intel; both AMD Precision units ran it without issue.

Topaz Video AI (fps) Dell Pro Precision 5 14s Intel (Arc Pro B390) Dell Pro Precision 5 14s AMD (Radeon 890M) Lenovo ThinkPad P14s Gen 7 (RTX PRO 1000)
Artemis 1X / 2X / 4X 6.22 / 5.28 / 1.89 3.75 / 2.24 / 0.79 5.17 / 3.19 / 1.12
Iris 1X / 2X / 4X 5.18 / 3.14 / 0.94 4.86 / 2.70 / 0.86 5.91 / 3.12 / 1.01
Proteus 1X / 2X / 4X 6.43 / 6.08 / 2.46 3.93 / 2.69 / 1.19 4.78 / 3.14 / 1.05
Gaia 1X / 2X / 4X 3.24 / 2.25 / 1.50 1.90 / 1.35 / 0.94 1.62 / 1.13 / 0.79
Nyx 1X / 2X 1.57 / 1.54 1.86 / 1.56 2.40 / 2.09
Hyperion HDR 1X 3.22 11.34 14.56
4X Slowmo Apollo / APFast 8.57 / 22.13 6.05 / 17.72 10.39 / 29.94
16X Slowmo Aion DNF 9.13 N/A


The Arc Pro B390 won most of the upscaling models outright, including a wide lead in Proteus and Gaia, and even beat the RTX PRO 1000 in several. The pattern flips in Hyperion HDR and the interpolation models, where NVIDIA and AMD hold clear advantages, and the Aion failure on Intel graphics is worth watching for anyone whose pipeline depends on 16X slow motion.

UL Procyon AI Text Generation

The Procyon AI Text Generation Benchmark streamlines LLM performance testing by providing a concise, consistent evaluation method. It enables repeated testing across four local models, Phi, Mistral, Llama3, and Llama2, while minimizing the complexity of large models and the number of variables. Developed with AI hardware leaders, it optimizes the use of local AI accelerators to deliver more reliable, efficient performance assessments. All four systems ran the models through ONNX Runtime with DirectML on their GPUs.

Procyon AI Text Generation Dell Pro Precision 5 14s Intel (Arc Pro B390) Dell Pro Precision 5 14s AMD (Radeon 890M) Dell Pro 5 14 Intel (Arc B390) Lenovo ThinkPad P14s Gen 7 (RTX PRO 1000)
Phi 887 424 904 1,618
Mistral 646 396 716 1,397
Llama3 674 352 708 1,252
Llama2 786 379 641 DNF


The two B390-class systems hold a wide lead over the Radeon 890M across all four models, ranging from 63% in Mistral to more than double in Phi, and the review unit’s 64GB memory pool lets it finish Llama2 at 786, a model the 8GB RTX PRO 1000 could not load at all. For smaller models, the dGPU’s bandwidth still wins decisively.

UL Procyon AI Computer Vision

The Procyon AI Computer Vision Benchmark measures AI inference performance across CPUs, GPUs, and dedicated accelerators using a range of neural networks, evaluating tasks such as image classification, object detection, segmentation, and super-resolution with models including MobileNet V3, Inception V4, YOLO V3, DeepLab V3, Real ESRGAN, and ResNet 50. The WinML runs use float32 on CPU and GPU, giving a like-for-like view across vendors. We also run the newer Computer Vision 2 suite through each vendor’s native path: OpenVINO in int8 on the Intel NPU and fp16 on its iGPU, and Ryzen AI on the AMD NPU; those results are listed separately since precision and runtime differ by platform. Higher scores are better.

Procyon AI Computer Vision (WinML) Dell Pro Precision 5 14s Intel Dell Pro Precision 5 14s AMD Dell Pro 5 14 Intel Lenovo ThinkPad P14s Gen 7
CPU 141 106 119 134
GPU 404 247 398 426
Procyon AI Computer Vision 2 (native runtimes) Dell Pro Precision 5 14s Intel Dell Pro Precision 5 14s AMD
NPU (int8) 1,647 1,176
iGPU (fp16) 1,517 N/A


In the vendor-neutral WinML view, the review unit leads on both CPU and lands within 5% of the ThinkPad’s dGPU on graphics. On the native path, Intel’s AI Boost NPU scored 1,647 in Computer Vision 2, 40% ahead of the Ryzen AI NPU, and notably, the B390 iGPU nearly matches the NPU while the NPU sips a fraction of the power.

UL Procyon AI Image Generation

The Procyon AI Image Generation Benchmark provides a consistent method for measuring AI inference performance from low-power NPUs to high-end GPUs, with three tests: Stable Diffusion XL FP16 for high-end GPUs, Stable Diffusion 1.5 FP16 for moderately powerful GPUs, and Stable Diffusion 1.5 INT8 for low-power devices. The benchmark uses the optimal inference path for each platform: OpenVINO on Intel systems, the AMD-optimized DirectML pipeline on Radeon, and TensorRT on NVIDIA GPUs. The INT8 test uses Intel’s quantized SD 1.5 model where supported; the AMD pipeline does not offer a comparable quantized run, so that cell is blank pending a supported path. New with this round, we also ran the INT8 workload on the Intel NPU.

Procyon AI Image Generation Dell Pro Precision 5 14s Intel (Arc Pro B390) Dell Pro Precision 5 14s AMD (Radeon 890M) Dell Pro 5 14 Intel (Arc B390) Lenovo ThinkPad P14s Gen 7 (RTX PRO 1000)
SD 1.5 FP16 632 281 635 943
SD 1.5 INT8 7,873 N/A 7,693 12,403
SDXL FP16 731 197 646 765
SD 1.5 INT8 NPU 3,003 N/A N/A N/A


At 51.3 seconds per SDXL image, the review unit came within 5% of the RTX PRO 1000, a result that would have been hard to believe from integrated graphics a generation ago, and its SDXL score of 731 beat the Pro 5 14 by 13%. The NPU run is the first we have recorded on this workload; at 3,003, it delivers roughly 38% of the iGPU’s INT8 throughput while leaving the GPU free, a useful trade for background generation tasks. Note that scores are not comparable between the FP16 and INT8 rows since the workloads use different batch sizes and step counts.

SPECviewperf 15

SPECviewperf 15 measures graphics performance using viewsets derived from professional applications in CAD, 3D modeling, rendering, engineering, and medical visualization, replayed here at 1080p. Higher scores are better, although performance can vary considerably between applications and graphics architectures. The Catia-07 viewset failed to complete on the review unit across multiple runs, and Enscape-01 failed on the AMD Twin; we will update if new driver releases resolve either.

SPECviewperf 15 (FHD) Dell Pro Precision 5 14s Intel (Arc Pro B390) Dell Pro Precision 5 14s AMD (Radeon 890M) Dell Pro 5 14 Intel (Arc B390) Lenovo ThinkPad P14s Gen 7 (RTX PRO 1000)
3dsmax-08 19.51 26.30 20.21 28.20
blender-01 21.55 23.01 21.19 40.69
catia-07 DNF 22.70 10.27 43.36
creo-04 63.57 49.27 32.53 107.59
energy-04 38.07 29.51 10.78 45.79
enscape-01 14.92 DNF 14.28 25.45
maya-07 83.86 53.30 82.42 112.84
medical-04 69.41 73.42 22.96 86.38
snx-05 78.74 59.58 46.22 103.61
solidworks-08 33.38 36.66 23.60 53.63
unreal_engine-01 41.38 27.31 38.77 49.24


This table justifies the Pro in Arc Pro. The review unit beat the standard B390 by wide margins in the ISV viewsets that lean on certified driver paths, roughly doubling it in creo-04 and tripling it in energy-04 and medical-04, while the two trade places in the game-engine and DCC traces where certification matters less. The Radeon 890M wins a handful of viewsets, and the RTX PRO 1000 sweeps all eleven.

SPECworkstation 4

SPECworkstation 4 measures workstation performance across CPU, graphics, storage, AI, product design, engineering, financial services, and other professional workloads, using real applications grouped into seven industry verticals. Higher scores are better, and N/A means the system did not complete every workload required for that category. The NAMD workload failed repeatedly on the review unit, which also suppresses its Life Sciences vertical and CPU subsystem scores; the other three systems completed their runs, though the Pro 5 14’s HandBrake failure removes its Media and Entertainment vertical.

SPECworkstation 4 Dell Pro Precision 5 14s Intel Dell Pro Precision 5 14s AMD Dell Pro 5 14 Intel Lenovo ThinkPad P14s Gen 7
Hardware Subsystems
Graphics 2.70 2.57 1.68 4.51
Accelerator 2.29 2.22 N/A 3.26
Storage 1.70 0.93 1.76 1.67
CPU N/A 1.15 1.19 1.35
Industry Verticals
AI & Machine Learning 1.45 1.38 1.36 1.65
Energy 1.67 1.28 1.18 1.69
Financial Services 0.93 1.07 0.78 0.96
Life Sciences N/A 1.41 1.34 1.82
Media & Entertainment 1.53 1.39 N/A 1.81
Product Design 1.80 1.34 1.64 1.89
Productivity & Development 1.32 1.03 1.10 1.34


The review unit’s Graphics and Accelerator subsystem scores clear the AMD twin and post the biggest gap over the standard Pro 5 14, again reflecting the Pro driver stack. It leads the Dell group in five of the six verticals it completed. The ThinkPad’s dGPU keeps it on top overall. The AMD unit’s 0.93 Storage score tracks with its slower Kioxia drive.

Dell Pro Precision 5 14s underside with ventilation grille and speaker slots

Conclusion

The Dell Pro Precision 5 14s Intel is the strongest 14-inch productivity laptop we have reviewed to date. It was the first system in this group to break 10,000 points in PCMark 10, led both Geekbench 6 and Geekbench 7 CPU tests, and still delivered 23 hours and 50 minutes in our Modern Office battery test. That runtime was second only to the lower-power Pro 5 14 and nearly eight hours longer than the ThinkPad P14s Gen 7.

The Arc Pro B390 gives this model its strongest advantage over the standard Pro 5 14, delivering roughly 75% more GPU compute performance and gains of about 2x to 3x across several certified ISV viewsets. It also finished within 5% of the RTX PRO 1000 in SDXL image generation. The system produced our first published NPU image generation result, while its 64GB shared memory pool allowed it to run larger local AI workloads that exceeded the ThinkPad’s 8GB VRAM capacity.

The $5,725.11 as-tested price is steep, especially compared with the $4,703.16 ThinkPad P14s Gen 7, whose discrete RTX PRO 1000 still leads in outright GPU performance. The AMD Precision 5 14s is also the better choice for thread-heavy rendering, compression, and calculation workloads, and it comes in at a slightly lower price.

At the same time, the Intel version offers stronger graphics acceleration, AI performance, battery life, and storage speeds. However, the CATIA, NAMD, and Topaz Aion scores make it a less certain choice for buyers who depend on those workloads. Dell’s commercial support, configuration options, and volume discounts may narrow the pricing gap for business customers, but this configuration makes the most sense for organizations that need long battery life, up to 64GB of shared memory, and certified workstation graphics in a compact 14-inch laptop.

For configuration options and current pricing, visit the Dell Pro Precision 5 Series 14S product page.

Leaderboard: The Dell Pro Precision 5 14s Intel is our Best Ultraportable Workstation on the Best Mobile Workstations leaderboard.

Leaderboard: The Dell Pro Precision 5 14s Intel holds the Best Without a Discrete GPU spot on the Best Laptops for Local AI leaderboard.

The post Dell Pro Precision 5 14s Intel Review: Certified Workstation Graphics Without a Discrete GPU appeared first on StorageReview.com.

❌
❌