Reading view

There are new articles available, click to refresh the page.

Samsung 990 SSD Review: A Value Gen4 SSD for Expensive Times
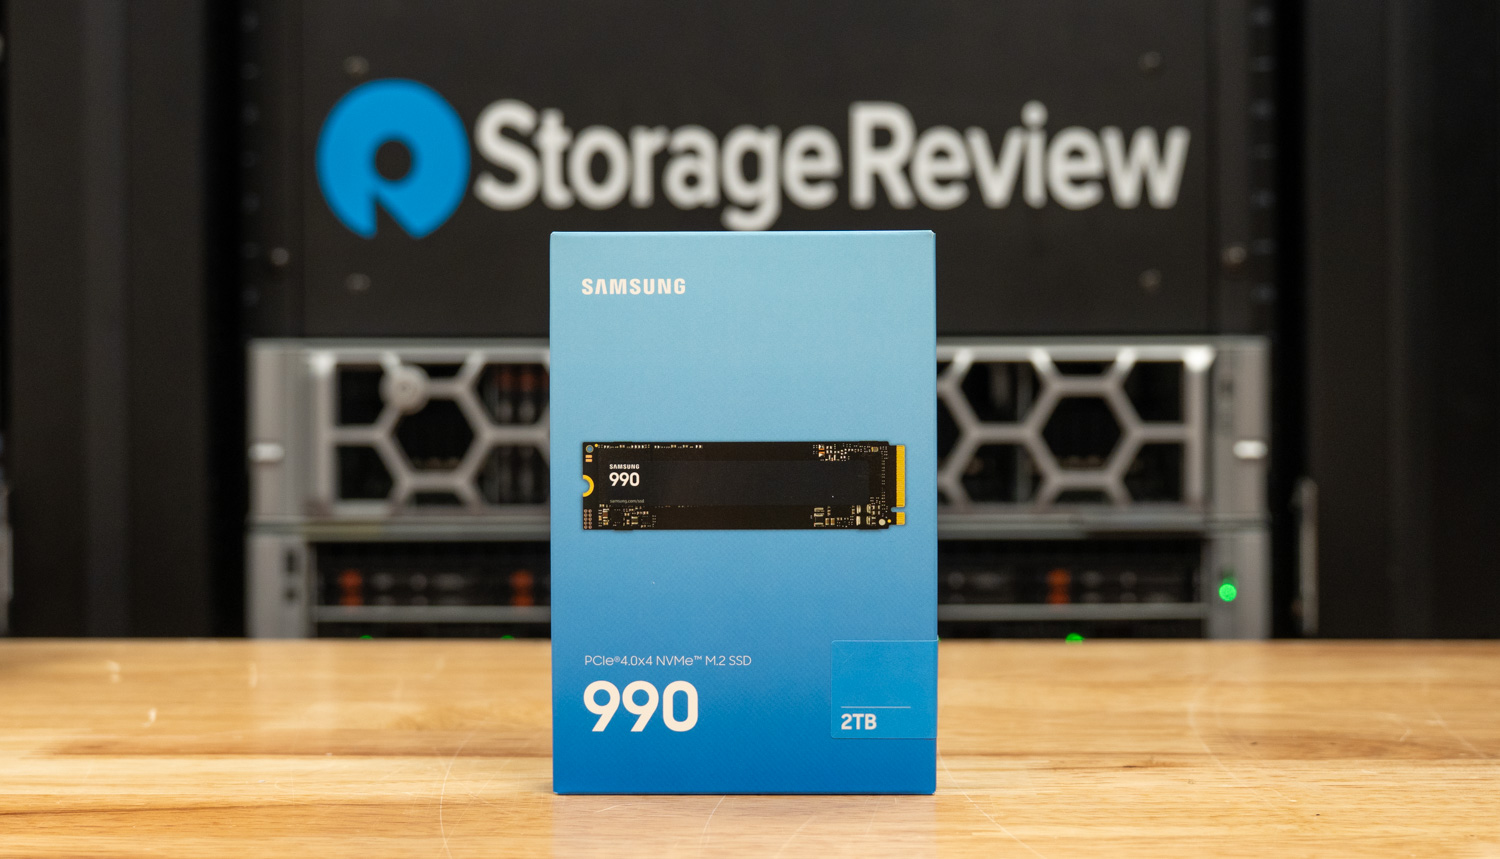
Samsung’s new 990 SSD joins the consumer lineup as a mainstream PCIe Gen4 drive that prioritizes efficiency and value over raw speed. Samsung calls it its most power-efficient SSD to date, claiming up to 38% better power efficiency than the 990 PRO. The 2TB model is rated at 7,250MB/s sequential read and 6,450MB/s write, with random I/O up to 850K IOPS read and 1,200K IOPS write. The 1TB model steps down slightly to 7,150MB/s sequential read, 700K IOPS random read, and 1,100K IOPS random write. The drive ships in 1TB and 2TB capacities at MSRPs of $269.99 and $529.99, respectively.

Samsung 990 SSD Review box hero

The name deserves a modest explanation. Samsung’s 990 family already includes the 990 PRO, 990 EVO, and 990 EVO Plus. The plain “990” now sits alongside them as an entry SSD rather than starting a new generation. It pairs a Samsung in-house controller with V-NAND (more on that later) in a DRAM-less design that relies on a Host Memory Buffer. It carries a three-year warranty, compared to the PRO’s five-year warranty, and is rated for 400TB and 800TB of writes at 1TB and 2TB capacities. Sequential read matches the 990 EVO Plus at 7,250MB/s but trails the 990 PRO’s 7,450MB/s. The 850K IOPS random read rating is well under the PRO’s 1,400K. Samsung’s pitch centers on two numbers: sequential writes are over 50% faster than the 990 EVO, and a 38% efficiency gain; 1,686MB/s per watt on 2TB reads versus 1,221MB/s per watt for the 990 PRO in Samsung’s internal testing. Buyers who prioritize outright speed already have Samsung’s Gen5 9100 PRO family, which we reviewed at launch and again in its 8TB capacity, so the 990 is not meant to compete directly with those drives.

Samsung has been down this road before. The 980, its first DRAM-less consumer NVMe drive, came through our lab in 2021 and left a poor impression. The smaller capacities, in particular, landed at the bottom of our charts, and the drive was relentlessly mocked around the lab. But the market has shifted dramatically since then. The AI buildout is soaking up NAND and DRAM supply, component pricing is climbing, and consumers are feeling the pinch across the board. In that environment, a Gen4 drive that offers solid sequential speed, low power draw, and decent capacity starts to look like a sensible choice, provided the street price cooperates.

One spec Samsung refused to provide is the NAND itself. The reviewer’s guide lists only “Samsung V-NAND.” When we asked directly, the company said it cannot disclose component details beyond official specifications, pointing us back to rated performance and its “latest Samsung V-NAND technology.” So we are left to read between the lines, which point to TLC rather than QLC. The endurance spec is the giveaway: 400TB and 800TB over a three-year warranty works out to roughly 133TB and 267TB of writes per year, essentially the same annual allowance as the 990 PRO’s 600TB and 1,200TB across five years. The likeliest answer is a lower-bin Samsung TLC V-NAND in this drive or a lower-cost, shorter-warranty option to make the drive more affordable. It’s odd that they’re being intentionally coy on what’s typically a foundational specification.

Our review unit is the 2TB model (MZ-V9V2T0), a pre-production sample running firmware 0B2QLXL7, which we put through fio, GDS, and AI model-load testing detailed below.

Samsung 990 SSD Specifications

Specification Samsung 990 1TB Samsung 990 2TB
Platform Overview
Interface PCIe 4.0 x4, NVMe 2.0 (backward compatible with PCIe 3.0)
Form Factor M.2 2280
Max 80.15 x 22.15 x 2.38 (mm)
Controller Samsung in-house controller
NAND Samsung V-NAND
Cache Memory HMB (Host Memory Buffer), DRAM-less
Model Code MZ-V9V1T0 MZ-V9V2T0
Performance
Sequential Read Up to 7,150MB/s Up to 7,250MB/s
Sequential Write Up to 6,450MB/s Up to 6,450MB/s
Random Read Up to 700K IOPS Up to 850K IOPS
Random Write Up to 1,100K IOPS Up to 1,200K IOPS
Power and Endurance
Active Power (Avg. Read) 4.0W 4.3W
Active Power (Avg. Write) 3.7W 3.8W
Idle Power (Typical) 55mW PS3 (APST on)
3mW PS4 (L1.2)
Endurance (TBW) 400TB 800TB
MTBF 1.5 million hours
Warranty 3 years limited
Features
Supporting Features TRIM (OS support required)
Garbage Collection
S.M.A.R.T.
Data Security AES 256-bit Full Disk Encryption
TCG/Opal V2.0
Encrypted Drive (IEEE1667)
Software Samsung Magician 9.0
MSRP $269.99 $529.99

Samsung 990 SSD Design and Build

The Samsung 990 uses the familiar M.2 2280 form factor, measuring up to 80.15 x 22.15 x 2.38mm. It has a single-sided design and launches without a dedicated heatsink option. This makes it a good physical fit for notebooks, compact PCs, and desktop motherboards with their own M.2 cooling. The overall construction is simple, with Samsung keeping the controller, NAND, and supporting circuitry on one side of the PCB.
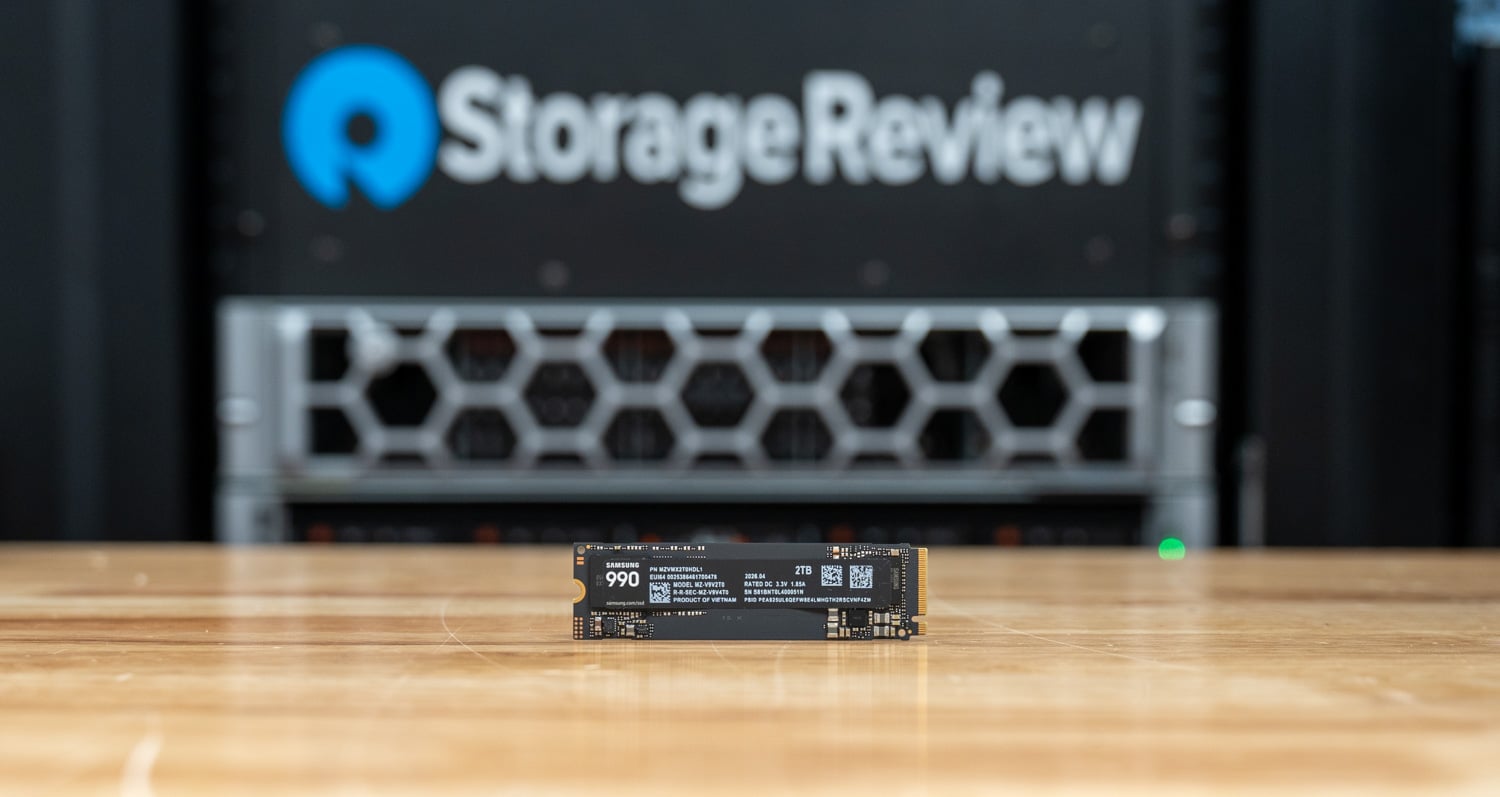
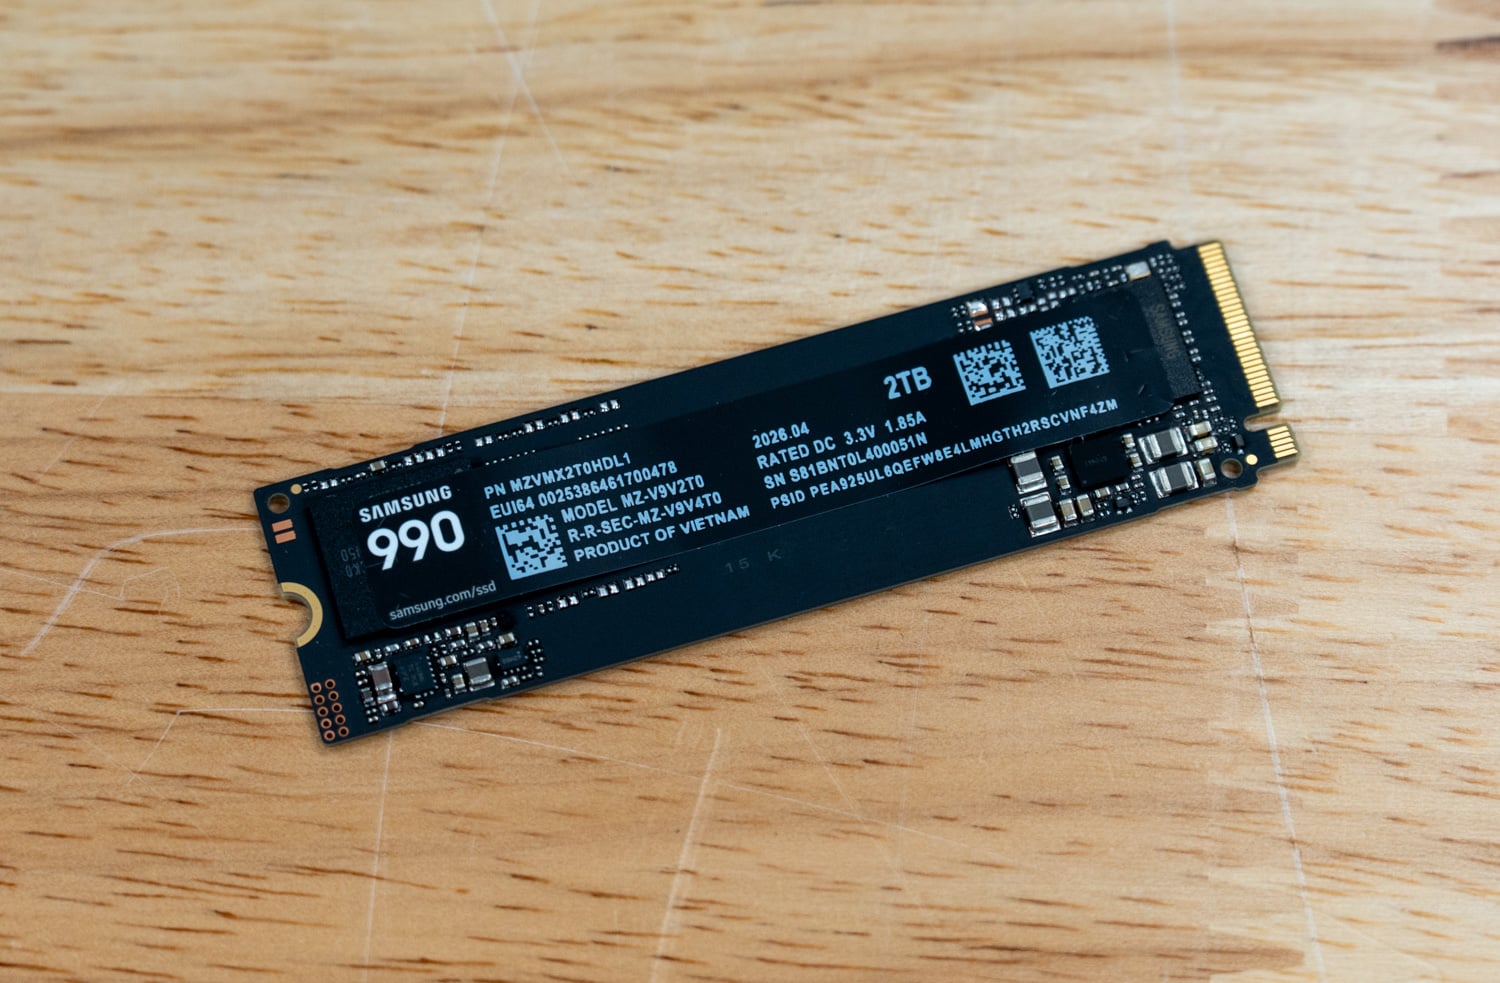
The front label displays the Samsung 990 branding, 2TB capacity, model number, firmware, and electrical specifications. There is no integrated heat spreader, so cooling relies on system airflow and an M.2 heatsink you provide.
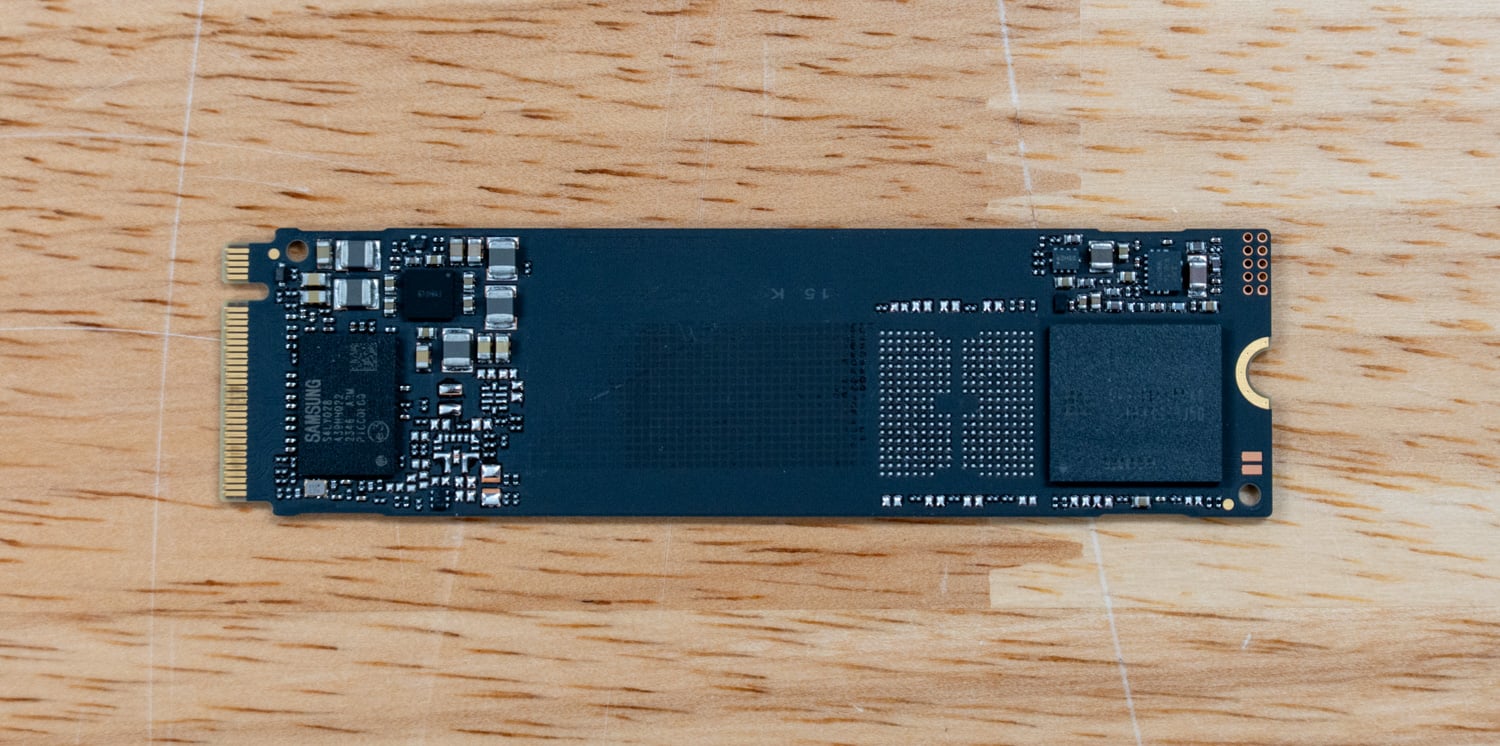
With the label removed, you can see Samsung’s in-house controller sitting close to the M.2 connector, with the power components packed around it. The NAND sits at the other end of the board, leaving quite a bit of unused space in the middle. Since this is a DRAM-less drive, there is no separate DRAM chip on the PCB.
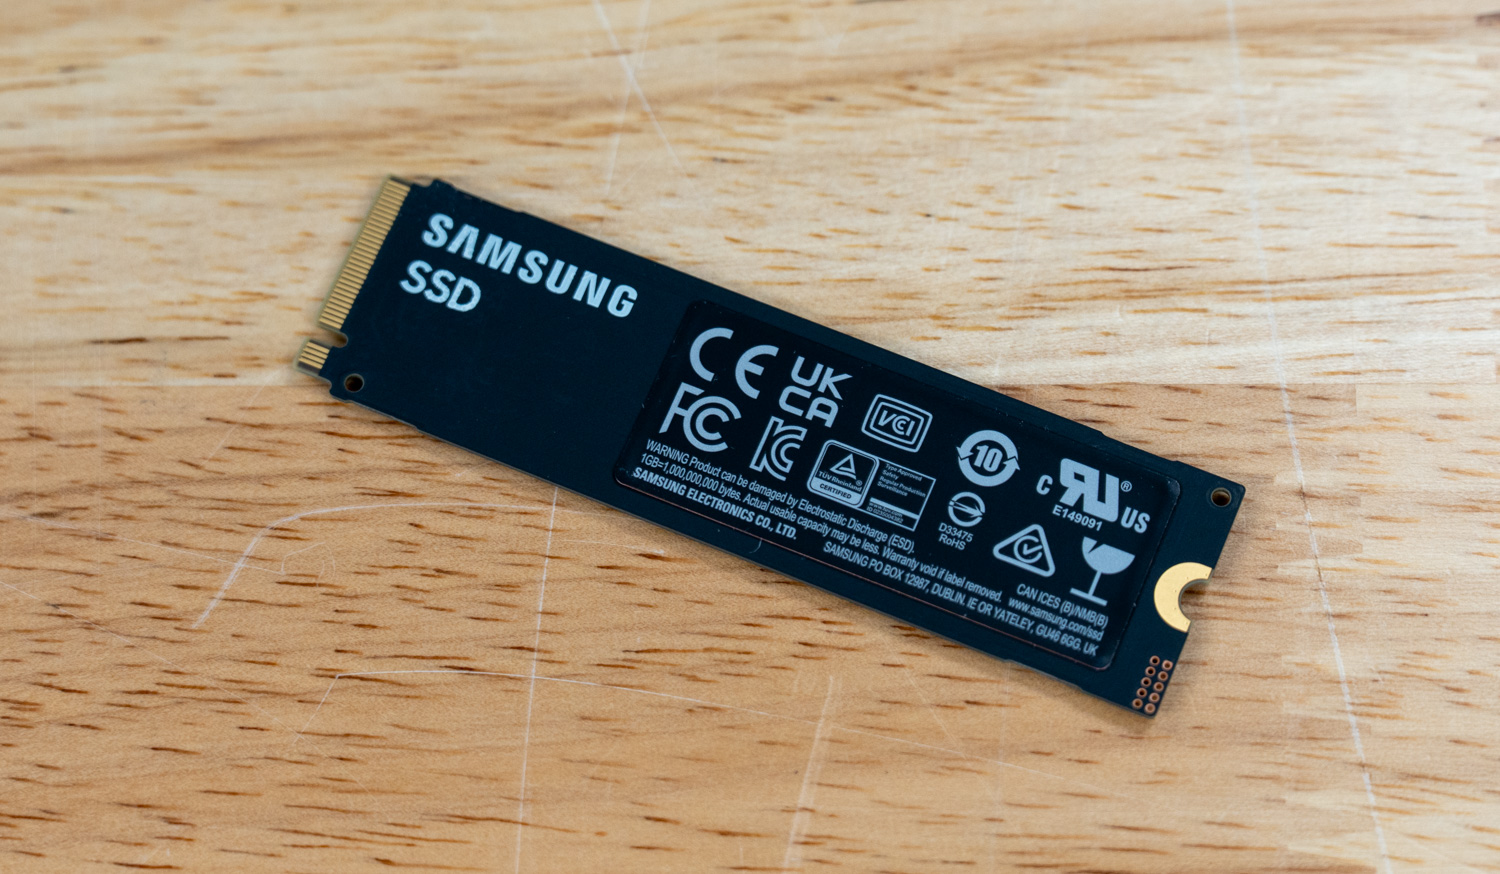

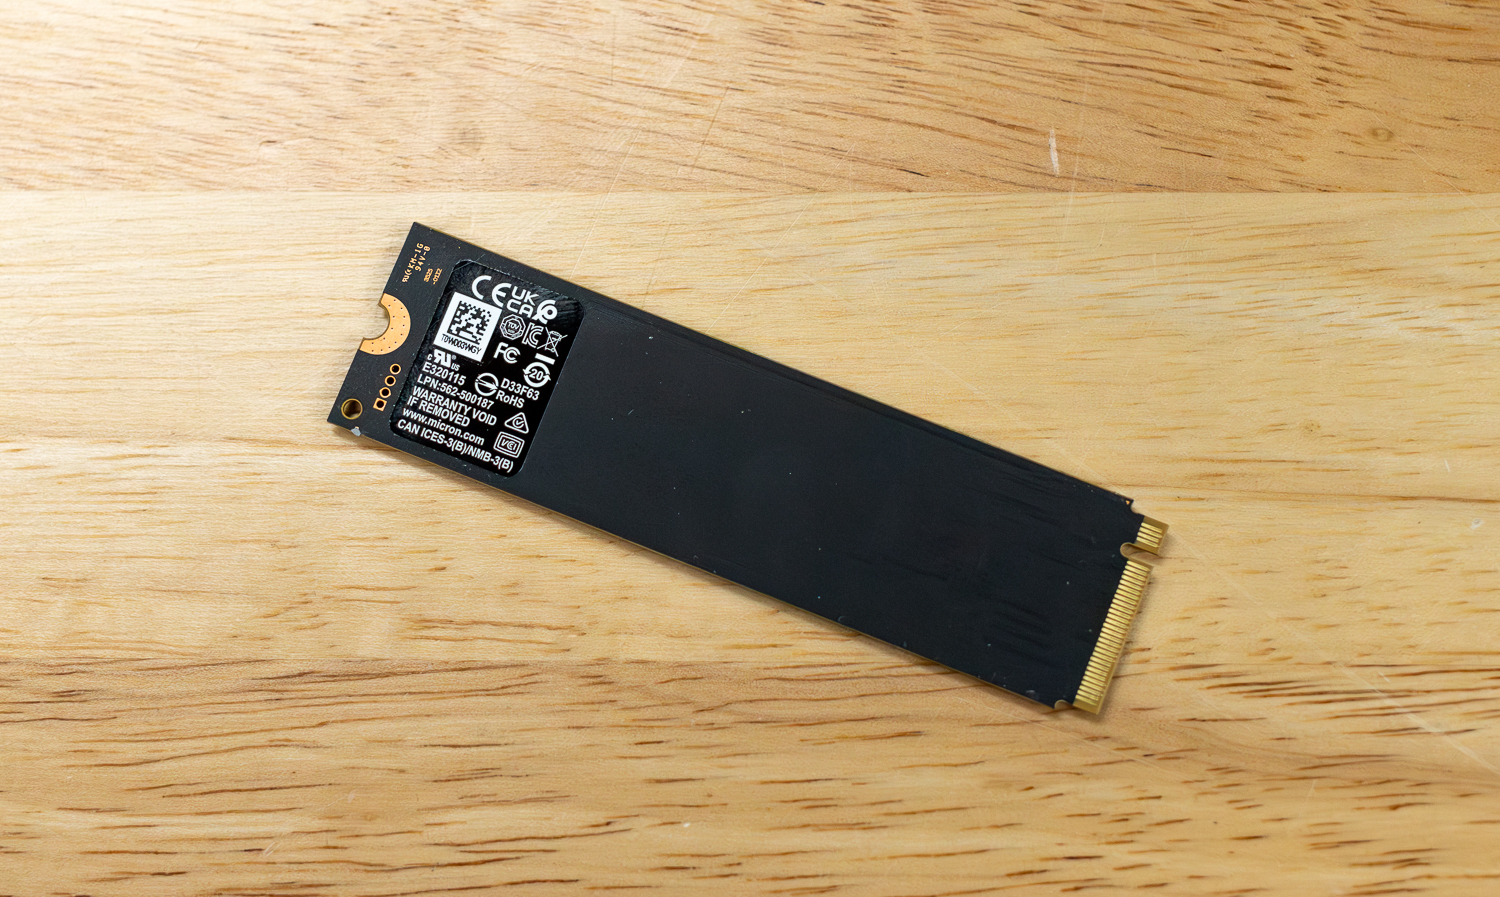
The back of the drive is mostly taken up by the regulatory label, with no active components underneath. Again, because the 990 uses a single-sided layout, it should be easier to fit in thin laptops and compact systems where space around the M.2 slot can be tight.

On the software side, the 990 is managed through Samsung Magician 9.0, which covers the essentials: firmware updates, drive health and S.M.A.R.T. monitoring, diagnostic scans, benchmarking, and secure erase, along with setup for the drive’s AES 256-bit encryption features. There’s nothing 990-specific to configure, since the HMB arrangement requires no user tuning. It’s worth installing at first boot to keep the firmware up to date, and Magician is generally a very capable tool that adds value.

Samsung 990 Performance

Peak Synthetic Performance

The FIO test is a flexible and powerful benchmarking tool for measuring the performance of storage devices, including SSDs and HDDs. It evaluates metrics such as bandwidth, IOPS, and latency under different workloads, like sequential and random read/write operations. This test helps to assess the peak performance of storage systems, making it useful for comparing different devices or configurations. We measured the peak burst performance for this test, limiting the workload to a 10GB footprint on both SSDs.

Peak Synthetic Performance: The Samsung 990 delivered 7,177 MB/s sequential read, 6,070 MB/s sequential write, 872K random read IOPS, and 1.08M random write IOPS, placing it near the bottom of this PCIe Gen4/Gen5 comparison group. Compared to the Samsung 990 Pro, the 990 trailed by about 4% in sequential read, but fell 15.7% behind in sequential write, 37.7% behind in random read IOPS, and 23.0% behind in random write IOPS. Against the fastest Gen5 drive, the SanDisk SN8100, the gap widened considerably, with the 990 delivering roughly 52% lower sequential read throughput, 57% lower sequential write throughput, 62% lower random read performance, and 50% lower random write performance.

FIO Test (higher MB/s/IOPS is better) Sequential 128K Read (1T/64Q) Sequential 128K Write (1T/64Q) Random 4K Read (16T/32Q) Random 4K Write (16T/32Q)
SanDisk SN8100 15,000MB/s (0.56ms avg latency) 14,100MB/s (0.59ms avg latency) 2.312M IOPS (0.22ms avg latency) 2.144M IOPS (0.24ms avg latency)
Kingston FURY Renegade G5 14,600MB/s (0.57ms avg latency) 14,100MB/s (0.59ms avg latency) 2.028M IOPS (0.25ms avg latency) 2.028M IOPS (0.25ms avg latency)
Samsung 9100 Pro 14,600MB/s (0.57ms avg latency) 13,300MB/s (0.63ms avg latency) 2.734M IOPS (0.18ms avg latency) 2.734M IOPS (0.19ms avg latency)
SK hynix Platinum P51 14,500MB/s (0.58ms avg latency) 13,500 MB/s (0.62ms avg latency) 2.369M IOPS (0.22ms avg latency) 2.669M IOPS (0.19ms avg latency)
Crucial T705 14,400MB/s (0.58ms avg latency) 12,300MB/s (0.68ms avg latency) 1.585M IOPS (0.32ms avg latency) 2.703M IOPS (0.19ms avg latency)
TEAMGROUP GE Pro 2TB 13,900MB/s (0.60ms avg latency) 12,800MB/s (0.65ms avg latency) 2.585M IOPS (0.23ms avg latency) 1.818M IOPS (0.28ms avg latency)
Lexar Professional NM1090 PRO 13,800MB/s (0.61ms avg latency) 13,600MB/s (0.62ms avg latency) 2.251M IOPS (0.23ms avg latency) 1.818M IOPS (0.28ms avg latency)
TEAMGROUP GC Pro 2TB 13,600MB/s (0.62ms avg latency) 12,700MB/s (0.66ms avg latency) 2.110M IOPS (0.24ms avg latency) 1.686M IOPS (0.28ms avg latency)
PNY CS2150 10,400MB/s (0.80ms avg latency) 8,801MB/s (0.95ms avg latency) 1.379M IOPS (0.371ms avg latency) 1.623M IOPS (0.32ms avg latency)
Corsair MP700 MICRO 4TB 9,169MB/s (0.91ms avg latency) 7,948MB/s (1.06ms avg latency) 1.277M IOPS (0.40ms avg latency) 1.540M IOPS (0.33ms avg latency)
Crucial P510 8,835MB/s (0.90 ms avg latency) 9,961MB/s (0.80 ms avg latency) 1.163M IOPS (0.44ms avg latency) 1.196M IOPS (0.51ms avg latency)
Micron 3610 2TB 6,839MB/s (1.23ms avg latency) 9,673MB/s (0.87ms avg latency) 1.523M IOPS (0.34ms avg latency) 1.871M IOPS (0.27ms avg latency)
Samsung 990 Pro 7,483MB/s (1.12ms avg latency) 7,197MB/s (1.16ms avg latency) 1.400M IOPS (0.36ms avg latency) 1.403M IOPS (0.36ms avg latency)
Crucial P310 2TB 7,197MB/s (1.16ms avg latency) 6,376MB/s (1.31ms avg latency) 1.163M IOPS (0.44ms avg latency) 1.196M IOPS (0.43ms avg latency)
Samsung 990 2TB 7,177MB/s (1.17ms avg latency) 6,070MB/s (1.38ms avg latency) 872K IOPS (0.59ms avg latency) 1.08M IOPS (0.47ms avg latency)
WD SN850X 2TB 6,632MB/s (0.76ms avg latency) 7,235MB/s (0.92ms avg latency) 1.2M IOPS (0.43ms avg latency) 825K IOPS (0.62ms avg latency)
Micron 2600 2TB 5,702MB/s (1.47ms avg latency) 6,612MB/s (1.27ms avg latency) 1.11M IOPS (0.46ms avg latency) 1.36M IOPS (0.38ms avg latency)

Average LLM Load Time

The Average LLM Load Time test evaluated the load times of three different LLMs: DeepSeek R1 7B, Meta Llama 3.2 11B, and DeepSeek R1 32B. Each model was tested 10 times, and the average load time was calculated. This test measures the drive’s ability to load large language models (LLMs) into memory quickly. LLM load times are critical for AI-related tasks, especially for real-time inference and processing large datasets. Faster loading enables the model to process data more quickly, thereby improving AI responsiveness and reducing wait times.

Average LLM Load Time: AI model loading was the Samsung 990’s weakest test, with the drive finishing at or near the bottom across all three workloads. It recorded 5.06 seconds for DeepSeek R1 7B, 7.61 seconds for Meta Llama 3.2 11B Vision, and 7.86 seconds for DeepSeek R1 32B. Compared to the fastest drive, the SK hynix Platinum P51, the Samsung 990 took approximately 99% longer to load the 7B model, 112% longer to load the 11B Vision model, and 88% longer to load the 32B model. The more interesting result is the Samsung 990 Pro, which lands at the bottom of these charts right alongside its value sibling: the 990 edged out the Pro by about 1% on the 7B load and trailed it by 15% on the 11B Vision model and 8% on the 32B model. Whatever Samsung’s Gen4 drives give up in this workload, they give it up together, so stepping up to the Pro buys little for AI model loading.

Average LLM Load Time (lower is better) DeepSeek R1 7B Meta Llama 3.2 11B Vision DeepSeek R1 32B
SK hynix Platinum P51 2.5481s 3.5809s 4.1790s
SanDisk SN8100 2.5702s 3.5856s 4.2870s
Samsung 9100 Pro 4TB 2.6173s 3.6017s 4.3735s
PNY CS2150 2.8107s 3.6820s 4.8962s
Crucial T705 2TB 2.8758s 3.6312s 5.1080s
Crucial P510 1TB 2.8817s 3.6631s 5.0594s
TEAMGROUP GE Pro 2TB 2.9092s 3.9136s 4.8974s
TEAMGROUP GC Pro 2TB 2.9379s 3.9267s 4.8188s
WD SN850X 2TB 3.0082s 3.6543s 5.4844s
Kingston FURY Renegade G5 3.1843s 4.8009s 4.6523s
Crucial P310 2TB 3.1889s 3.7083s 5.4844s
Lexar Professional NM1090 PRO 3.2135s 4.9504s 7.2108s
Micron 2600 2TB 3.3178s 3.9174s 5.9060s
Corsair MP700 MICRO 4TB 3.4694s 5.2106s 5.3990s
Micron 3610 2TB 3.5348s 5.3853s 5.5731s
Samsung 990 2TB 5.0645s 7.6087s 7.8619s
Samsung 990 Pro 2TB 5.1255s 6.6051s 7.3021s


One of the tests conducted on this testbench was the Magnum IO GPU Direct Storage (GDS) test. GDS is a feature developed by NVIDIA that allows GPUs to bypass the CPU when accessing data stored on NVMe drives or other high-speed storage devices. Instead of routing data through the CPU and system memory, GDS enables direct communication between the GPU and the storage device, significantly reducing latency and improving data throughput.

How GPU Direct Storage Works

Traditionally, when a GPU processes data stored on an NVMe drive, the data must first travel through the CPU and system memory before reaching the GPU. This process introduces bottlenecks because the CPU acts as a middleman, adding latency and consuming valuable system resources. GPU Direct Storage eliminates this inefficiency by enabling the GPU to access data directly from the storage device via the PCIe bus. This direct path reduces data-movement overhead, enabling faster, more efficient data transfers.

AI workloads, especially those involving deep learning, are highly data-intensive. Training large neural networks requires processing terabytes of data, and any delay in data transfer can lead to underutilized GPUs and longer training times. GPU Direct Storage addresses this challenge by ensuring that data is delivered to the GPU as quickly as possible, minimizing idle time and maximizing computational efficiency.

In addition, GDS is particularly beneficial for workloads that involve streaming large datasets, such as video processing, natural language processing, or real-time inference. By reducing the reliance on the CPU, GDS accelerates data movement and frees up CPU resources for other tasks, further enhancing overall system performance.

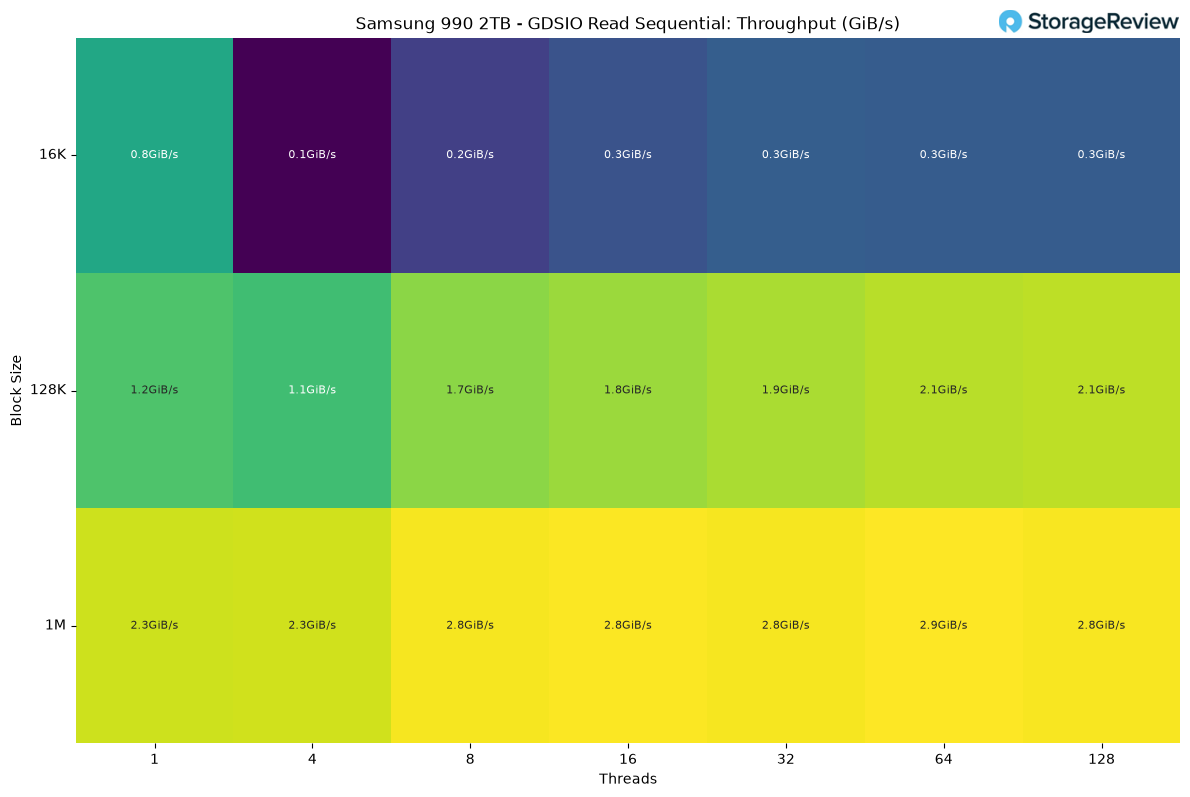
Throughput on the read side climbed steadily as thread count increased. At the 1M block size, the Samsung 990 started at 2.27 GiB/s on a single thread and peaked at 2.89 GiB/s with 64 threads, then settled to 2.79 GiB/s at 128 threads. The 128K block size followed a similar curve, increasing from 1.21 GiB/s at 1 thread to 2.12 GiB/s at 128 threads, roughly a 75% gain. The 16K block size behaved differently. It peaked at a single thread (0.82 GiB/s), dropped sharply once concurrency was introduced, and plateaued around 0.3 GiB/s from 8 threads onward. This pattern is consistent with small block I/O saturating on per-operation overhead rather than raw bandwidth.

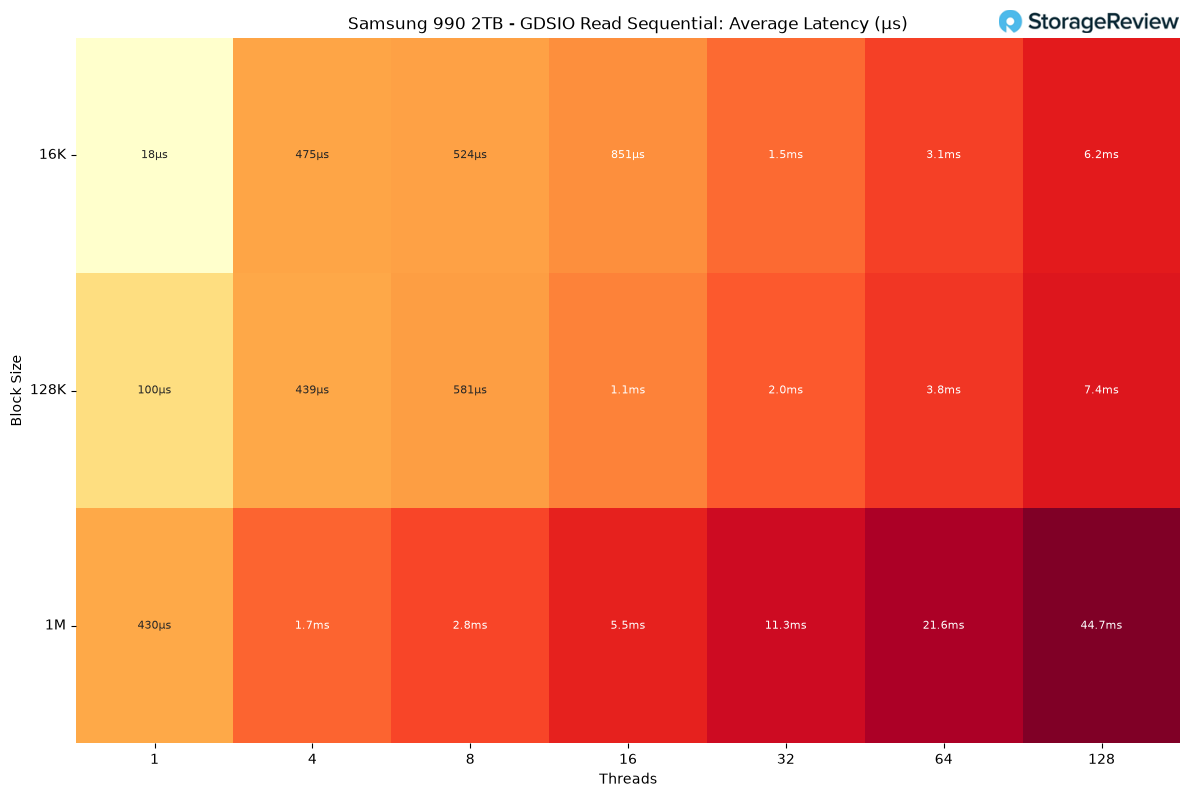
Latency scaled as expected, rising with thread count. At 1M, average latency grew from 430 microseconds on one thread to 44.7 milliseconds on 128 threads, roughly a 100x increase, reflecting increased queue depth due to more concurrent GPUDirect Storage threads. The 128K and 16K block sizes showed the same upward trend, reaching 7.4 milliseconds and 6.2 milliseconds, respectively, at 128 threads. Notably, 16K had the lowest single-thread latency of the three (18 microseconds), reflecting its smaller per-operation payload, even though its overall throughput ceiling was the lowest.
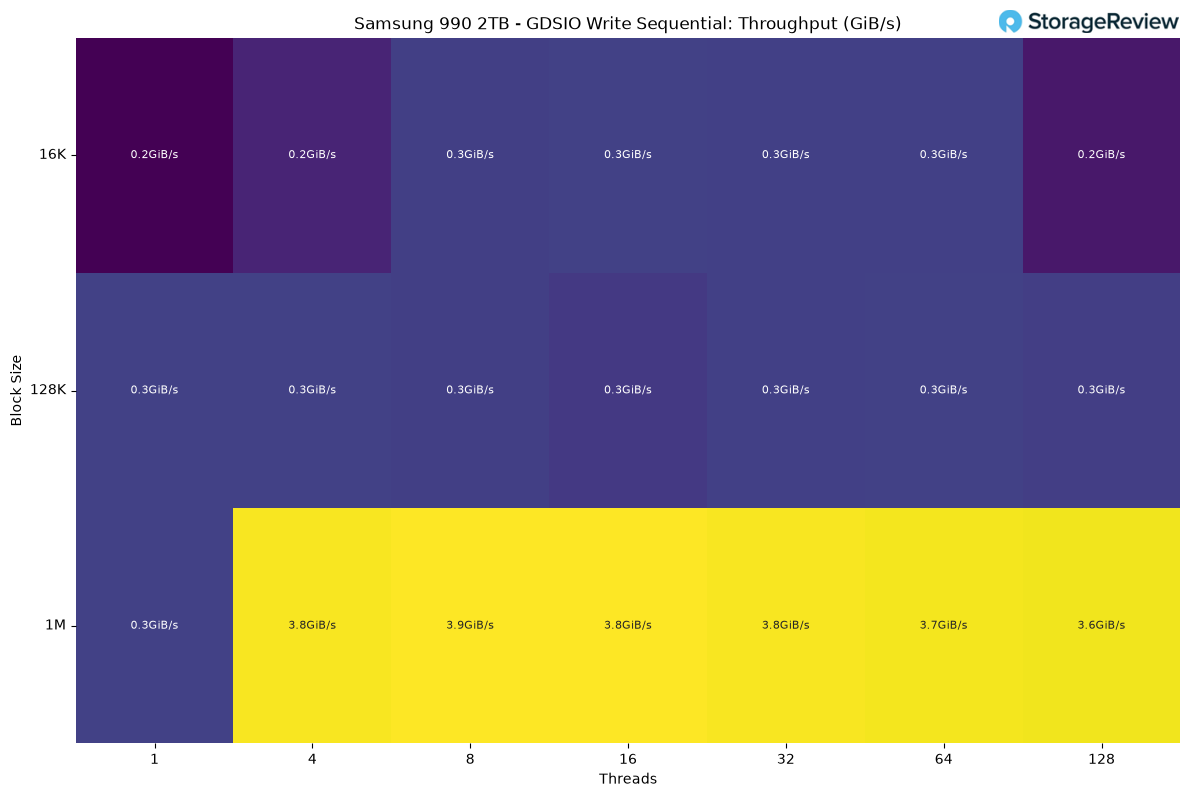
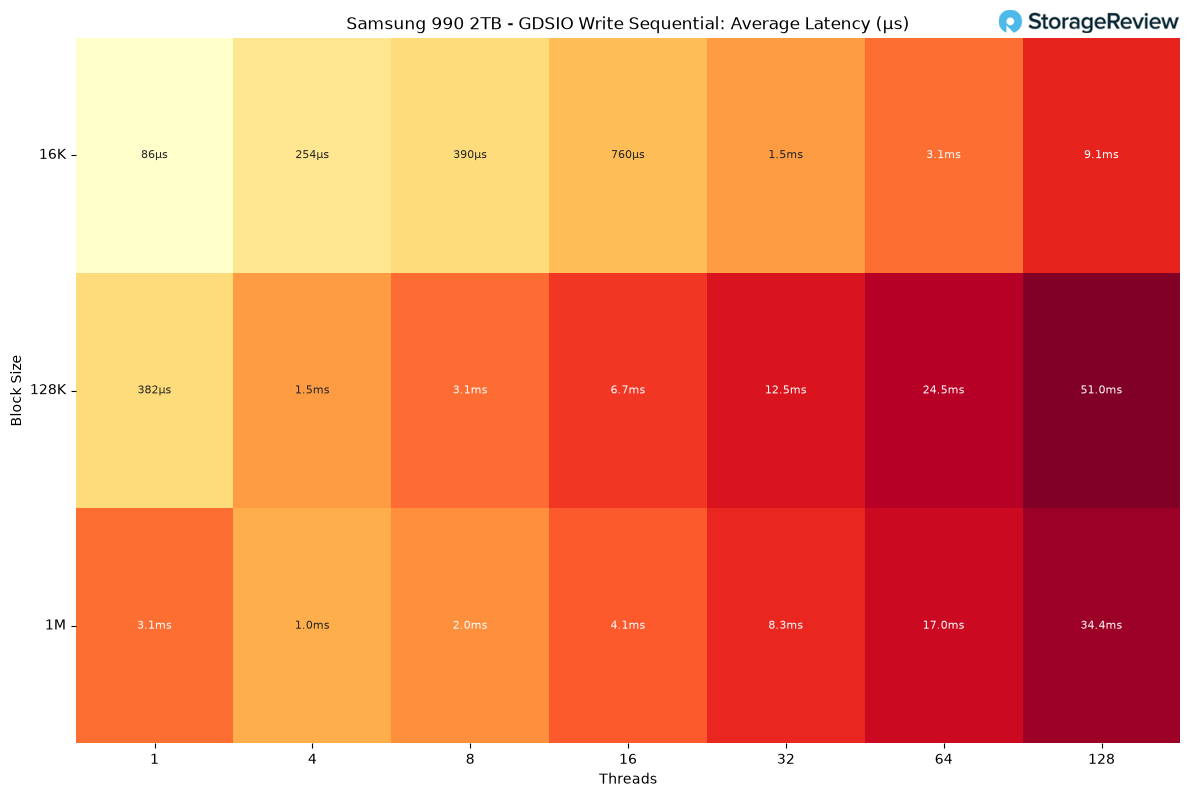
Write throughput varied by block size. The 1M block size stood out, jumping from 0.32 GiB/s at a single thread to 3.89 GiB/s at 8 threads, its peak, before tapering slightly to 3.63 GiB/s at 128 threads as queueing overhead increased. The 128K and 16K block sizes remained flat across the thread range, hovering near 0.3 GiB/s regardless of concurrency. This suggests the write path is limited by per-I/O overhead or controller queuing rather than bandwidth at those sizes.
Latency on writes rose more steeply than on reads, particularly at 128K, which climbed from 382 microseconds at one thread to 51.0 milliseconds at 128 threads, the highest figure recorded across either write or read testing. The 1M block size showed an unusual dip, with latency dropping from 3.06 milliseconds on one thread to 1.03 milliseconds on four threads, likely because the single-thread run was not yet saturating the write path, then climbing steadily to 34.4 milliseconds on 128 threads. The 16K block size stayed the most consistent, closing the sweep at 9.1 milliseconds, the lowest ceiling of the three block sizes.
Conclusion

The Samsung 990 isn’t chasing the top of the charts, and the numbers make that clear. It trailed the 990 Pro across every FIO test we ran, from a 4% gap in sequential read to a 38% deficit in random read IOPS, and fell well behind the fastest Gen4 and Gen5 drives in this comparison group. AI model loading tells a similar story, with the 990 and 990 Pro finishing at the bottom of the field together; the 990 actually edged its Pro sibling on the DeepSeek R1 7B load while trailing by 8 to 15% on the larger models. Buyers who need peak throughput for demanding workloads should look elsewhere in Samsung’s lineup, starting with the Gen5 9100 Pro.
That said, judging the 990 against the fastest drives on the market misses the point of the drive. This is a mainstream Gen4 SSD built around efficiency and value, not benchmark supremacy, and compared to its real predecessor, the 990 EVO, it’s a solid upgrade. Sequential writes are more than 50% faster, power efficiency is up 38% by Samsung’s own numbers, and the drive still delivers sequential read speeds in line with the 990 EVO Plus. Samsung chose to stay quiet on the NAND itself, but the endurance ratings suggest a competent TLC implementation rather than a QLC design.

For buyers who don’t need Gen5 speeds or Pro-tier random I/O, and who want a dependable, power-efficient Gen4 drive at a workable price, the 990 is a sensible upgrade path from the EVO line. Notably, stepping up to the 990 Pro buys nothing for AI model loading, so the choice between the two comes down to random I/O and sustained writes rather than anything AI-related. At $269.99 for 1TB and $529.99 for 2TB, the MSRPs reflect the current memory market more than the drive’s entry positioning, so the 990’s value case will ultimately be set by street prices. It’s not the drive to buy if raw performance is the priority, but it does what it’s meant to do.

Product Page – Samsung 990

The post Samsung 990 SSD Review: A Value Gen4 SSD for Expensive Times appeared first on StorageReview.com.
Sandisk Expands Optimus SSD Lineup with New PS5 and ROG Xbox Ally Storage Options

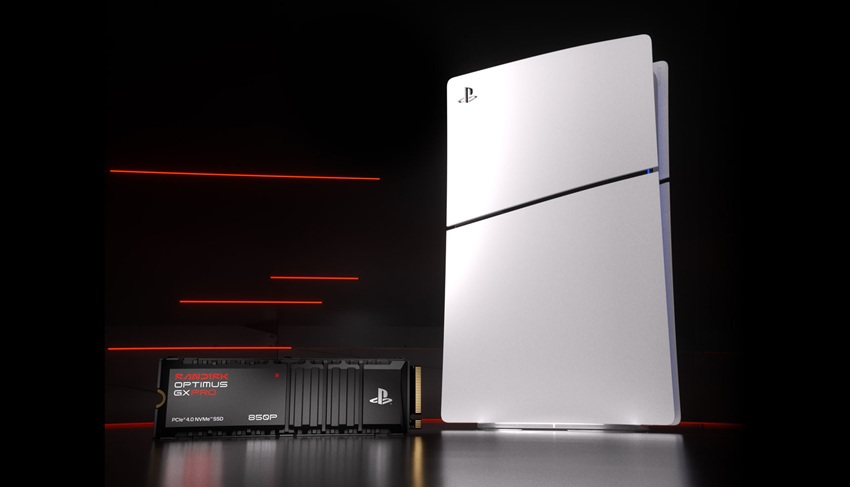
Sandisk Optimus GX Pro 850P next to PS5 Sandisk Optimus GX Pro 850P next to PS5

Sandisk has expanded its Optimus gaming SSD lineup with the new SANDISK Optimus GX PRO 850P NVMe SSD for PS5 consoles, alongside the SANDISK Optimus GX 7100X NVMe SSD for ROG Xbox Ally X and PC. The company also announced availability for several other Optimus drives.

Sandisk Optimus GX PRO 850P NVMe SSD

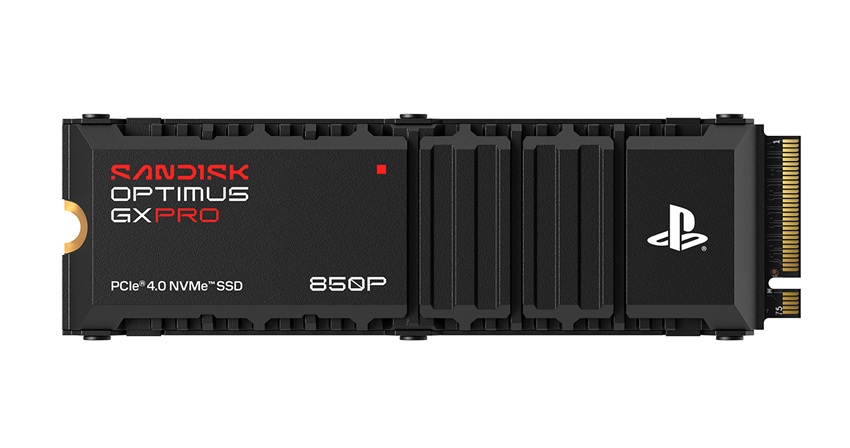
The Sandisk Optimus GX PRO 850P NVMe SSD is officially licensed for PlayStation 5 and PlayStation 5 Pro, with testing and certification for Sony’s console platform. It also features an exclusive heatsink design with PlayStation branding, which is built for the PS5 M.2 slot, so buyers do not need to add a separate heatsink.

Sandisk Optimus GX Pro 850P next to PS5

With game install sizes, updates, and DLC continuing to eat into console storage, the Optimus GX PRO 850P is designed for users who want to keep more titles installed and ready to play. Sandisk lists capacities up to 8TB, giving PS5 owners enough room for much larger game libraries while reducing the need to delete older titles to make space for new releases. The drive supports playing games directly from the SSD once installed, which makes it a direct expansion option rather than just a place to store inactive games.

Sandisk Optimus GX Pro 850P

Performance is based on PCIe Gen 4.0 NVMe technology, with Sandisk quoting sequential speeds of up to 7,300MB/s read and 6,600MB/s write, depending on capacity. For the 1TB model, Sandisk lists up to 7,300MB/s sequential read and 6,300 MB/s sequential write, along with 800K random read IOPS and 1.1M random write IOPS. The 1TB model is also rated for 600TBW endurance and carries a five-year limited warranty.

Although the 850P is mainly marketed as a PS5 and PS5 Pro upgrade, Sandisk also lists compatibility with computers that have an M.2 M-key slot and support the M.2 2280 form factor, along with Windows 10 and newer.

Sandisk Optimus GX 7100X NVMe SSD

The Sandisk Optimus GX 7100X NVMe SSD gives ROG Xbox Ally, ROG Xbox Ally X, and PC users an officially licensed storage upgrade built for portable gaming and larger game libraries. It supports capacities up to 4TB, giving players more room for Xbox titles, updates, DLC, and Game Pass downloads without constantly managing installs. Sandisk also includes a one-month Xbox Game Pass Ultimate trial in the box.
SanDisk Optimus GX 7100X

Performance comes from a PCIe 4.0 NVMe interface, with Sandisk listing sequential read and write speeds of up to 7,250 MB/s and 6,900 MB/s on the 2TB model. The 2TB model is also rated for up to 1M random read IOPS and 1.4M random write IOPS, uses the M.2 2280 form factor, measures 3.15 x 0.87 x 0.09 inches, and features a five-year limited warranty.

The Optimus GX 7100X is also power-efficient, which is especially relevant for handheld gaming PCs, where power draw can affect battery life. The drive is also built with SanDisk’s 8th-generation BiCS TLC 3D CBA NAND and is tested for ROG Xbox Ally, ROG Xbox Ally X, and PC use.

Metric/Field SANDISK Optimus GX PRO 850P NVMe SSD SANDISK Optimus GX 7100X NVMe SSD
Overview
Product Name SANDISK Optimus GX PRO 850P NVMe SSD for PS5 consoles SANDISK Optimus GX 7100X NVMe SSD for ROG XBOX Ally X and PC
Positioning Officially licensed for PlayStation 5 and PlayStation 5 Pro consoles Officially licensed storage for ROG XBOX Ally, ROG XBOX Ally X, and PC
Maximum Capacity Up to 8TB Up to 4TB
Form Factor M.2 2280 M.2 2280
Performance
Interface PCIe 4.0 NVMe PCIe 4.0 NVMe
Sequential Read Performance 7,300MB/s 7,250MB/s
Sequential Write Performance 6,300MB/s 6,900MB/s
Maximum Sequential Read/Write Speeds Up to 7,300/6,600 MB/s Up to 7,250/6,900 MB/s
Random Read 800K IOPS 1M IOPS
Random Write 1.1M IOPS 1.4M IOPS
Hardware and Design
Heatsink Integrated heatsink
Exclusive heatsink design featuring the PlayStation logo
Optimized for the PlayStation 5 and PlayStation 5 Pro consoles’ M.2 slot
Not specified
NAND Not specified Sandisk’s 8th generation BiCS TLC 3D CBA NAND
Power Efficiency Not specified Designed for power efficiency for low-power consumption for laptops and ROG XBOX Ally X
Physical Specifications
Dimensions (L x W x H) 3.15″ x 0.96″ x 0.39″ 3.15″ x 0.87″ x 0.09″
Weight 30.4gms Not specified
Reliability
Warranty 5-Year Limited Warranty 5-Year Limited Warranty
Endurance (TBW) 600 1,200
Operating Temperature 0°C to 85°C N/A
Non-Operating Temperature -40°C to 85°C N/A
Compatibility
Primary Compatibility PlayStation 5 and PlayStation 5 Pro ROG XBOX Ally, ROG XBOX Ally X, and PC
PC Compatibility Computers with M.2 (M-key) port (Capable of taking M.2 2280 form factor)
Windows 10+
PC laptops
ROG XBOX Ally
ROG XBOX Ally X
Product Features
Features Experience high-speed gaming SSD with PCIe 4.0 technology.
New SSD heatsink design specifically built for PS5 and PS5 Pro consoles.
Download and play games directly off the drive.
Equipped with PCIe 4.0 interface provides the speed and power for on-the-go XBOX gaming.
Designed for power efficiency for low-power consumption for laptops and ROG XBOX Ally X.
Endurance of up to 2,400 TBW.
Included Offer N/A 1-month trial of XBOX Game Pass Ultimate inside the box
Model and Availability
Model Number SDSG81100TAH-000E0 SDSG71200TAN-000G0
Starting Price $474.99 $799.99
Availability Sandisk store and select retailers Sandisk store and select retailers

Availability and Pricing

The Sandisk Optimus GX PRO 850P NVMe SSD for PS5 consoles is available now through the Sandisk store and select retailers, with pricing starting at $474.99.

Pricing for the Sandisk Optimus GX 7100X NVMe SSD starts at $799.99, with availability now through the Sandisk store and select retailers.

Other Releases

Alongside these launches, the broader Sandisk Optimus lineup is now available through the Sandisk store and select retailers, including:

  • SANDISK Optimus GX PRO 8100 NVMe SSD: Designed for professionals, gamers, and creators, the GX PRO 8100 is positioned as a high-performance PCIe 5.0 drive for demanding AI workflows, intensive gaming, and creative workloads. Pricing starts at $524.99.
  • SANDISK Optimus GX PRO 850X NVMe SSD: Built for users who need high-capacity storage for gaming and creative applications, the GX PRO 850X offers capacities up to 8TB for larger game libraries, applications, and project files. Pricing starts at $488.99.
  • SANDISK Optimus GX 7100 NVMe SSD: The GX 7100 is designed for laptops and handheld gaming consoles, using a power-efficient architecture for gaming sessions and creative workflows on the move. Pricing starts at $207.99.
  • SANDISK Optimus GX 7100M NVMe SSD: Built for portable systems, the GX 7100M supports upgrades for compatible Steam Deck, MSI Claw, Microsoft Surface, and Dell laptop systems, with capacities up to 2TB for modern AAA games. Pricing starts at $387.99.
  • SANDISK Optimus 5110 NVMe SSD: Planned for release later this year, the Optimus 5110 targets creators seeking faster application launches, greater capacity, and more room for high-resolution video and image files.

The post Sandisk Expands Optimus SSD Lineup with New PS5 and ROG Xbox Ally Storage Options appeared first on StorageReview.com.
Silicon Motion Introduces SM2524XT PCIe Gen5 DRAM-less SSD Controller

SM2524XT power efficiency SM2524XT power efficiency

Silicon Motion has introduced the SM2524XT, a PCIe Gen5 DRAM-less SSD controller targeting AI PCs, edge AI systems, and workloads centered on local AI inference. The controller is engineered to meet the storage demands of KV cache-intensive workloads, where sustained random I/O performance and low-latency access are increasingly critical for continuous inference.SM2524XT front

Silicon Motion says that the SM2524XT can deliver sequential read speeds of up to 14GB/s, sequential write speeds of up to 12GB/s, and random performance reaching up to 2.5 million IOPS. The controller was built to maintain stable throughput under fragmented, latency-sensitive access patterns commonly associated with AI inference workloads.

Specification Silicon Motion SM2524XT
Overview
Product Type PCIe Gen5 DRAM-less SSD controller
Target Workloads AI PCs, edge AI, AI inference, and KV Cache-intensive workloads
Primary Focus Sustained random I/O performance and low-latency AI inference workloads
Interface and Architecture
PCIe Interface PCIe Gen5 x4
NVMe Support NVMe 2.1
CPU Architecture Quad-core Arm Cortex-R8
NAND Channels 4 NAND channels
NAND Interface Speed Up to 4,800 MT/s
Performance and Power
Sequential Read Speed Up to 14 GB/s
Sequential Write Speed Up to 12 GB/s
Random Performance Up to 2.5 million IOPS
Power Consumption Below 5W SSD power
Performance-Per-Watt Improvement Up to 25% over the previous generation
Process and Technologies
Manufacturing Process TSMC 6nm
Key Technologies SCA (Separated Command Address), advanced FTL scheduling, NANDXtend LDPC ECC
Error Correction 4KB LDPC ECC capability with NANDXtend technology
Voltage Optimization PI-LTT low-voltage NAND I/O optimization


KV Cache Workloads Drive Higher Storage Demands

AI inference workloads exhibit different storage behavior than that of more traditional consumer SSDs. Instead of relying mainly on burst-oriented sequential transfers, KV Cache operations create continuous streams of fragmented random reads and writes that depend heavily on sustained IOPS throughput and low-latency access.

Silicon Motion describes KV Cache as one of the growing storage bottlenecks in AI PCs, particularly as larger local language models and AI agents move more context data from memory into local NVMe SSD storage. The SM2524XT was designed to maintain consistent random I/O performance during sustained inference sessions where storage responsiveness becomes critical.

PCIe Gen5 Interface And Four-Core Architecture

The SM2524XT uses a PCIe Gen5 x4 interface with NVMe 2.1 support and includes a quad-core Arm Cortex-R8 processor architecture. The controller supports four NAND channels with interface speeds up to 4,800MT/s and is manufactured using TSMC’s 6nm process technology.

The architecture also incorporates Silicon Motion’s Separated Command Address technology, or SCA, which separates command and address handling to improve NAND access efficiency. This design should help improve the efficiency of parallel data processing and reduce latency interruptions during sustained AI workloads.

Additional technologies integrated into the controller include advanced FTL scheduling and NANDXtend LDPC ECC error correction. Silicon Motion says these features will maintain more consistent performance and improve reliability during continuous inference.

Power Efficiency

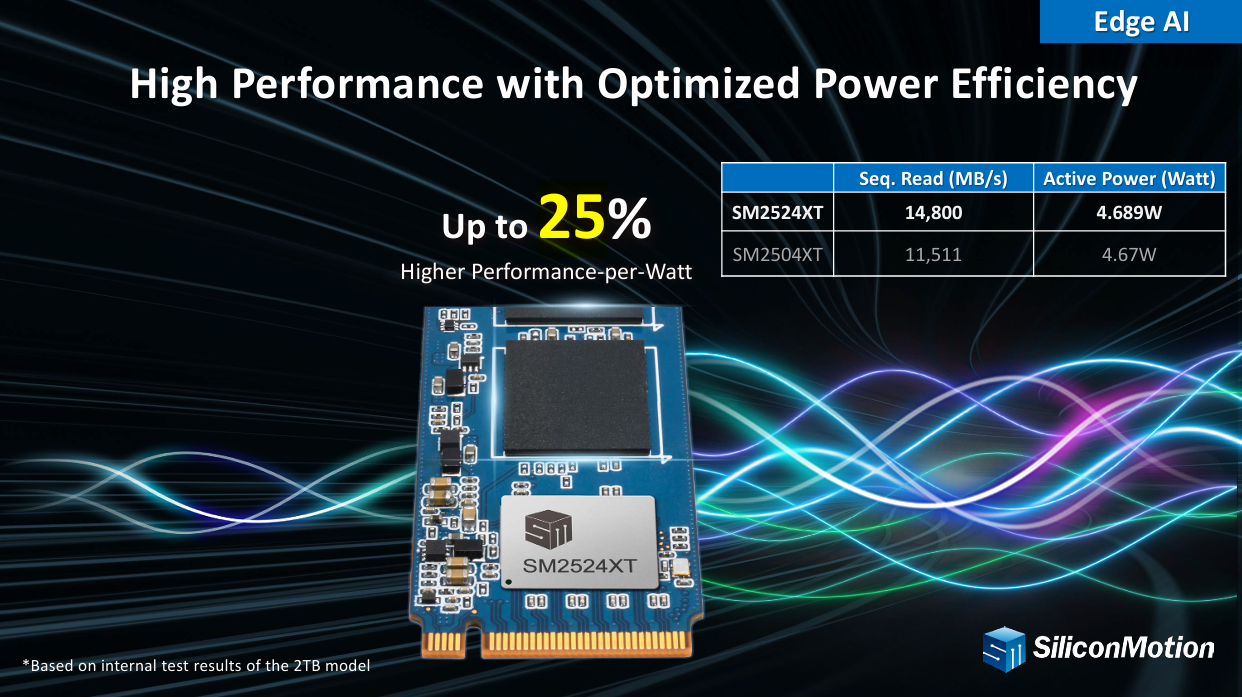
Power efficiency is also important in the overall SM2524XT design, as Silicon Motion states that the controller delivers up to 25% higher performance-per-watt than the previous generation while keeping SSD power consumption below 5W.

SM2524XT power efficiency

The controller combines the 6nm manufacturing process with Silicon Motion’s PI-LTT voltage optimization technology, which lowers NAND I/O voltage to reduce power usage during sustained workloads. Silicon Motion also compares the SM2524XT against the earlier SM2504XT controller and reports higher sequential read throughput at similar active power levels.

Positioned Around Edge AI And Local Inference

Silicon Motion says the SM2524XT targets AI PCs and edge AI systems, where inference workloads increasingly run locally rather than relying entirely on cloud infrastructure. Workloads tied to enterprise AI agents, robotics, manufacturing systems, science applications, and AI coding environments are also relevant use cases for the SM2524XT.

The post Silicon Motion Introduces SM2524XT PCIe Gen5 DRAM-less SSD Controller appeared first on StorageReview.com.
KIOXIA Announces XG10 Series PCIe 5.0 Client SSDs for OEM PCs

KIOXIA XB10 SSD KIOXIA XB10 SSD

KIOXIA America has introduced the XG10 Series, a new client NVMe SSD family aimed at performance-class OEM notebooks, desktops, and workstations. As the successor to the XG8 Series, the XG10 moves to a PCIe 5.0 x4 interface and NVMe 2.0d, giving KIOXIA a Gen5 client drive designed for heavier local workloads such as AI-assisted applications, content creation, and high-end gaming.

The headline change is the jump to PCIe Gen5 bandwidth. In a four-lane client configuration, PCIe 5.0 roughly doubles the available host interface bandwidth over PCIe 4.0, which helps explain the step up in both sequential and random performance. KIOXIA rates the XG10 at up to 14,000 MB/s read and 12,000 MB/s write, with random performance up to 2,000K IOPS read and 1,600K IOPS write. Compared with the prior XG8 generation, the company says the new drive delivers up to 2x faster sequential reads, more than 2x faster sequential writes, roughly 122% higher random reads, and about 158% higher random writes.

KIOXIA XB10 SSD

That performance profile puts the XG10 squarely in the upper tier of client storage, especially for systems expected to process large data sets locally. For workstation-class laptops and AI PCs, higher sequential throughput can help with moving large project files, model assets, and media libraries. At the same time, stronger random performance is more relevant to application responsiveness, asset loading, and scratch-disk behavior. In gaming systems, the gains are more likely to show up in load times, patch installs, and background asset streaming than directly in frame rates.

Comparison to KIOXIA’s Recently Launched Client SSDs

EG7 BG8 XG10
Swimlane/Target Value Mainstream Performance
Form Factors M.2 Type 2230, 2242, 2280 2230, 2242, 2280 2280
Flash Memory Type BiCS FLASH gen. 8 QLC BiCS FLASH gen. 8 TLC BiCS FLASH gen. 8 TLC
(512GB and 1024GB use BiCS FLASH gen. 6 TLC)
NAND Package 1pkg NAND Flash Placement 1pkg NAND Flash Placement 2pkg NAND Flash Placement
Interface PCIe®Gen4 x4, NVMe 2.0d PCIe Gen5 x4, NVMe 2.0d PCIe Gen5 x4, NVMe 2.0d
SoC 4ch SoC design without DRAM (HMB) 4ch SoC design without DRAM (HMB) 8ch SoC design with DRAM
Capacities 512 GB, 1024 GB, 2048 GB 512 GB, 1024 GB, 2048 GB 512 GB, 1024 GB, 2048 GB, 4096 GB
Max Seq. Read 7,000 MB/s 10,300 MB/s 14,000 MB/s
Max Seq. Write 6,200 MB/s 10,000 MB/s 12,000 MB/s
Max Random Read 1,000 KIOPS 1,435 KIOPS 2,000 KIOPS
Max Random Write 1,000 KIOPS 1,300 KIOPS 1,600 KIOPS
Active Power 4.5 W 5 W 10 W
Endurance (1024GB) 600 TBW 1,200 TBW 1,200 TBW


The XG10 Series will ship in the standard M.2 2280 form factor with capacities of 512GB, 1TB, 2TB, and 4TB. KIOXIA is also including support for self-encrypting drive functionality based on TCG Opal 2.02, a feature that remains relevant for OEMs building commercial client systems that require hardware-based data-at-rest protection and policy-based fleet management. That makes the XG10 a better fit not just for enthusiast-class hardware, but also for business notebooks and mobile workstations where security and manageability matter.

KIOXIA is positioning the XG10 for high-performance PCs, including AI PCs, workstations, and gaming platforms. That aligns with where Gen5 client SSDs are most practical today. While PCIe 5.0 brings clear bandwidth advantages, sustained performance in client systems still depends heavily on platform thermals, power delivery, and OEM tuning, particularly in thinner notebook designs. In larger mobile workstations and desktops, those constraints are typically easier to manage.

In its announcement, KIOXIA said PCIe 5.0 is a meaningful step forward for client storage and framed the XG10 as a response to increasingly demanding workloads across creator, gaming, and professional systems. The company is currently sampling the new SSDs to select PC OEM customers, with end-system shipments expected to begin in the second quarter of 2026.


The post KIOXIA Announces XG10 Series PCIe 5.0 Client SSDs for OEM PCs appeared first on StorageReview.com.
KIOXIA Launches BG8 Client SSDs For Mainstream PC OEMs

KIOXIA BG8 KIOXIA BG8

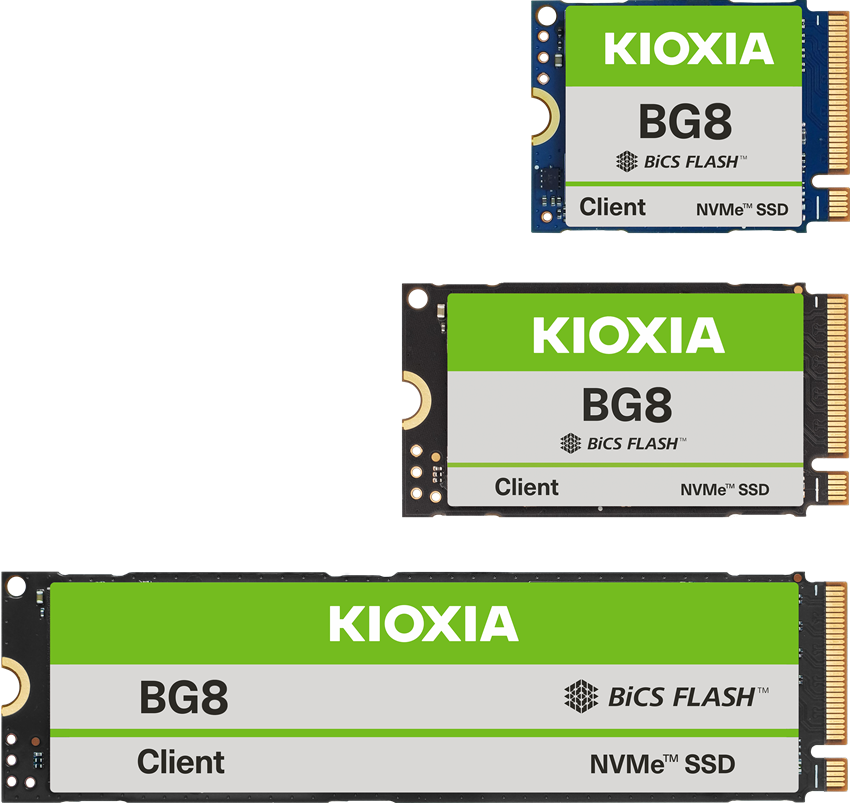
KIOXIA has introduced the BG8 Series, a new client SSD line aimed at PC OEMs that brings the PCIe Gen5 interface into more mainstream systems. The lineup is designed for a broad range of everyday computing hardware, including slim laptops, consumer and commercial notebooks, and desktop PCs.

KIOXIA BG8

KIOXIA BG8 Features and Performance

KIOXIA’s BG8 Series features 8th-generation BiCS FLASH TLC 3D flash memory, which improves both speed and power efficiency over the previous generation. KIOXIA indicates performance gains of up to 47% in sequential read, 67% in sequential write, 44% in random read, and 30% in random write, with that comparison tied specifically to its earlier generation based on BiCS FLASH generation 5 memory.

For raw throughput, the company says the BG8 Series can reach sequential read speeds of up to 10,300MB/s and sequential write speeds of up to 10,000MB/s. Random performance is rated at up to 1.4 million read IOPS and 1.3 million write IOPS, figures that place the drive in the high end of client storage performance, even though the product itself is meant for mainstream PC designs. KIOXIA says this combination enables OEMs to build faster, more responsive PCs across a wider range of workloads.

The BG8 is a DRAM-less SSD, so instead of onboard DRAM, it uses Host Memory Buffer support, which allows the drive to tap the host system’s memory to help balance speed, power use, and cost. DRAM-less SSDs have often involved compromises, especially under heavier workloads. KIOXIA is essentially using the BG8 to enable faster PCIe Gen5 speeds while maintaining the cost and power efficiency that matter for mainstream PC designs.

KIOXIA BG8 Form Factors, Capacities, and Compliance

KIOXIA will ship the drives in multiple M.2 form factors, including Type 2230, Type 2242, and Type 2280, giving OEMs the flexibility to use the same family across compact and standard layouts. That range is particularly useful for thin-and-light laptops and other systems where board space and mounting constraints vary from one product design to another.

In terms of standards support, the new SSD is compliant with PCIe Gen5 in a Gen5 x4 configuration and NVMe 2.0d. KIOXIA is also offering Self-Encrypting Drive support based on Trusted Computing Group Opal version 2.02, although the document notes that availability of SED models may vary by region.

Capacity options listed for the BG8 Series are 512GB, 1TB, and 2TB.

KIOXIA BG8 Availability

The BG8 Series is currently sampling to select PC OEM customers. Systems using the new SSD are expected to begin shipping in the 2nd quarter of 2026, which means the first commercial appearances should come through finished PCs rather than retail-branded standalone drives.

KIOXIA Client SSDs

The post KIOXIA Launches BG8 Client SSDs For Mainstream PC OEMs appeared first on StorageReview.com.
KIOXIA EG7 Series SSDs Bring QLC Storage to Mainstream PCs

KIOXIA EG7 Series KIOXIA EG7 Series

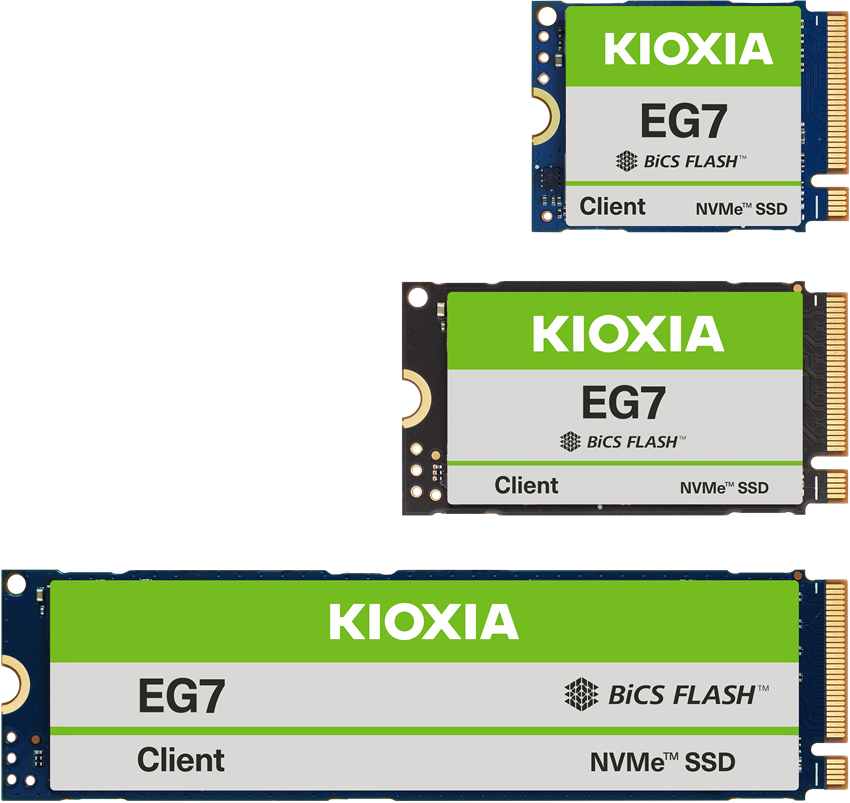
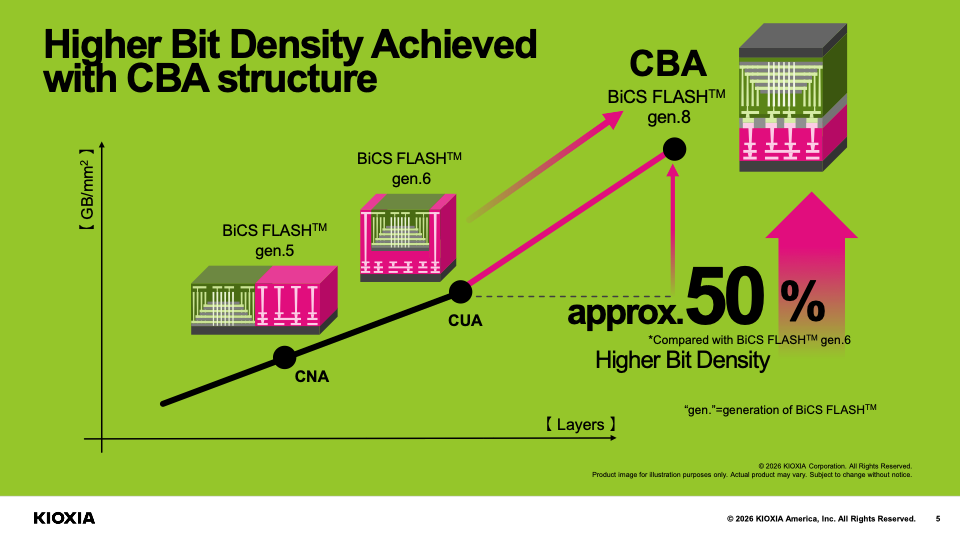
KIOXIA America has unveiled the EG7 Series, a new family of client SSDs that brings its BiCS FLASH generation 8 QLC with CMOS directly Bonded to Array (CBA) technology to this segment for the first time. KIOXIA says the new series is designed to help PC manufacturers bring high-performance, power-efficient storage to a wider range of systems at a more accessible price point. Capacity options will include 512GB, 1TB, and 2TB models.

KIOXIA EG7 Series

KIOXIA EG7 Series Performance and Main Features

The EG7 Series uses 4-bit-per-cell (quadruple-level cell) NAND flash. QLC storage is typically used in lower-cost systems, though it has long faced skepticism about whether it can keep pace with TLC-based drives in everyday performance. KIOXIA is positioning the EG7 Series as a response to that skepticism, saying the new SSDs can deliver TLC-level performance while lowering the total cost of ownership for PC makers building mainstream and more price-conscious systems.

For performance, the drives offer up to 1,000 KIOPS for random reads and writes. Sequential read speeds reach up to 7,000MB/s, while sequential write speeds go as high as 6,200MB/s. This places the EG7 Series in the range of modern PCIe Gen4 client SSDs.

KIOXIA EG7 Bit Density graphic

The EG7 Series also supports the NVMe 2.0d specification, which KIOXIA says will provide PC OEMs with added flexibility in device management and overall system design.

KIOXIA EG7 Series Form Factors, Design, and Security

KIOXIA is offering the drives in several M.2 form factors: Type 2230, Type 2242, and Type 2280. That range allows the EG7 Series to fit in compact devices with tight board space, as well as in more conventional notebook and desktop configurations. The smaller 2230 and 2242 formats are important because thin-and-light systems and compact PCs often use shorter SSD layouts.

Metric 512GB 1024GB 2048GB
Sequential Read 6,400 MB/s 7,000 MB/s
Sequential Write 5,000 MB/s 6,000 MB/s 6,200 MB/s
Random Read 550,000 IOPS 850,000 IOPS 1,000,000 IOPS
Random Write 850,000 IOPS 950,000 IOPS 1,000,000 IOPS

The EG7 Series also uses a DRAM-less design. Rather than relying on onboard DRAM, the drives use Host Memory Buffer (HMB) technology, which taps into a portion of system memory to help manage SSD functions. This design is common in more budget-conscious storage products, and can help lower the total cost of ownership and reduce power use without sacrificing responsive performance.

The drives support TCG Opal version 2.02 self-encrypting drive functionality, which is important for business systems that require hardware-based security.

Storage vendors are pushing higher-density flash into a wider range of devices as manufacturers seek more capacity without adding significant system costs. So, the EG7 Series gives OEMs another option for mainstream PCs that need to balance performance, power efficiency, and affordability.

KIOXIA EG7 Series Availability

The EG7 Series is currently sampling with select PC OEM customers. Systems with the new SSDs are expected to begin shipping in the second quarter of 2026.

KIOXIA

The post KIOXIA EG7 Series SSDs Bring QLC Storage to Mainstream PCs appeared first on StorageReview.com.
Corsair MP700 MICRO 4TB Review: PCIe Gen5 Performance in a Compact 2242 SSD

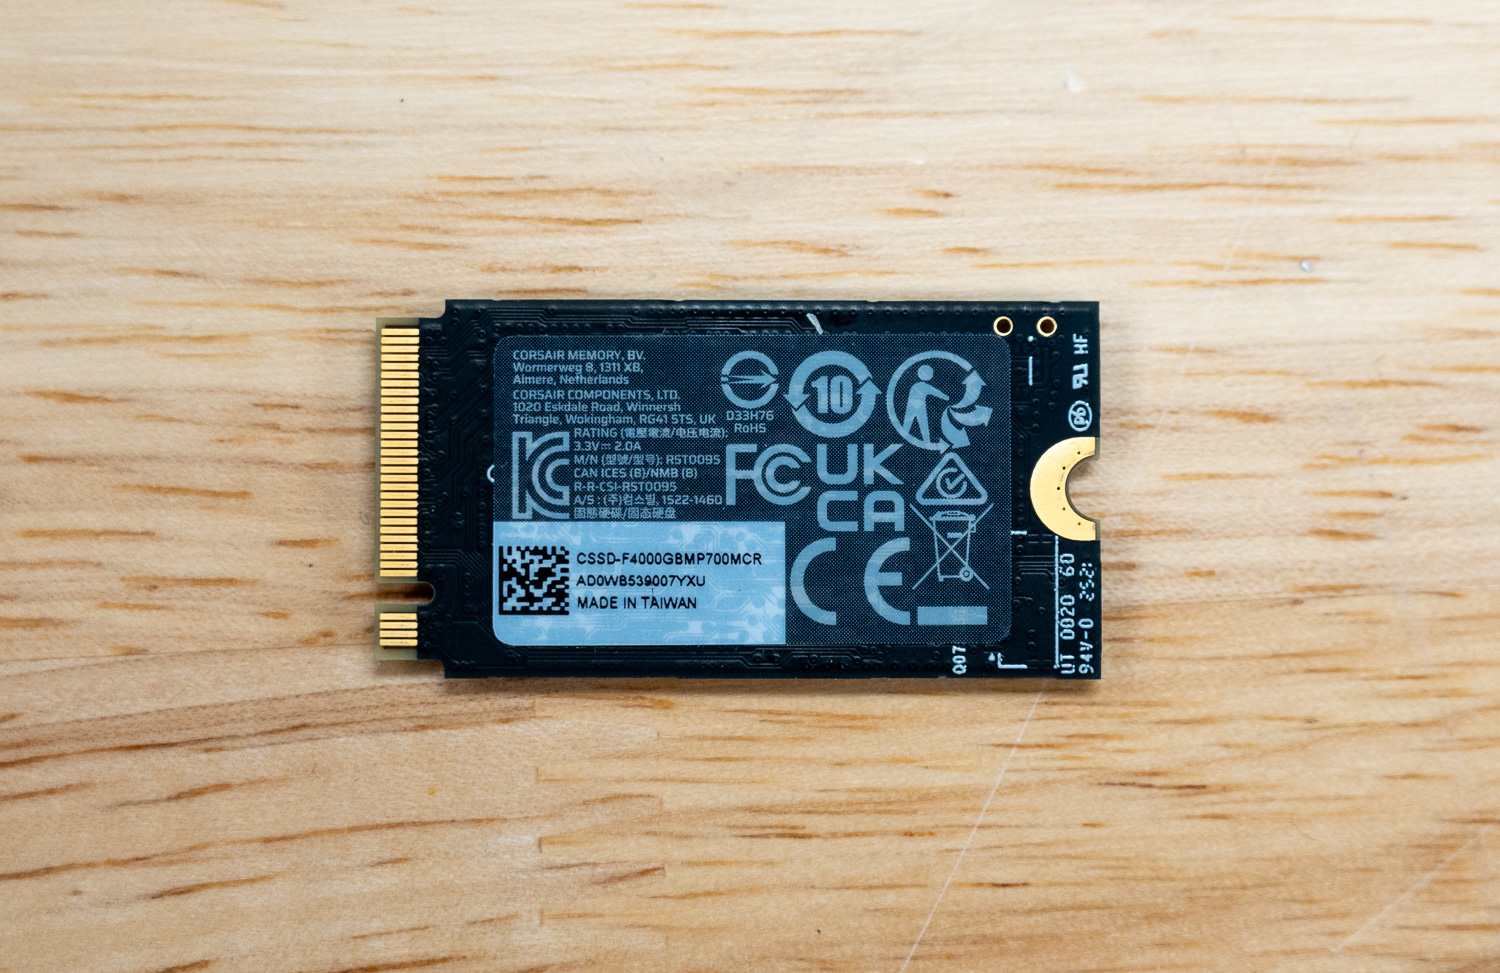
The Corsair MP700 MICRO 4TB SSD delivers next-generation storage bandwidth in a more compact form factor. Built around the compact M.2 2242 form factor using a PCIe Gen5 x4 interface, this drive is designed for thin and light laptops as well as small-form-factor workstations that need serious storage throughput on a much shorter PCB. With a hefty 4TB capacity, it also addresses a common limitation in this segment, where higher capacities in 2242 SSDs are still relatively rare.

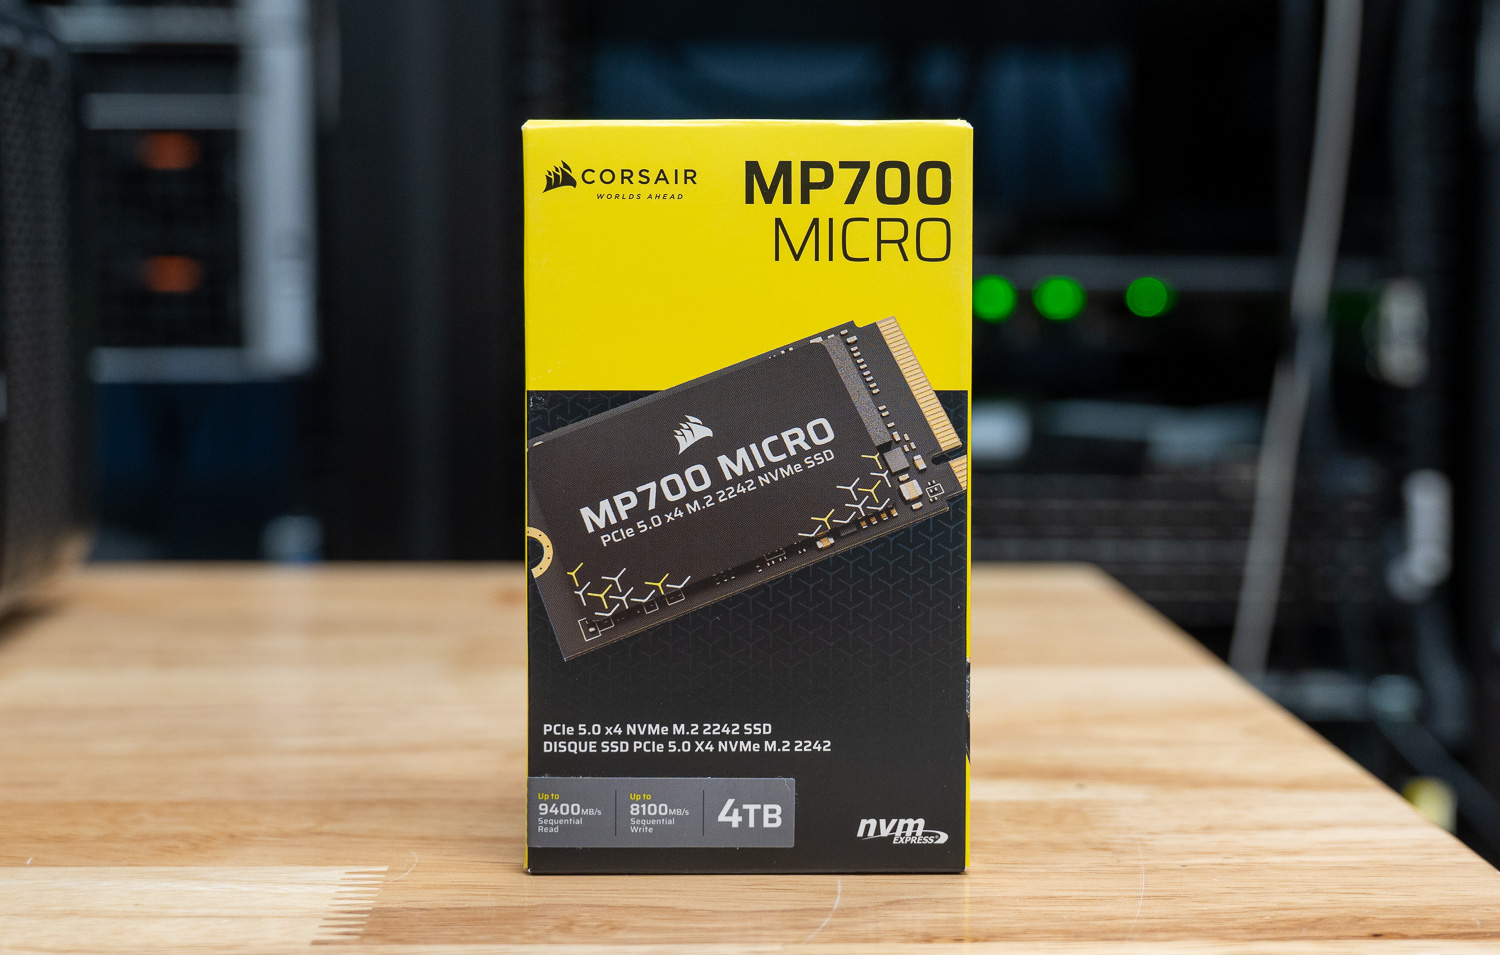
Corsair MP700 Micro box

The MP700 MICRO supports the NVMe 2.0 interface over PCIe Gen5 x4 and is rated for up to 10,000 MB/s read and 8,500 MB/s write speeds. For systems with only a single 2242 slot, 4TB lets you keep everything internal instead of managing external drives, while still leaving room for large game libraries or creative projects.

The storage is based on 3D TLC NAND, which remains the preferred choice for performance-oriented consumer and workstation SSDs due to its balance of endurance and cost-efficiency compared to QLC. The drive also supports S.M.A.R.T. monitoring for health and diagnostics. The drive also supports DEVSLP and low-power NVMe PS4 idle states below 3 mW, which is important for mobile systems where idle power consumption affects battery life.

Corsair MP700 MICRO Features and Market Positioning

With a listed price of $1,034.99, the MP700 MICRO 4TB is in the premium tier of this segment, with costs driven mainly by its Gen5 interface and 4TB capacity in a 2242 form factor. Corsair backs the drive with a 5-year warranty, which is normal for most other high-end NVMe SSDs.

Corsair MP700 Micro bottom

In terms of positioning, the MP700 MICRO 4TB targets a very specific segment of buyers. There are not many 2242 drives offering Gen5 speeds, and even fewer that go all the way to 4TB. This makes it less of a general upgrade option and more of a specific solution for compact systems where space is fixed, but performance is important.

What makes the MP700 MICRO particularly interesting is how it fits into the class of compact AI workstations and Spark systems, including those we recently reviewed. These platforms rely exclusively on the shorter M.2 2242 form factor, which imposes tighter limits on storage options than traditional 2280 deployments. Because of that constraint, finding a drive that combines high capacity with modern Gen5 bandwidth in this size becomes much more challenging.

Corsair MP700 MICRO Specifications

Specification Detail
Overview
Storage Form Factor M.2 2242
SSD Package Contents MP700 MICRO M.2 SSD
SSD Compatibility M.2 2242 Interface Connector Windows
11, Windows 10, Mac OS X
Interface & Features
Interface PCIe Gen 5 x 4
NAND Technology 3D TLC
SSD Smart Support Yes
DEVSLP PS4: <3mW
Environmental
SSD Operating Temperature 0°C to +65°C
Storage Temperature -40°C to +85°C
Storage Humidity 93% RH (40° C)
Durability
Vibration 20Hz~80Hz/1.52mm,
80Hz~2000Hz/20G
SSD Shock 1,500 G
Physical
Weight 0.024kg

Corsair MP700 MICRO Performance

Peak Synthetic Performance

The FIO test is a flexible and powerful benchmarking tool for measuring the performance of storage devices, including SSDs and HDDs. It evaluates metrics such as bandwidth, IOPS, and latency under different workloads, like sequential and random read/write operations. This test helps to assess the peak performance of storage systems, making it useful for comparing different devices or configurations. We measured the peak burst performance for this test, limiting the workload to a 10GB footprint on both SSDs.

In the FIO synthetic benchmarks, the Corsair MP700 MICRO shows a performance profile that demonstrates the constraints of its compact 2242 design. Its sequential read speed reaches 9,169 MB/s with an average latency of 0.91ms, placing it below most full-size Gen5 drives that exceed 13,000 MB/s, though it remains competitive with high-end Gen4 drives such as the WD SN850X and Samsung 990 Pro. Sequential writes reach 7,948 MB/s with 1.06ms latency, again trailing larger Gen5 models but remaining competitive with high-end Gen4 drives.

For random performance, the Corsair MP700 MICRO posts 1.277M IOPS in 4K reads and 1.540M IOPS in 4K writes, which places it slightly ahead of drives like the Crucial P510 and Samsung 990 Pro in some cases but below the stronger Gen5 performers that push past the 2M IOPS mark. While the MP700 MICRO does not compete with the fastest desktop-class Gen5 SSDs, it still delivers decent performance for a drive built around the much smaller M.2 2242 form factor.

FIO Test (higher MB/s/IOPS is better) Sequential 128K Read (1T/64Q) Sequential 128K Write (1T/64Q) Random 4K Read (16T/32Q) Random 4K Write (16T/32Q)
SanDisk SN8100 15,000 MB/s (0.56ms avg latency) 14,100 MB/s (0.59ms avg latency) 2.312M IOPS (0.22ms avg latency) 2.144M IOPS (0.24ms avg latency)
Kingston FURY Renegade G5 14,600 MB/s (0.57ms avg latency) 14,100 MB/s (0.59ms avg latency) 2.028M IOPS (0.25ms avg latency) 2.028M IOPS (0.25ms avg latency)
Samsung 9100 Pro 14,600 MB/s (0.57ms avg latency) 13,300 MB/s (0.63ms avg latency) 2.734M IOPS (0.18ms avg latency) 2.734M IOPS (0.19ms avg latency)
SK hynix Platinum P51 14,500 MB/s (0.58ms avg latency) 13,500 MB/s (0.62ms avg latency) 2.369M IOPS (0.22ms avg latency) 2.669M IOPS (0.19ms avg latency)
Crucial T705 14,400 MB/s (0.58ms avg latency) 12,300 MB/s (0.68ms avg latency) 1.585M IOPS (0.32ms avg latency) 2.703M IOPS (0.19ms avg latency)
TEAMGROUP GE Pro 2TB 13,900 MB/s (0.60ms avg latency) 12,800 MB/s (0.65ms avg latency) 2.585M IOPS (0.23ms avg latency) 1.818M IOPS (0.28ms avg latency)
Lexar Professional NM1090 PRO 13,800MB/s (0.61ms avg latency) 13,600 MB/s (0.62ms avg latency) 2.251M IOPS (0.23ms avg latency) 1.818M IOPS (0.28ms avg latency)
TEAMGROUP GC Pro 2TB 13,600 MB/s (0.62ms avg latency) 12,700 MB/s (0.66ms avg latency) 2.110M IOPS (0.24ms avg latency) 1.686M IOPS (0.28ms avg latency)
PNY CS2150 10,400MB/s (0.80ms avg latency) 8,801MB/s (0.95ms avg latency) 1.379M IOPS (0.371ms avg latency) 1.623M IOPS (0.32ms avg latency)
Corsair MP700 MICRO 4TB 9,169 MB/s (0.91ms avg latency) 7,948 MB/s (1.06ms avg latency) 1.277M IOPS (0.40ms avg latency) 1.540M IOPS (0.33ms avg latency)
Crucial P510 8,835 MB/s (0.90 ms avg latency) 9,961 MB/s (0.80 ms avg latency) 1.163M IOPS (0.44ms avg latency) 1.196M IOPS (0.51ms avg latency)
Micron 3610 2TB 6,839 MB/s (1.23ms avg latency) 9,673 MB/s (0.87ms avg latency) 1.523M IOPS (0.34ms avg latency) 1.871M IOPS (0.27ms avg latency)
Samsung 990 Pro 7,483 MB/s (1.12ms avg latency) 7,197 MB/s (1.16ms avg latency) 1.400M IOPS (0.36ms avg latency) 1.403M IOPS (0.36ms avg latency)
Crucial P310 2TB 7,197 MB/s (1.16ms avg latency) 6,376 MB/s (1.31ms avg latency) 1.163M IOPS (0.44ms avg latency) 1.196M IOPS (0.43ms avg latency)
WD SN850X 2TB 6,632 MB/s (0.76ms avg latency) 7,235 MB/s (0.92ms avg latency) 1.2M IOPS (0.43ms avg latency) 825K IOPS (0.62ms avg latency)
Micron 2600 2TB 5,702 MB/s (1.47ms avg latency) 6,612 MB/s (1.27ms avg latency) 1.11M IOPS (0.46ms avg latency) 1.36M IOPS (0.38ms avg latency)

Average LLM Load Time

The Average LLM Load Time test evaluated the load times of three different LLMs: DeepSeek R1 7B, Meta Llama 3.2 11B, and DeepSeek R1 32B. Each model was tested 10 times, and the average load time was calculated. This test measures the drive’s ability to load large language models (LLMs) into memory quickly. LLM load times are critical for AI-related tasks, especially for real-time inference and processing large datasets. Faster loading enables the model to process data more quickly, thereby improving AI responsiveness and reducing wait times.

When it comes to loading Large Language Models into memory, the Corsair MP700 MICRO 4TB places near the bottom of the chart despite its Gen5 interface. Since LLM loading is almost entirely read-bound, the drive’s more modest sequential throughput compared to full-size Gen5 SSDs shows up quickly in this test. The MP700 MICRO posts 3.47 seconds for the DeepSeek R1 7B model, 5.21 seconds for the Meta Llama 3.2 11B Vision model, and 5.39 seconds for the larger DeepSeek R1 32B model.

Across the board, those results trail most of the Gen5 drives in the comparison, with many of them loading the 7B model closer to the mid-2-second range and completing the 32B model in roughly 4 to 4.8 seconds. While the MP700 MICRO still edges out the Micron 3610 in every model test, it cannot compete with the fastest desktop-class Gen5 drives for AI model loading.

Average LLM Load Time (lower is better) DeepSeek R1 7B Meta Llama 3.2 11B Vision DeepSeek R1 32B
SK hynix Platinum P51 2.5481s 3.5809s 4.1790s
SanDisk SN8100 2.5702s 3.5856s 4.2870s
Samsung 9100 Pro 4TB 2.6173s 3.6017s 4.3735s
PNY CS2150 2.8107s 3.6820s 4.8962s
Crucial T705 2TB 2.8758s 3.6312s 5.1080s
Samsung 990 Pro 2TB 2.8758s 3.6312s 5.1080s
Crucial P510 1TB 2.8817s 3.6631s 5.0594s
TEAMGROUP GE Pro 2TB 2.9092s 3.9136s 4.8974s
TEAMGROUP GC Pro 2TB 2.9379s 3.9267s 4.8188s
WD SN850X 2TB 3.0082s 3.6543s 5.4844s
Kingston FURY Renegade G5 3.1843s 4.8009s 4.6523s
Crucial P310 2TB 3.1889s 3.7083s 5.4844s
Lexar Professional NM1090 PRO 3.2135s 4.9504s 7.2108s
Micron 2600 2TB 3.3178s 3.9174s 5.9060s
Corsair MP700 MICRO 4TB 3.4694s 5.2106s 5.3990s
Micron 3610 2TB 3.5348s 5.3853s 5.5731s

GPU Direct Storage

One of the tests we conducted on this testbench was the Magnum IO GPU Direct Storage (GDS) test. GDS is a feature developed by NVIDIA that allows GPUs to bypass the CPU when accessing data stored on NVMe drives or other high-speed storage devices. Instead of routing data through the CPU and system memory, GDS enables direct communication between the GPU and the storage device, significantly reducing latency and improving data throughput.

How GPU Direct Storage Works

Traditionally, when a GPU processes data stored on an NVMe drive, the data must first travel through the CPU and system memory before reaching the GPU. This process introduces bottlenecks because the CPU acts as a middleman, adding latency and consuming valuable system resources. GPU Direct Storage eliminates this inefficiency by enabling the GPU to access data directly from the storage device via the PCIe bus. This direct path reduces data-movement overhead, enabling faster, more efficient data transfers.

AI workloads, especially those involving deep learning, are highly data-intensive. Training large neural networks requires processing terabytes of data, and any delay in data transfer can lead to underutilized GPUs and longer training times. GPU Direct Storage addresses this challenge by ensuring that data is delivered to the GPU as quickly as possible, minimizing idle time and maximizing computational efficiency.

In addition, GDS is particularly beneficial for workloads that involve streaming large datasets, such as video processing, natural language processing, or real-time inference. By reducing the reliance on the CPU, GDS accelerates data movement and frees up CPU resources for other tasks, further enhancing overall system performance.

For comparison in these tests, we are using several Spark systems that we recently reviewed, each equipped with a different NVMe SSD configuration. These platforms provide a useful cross-section of both Gen4 and Gen5 storage implementations, allowing us to see how the Corsair MP700 MICRO behaves relative to drives in real-world GPU compute environments:

GDSIO Read Throughput 1M

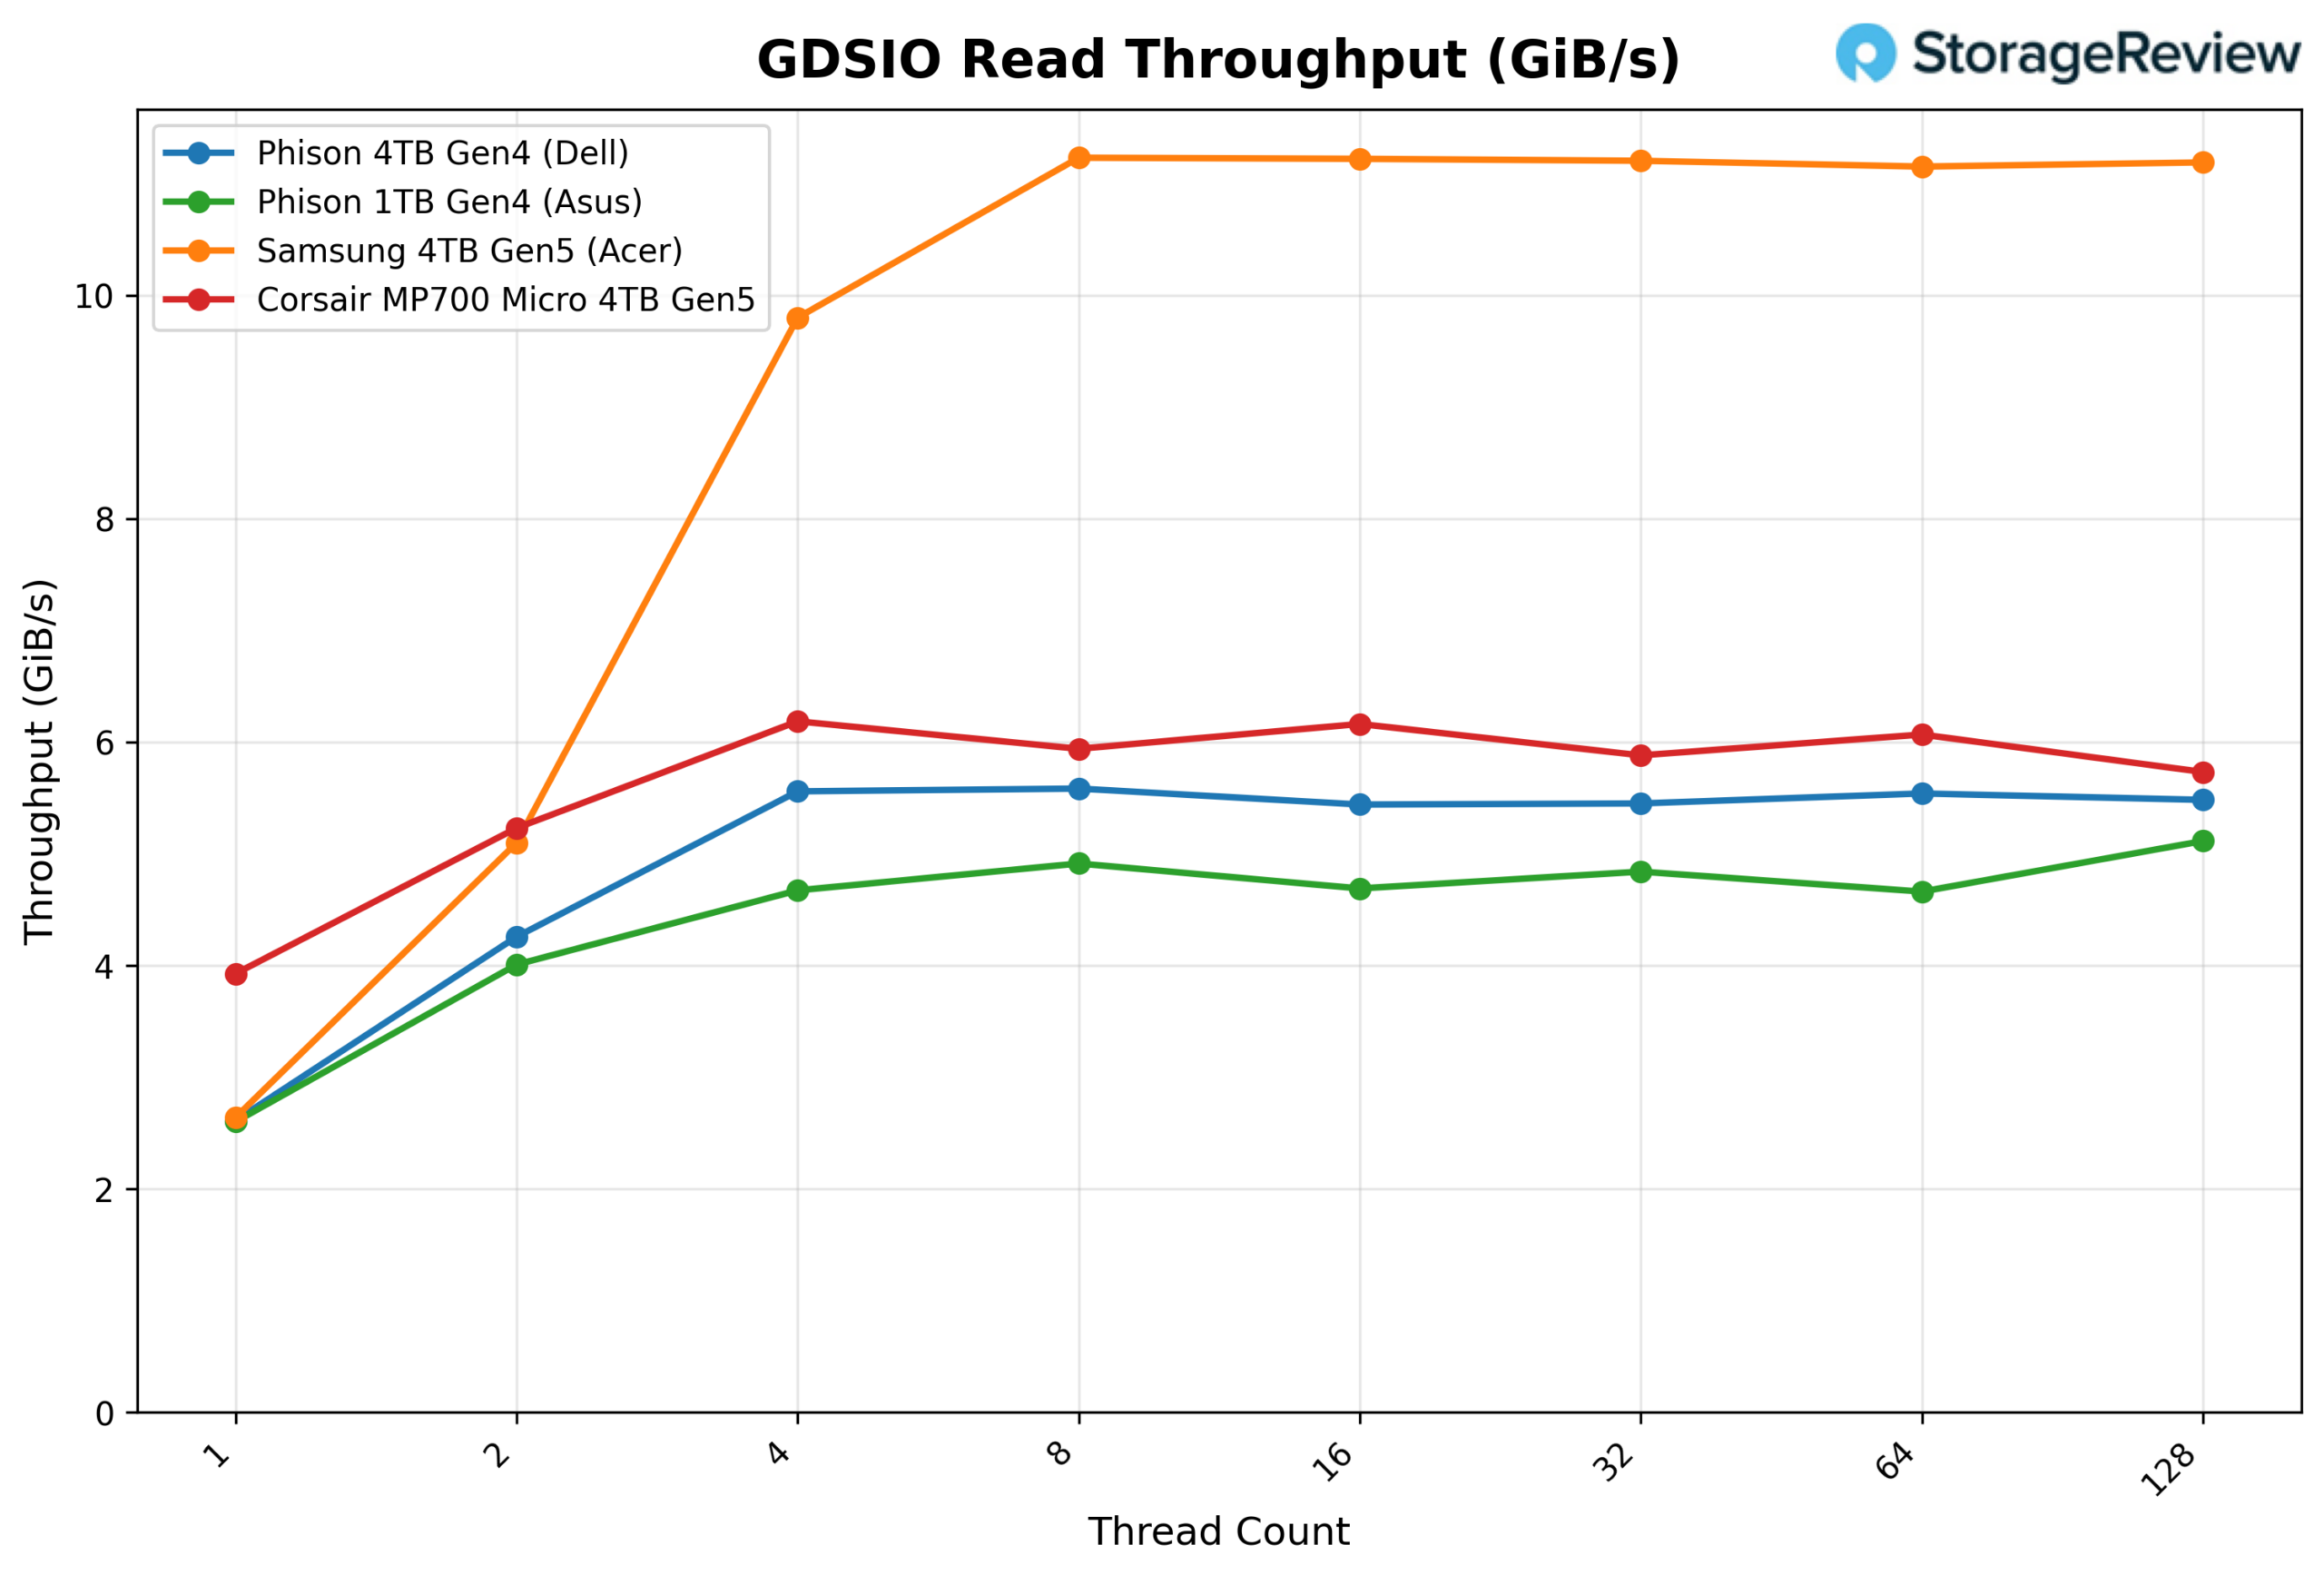
In the 1MB sequential read test using GPU Direct Storage, the Corsair MP700 MICRO shows solid scaling early on, then levels off as thread counts increase. With a single thread, the drive delivers 3.93 GiB/s, quickly climbing to 5.23 GiB/s with two threads and peaking at about 6.19 GiB/s with four threads. Past that point, throughput stabilizes in the 5.7-6.1 GiB/s range up to 128 threads.

GDSIO Read Latency 1M

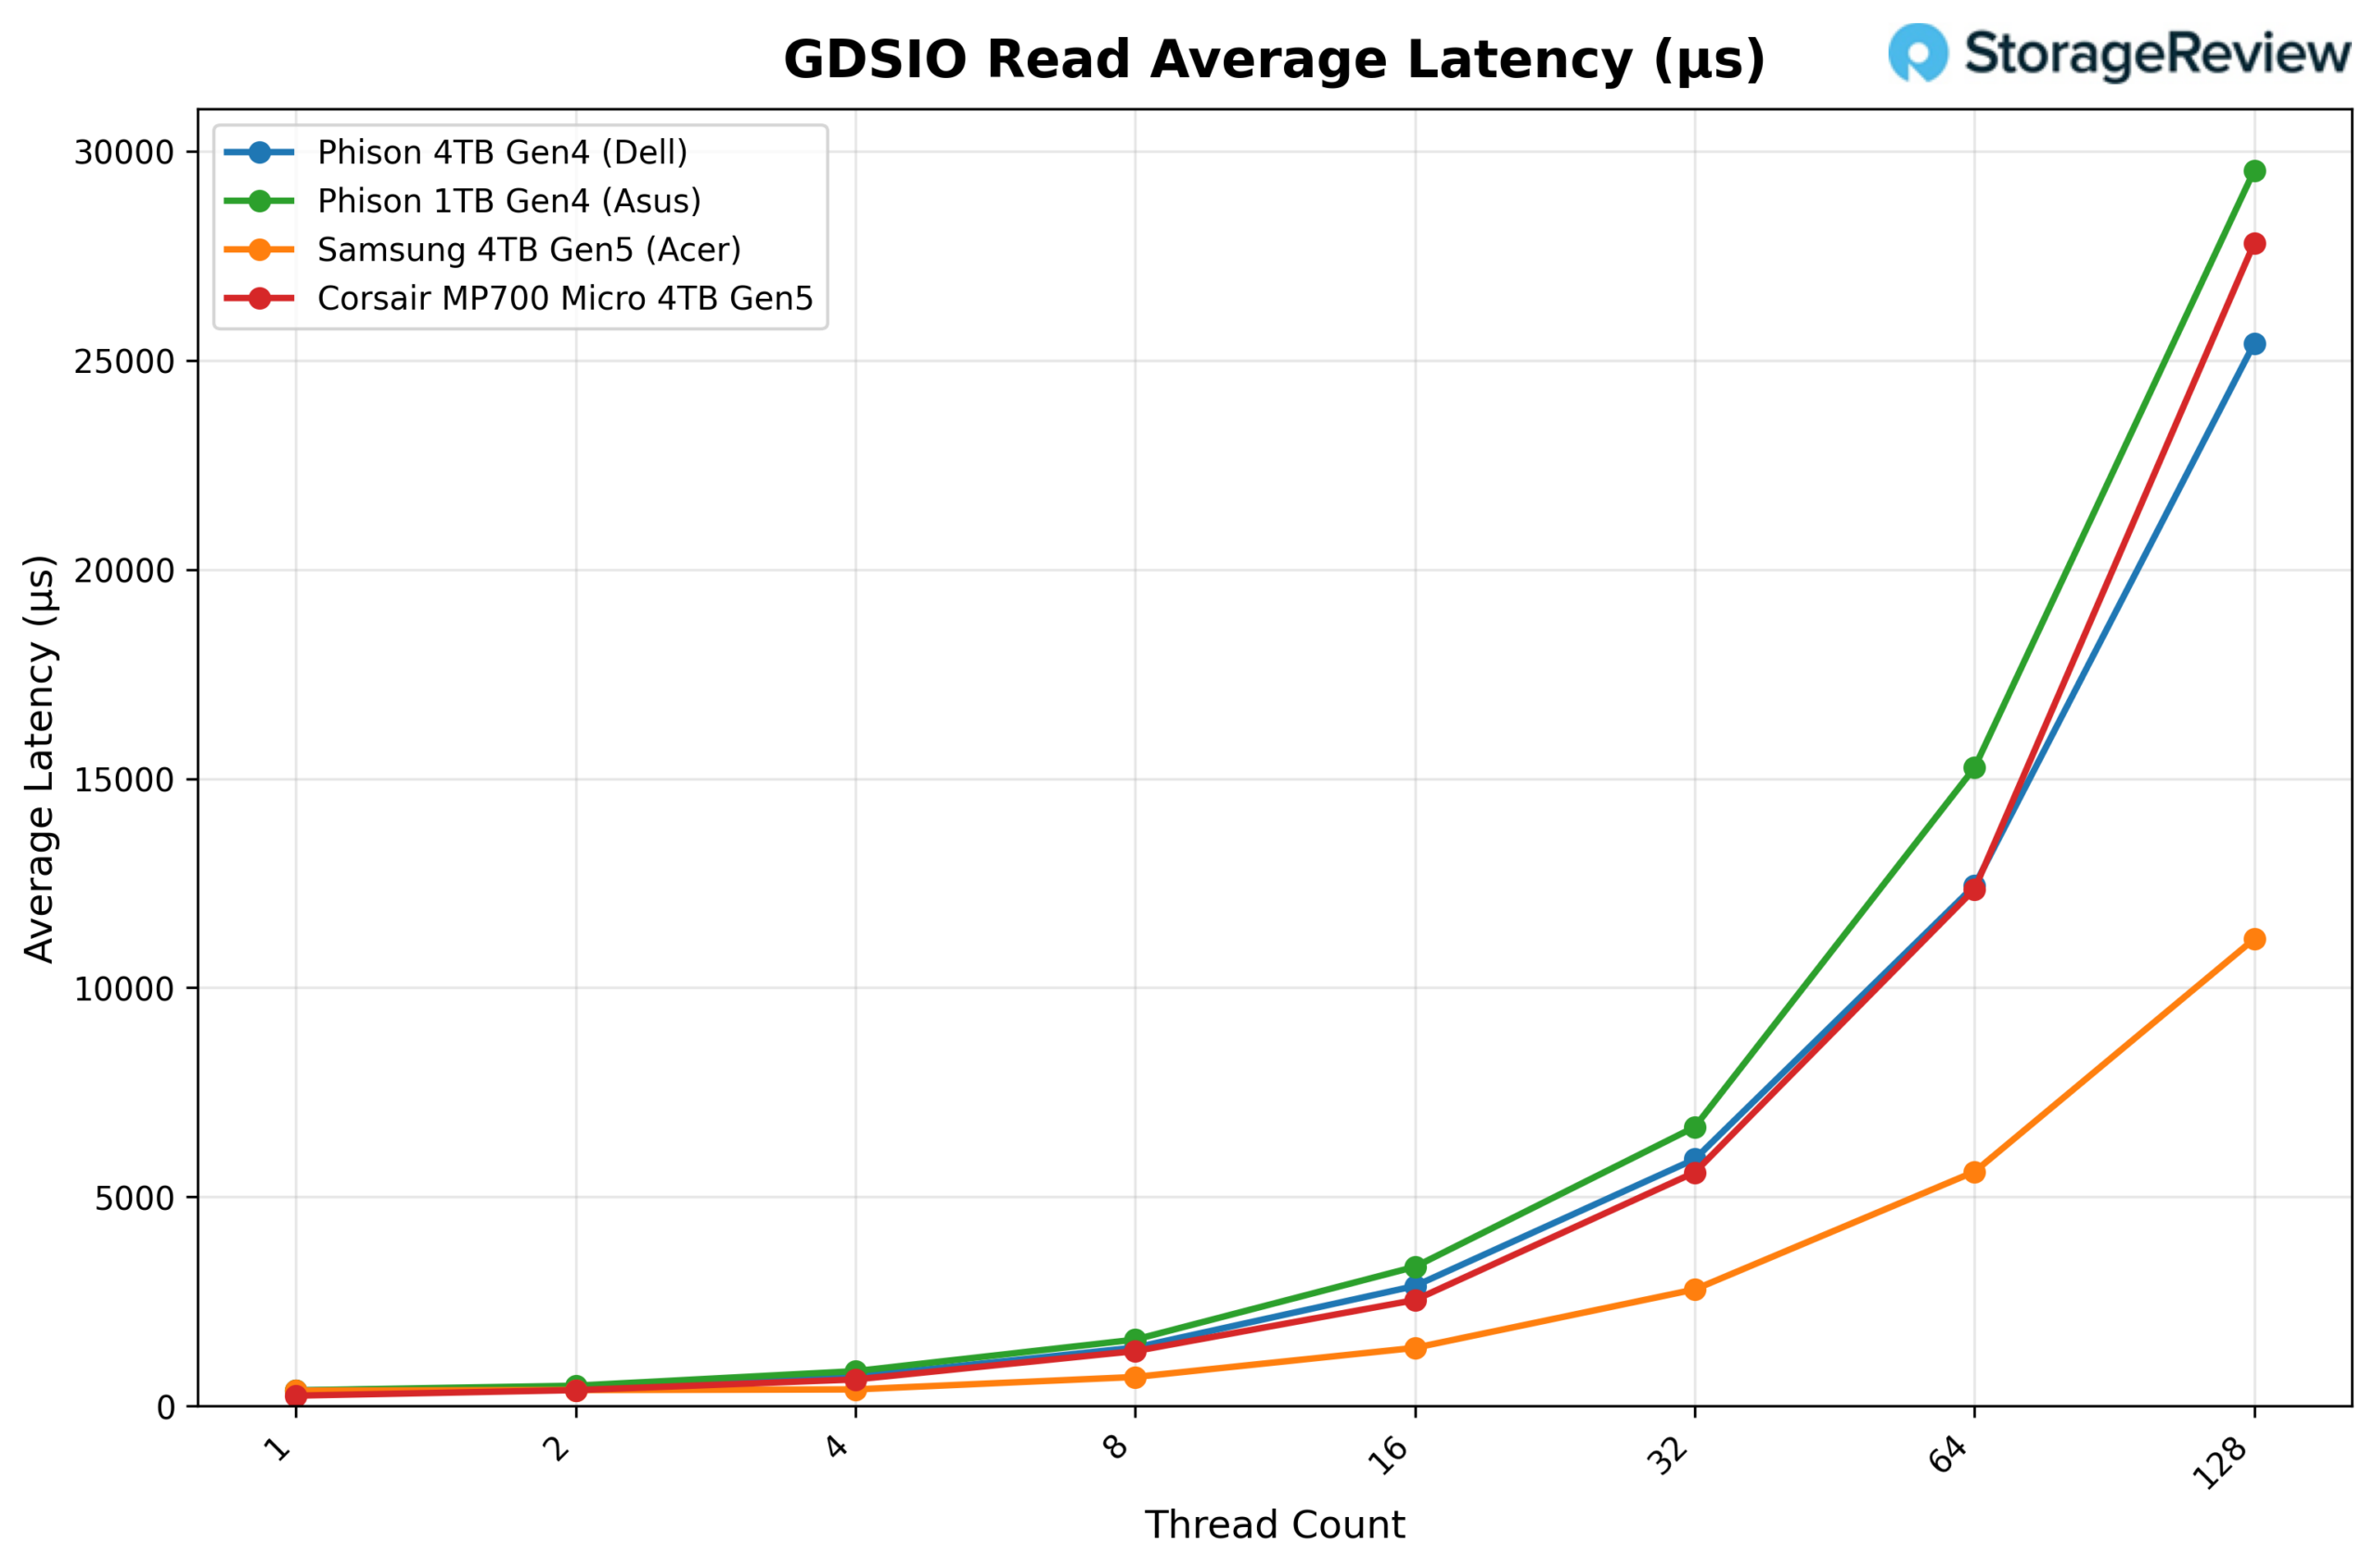
Latency trends follow the expected pattern as queue depth increases. On a single thread, average latency is about 248µs, which gradually increases to roughly 381µs with two threads and 636µs with four threads as additional parallel requests are introduced. As concurrency increases, latency rises more noticeably, reaching about 1,315µs at 8 threads, 2,535µs at 16 threads, and eventually climbing to roughly 27,807µs at 128 threads.

GDSIO Write Throughput 1M

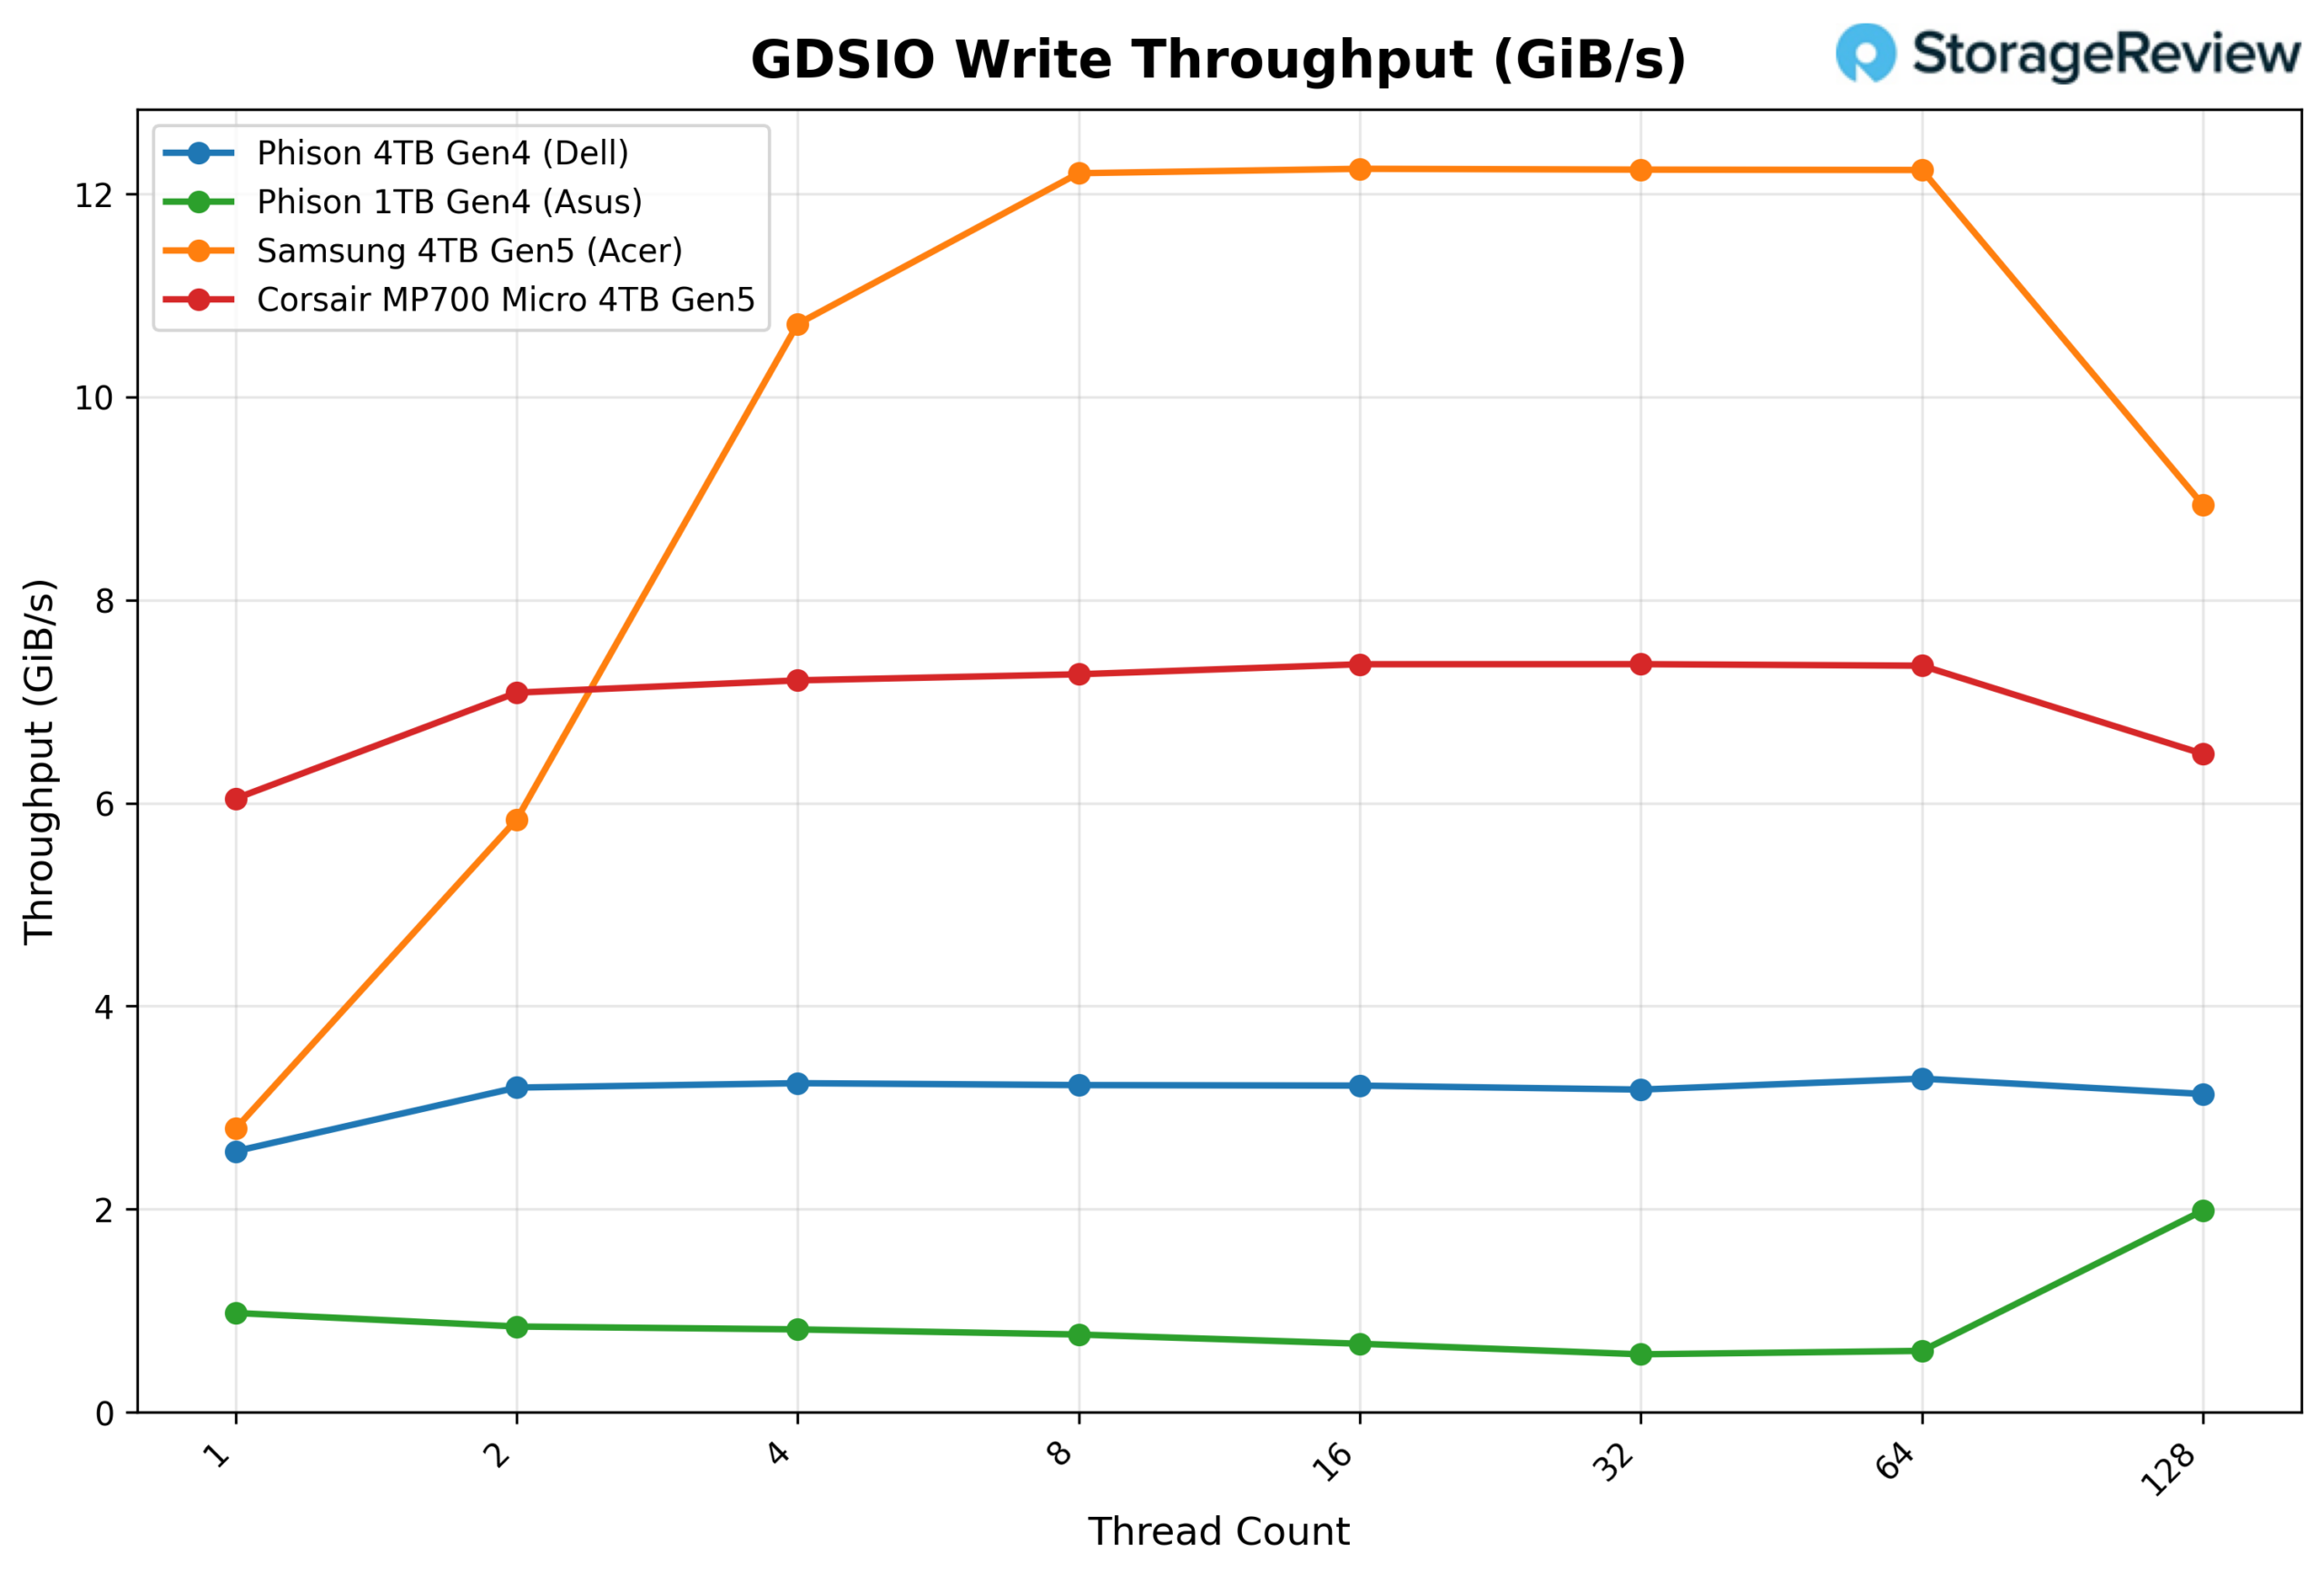
In the 1MB sequential write test using GPU Direct Storage, the Corsair MP700 MICRO ramps up quickly, then settles into a stable throughput range as concurrency increases. With a single thread, the drive posts 6.04GiB/s, climbing to 7.09GiB/s at two threads and 7.21GiB/s at four threads. Performance continues to inch upward as thread counts increase, peaking at about 7.37GiB/s around the 16 to 32 thread range before flattening out. Beyond that point, throughput holds steady through 64 threads before dropping slightly to 6.48 GiB/s at 128 threads. Compared with the other drives in the chart, the MP700 MICRO trails the full-size Samsung Gen5 drive that exceeds 12GiB/s, though it maintains a lead over the Gen4 Phison-based models throughout most of the test.

GDSIO Write Latency 1M

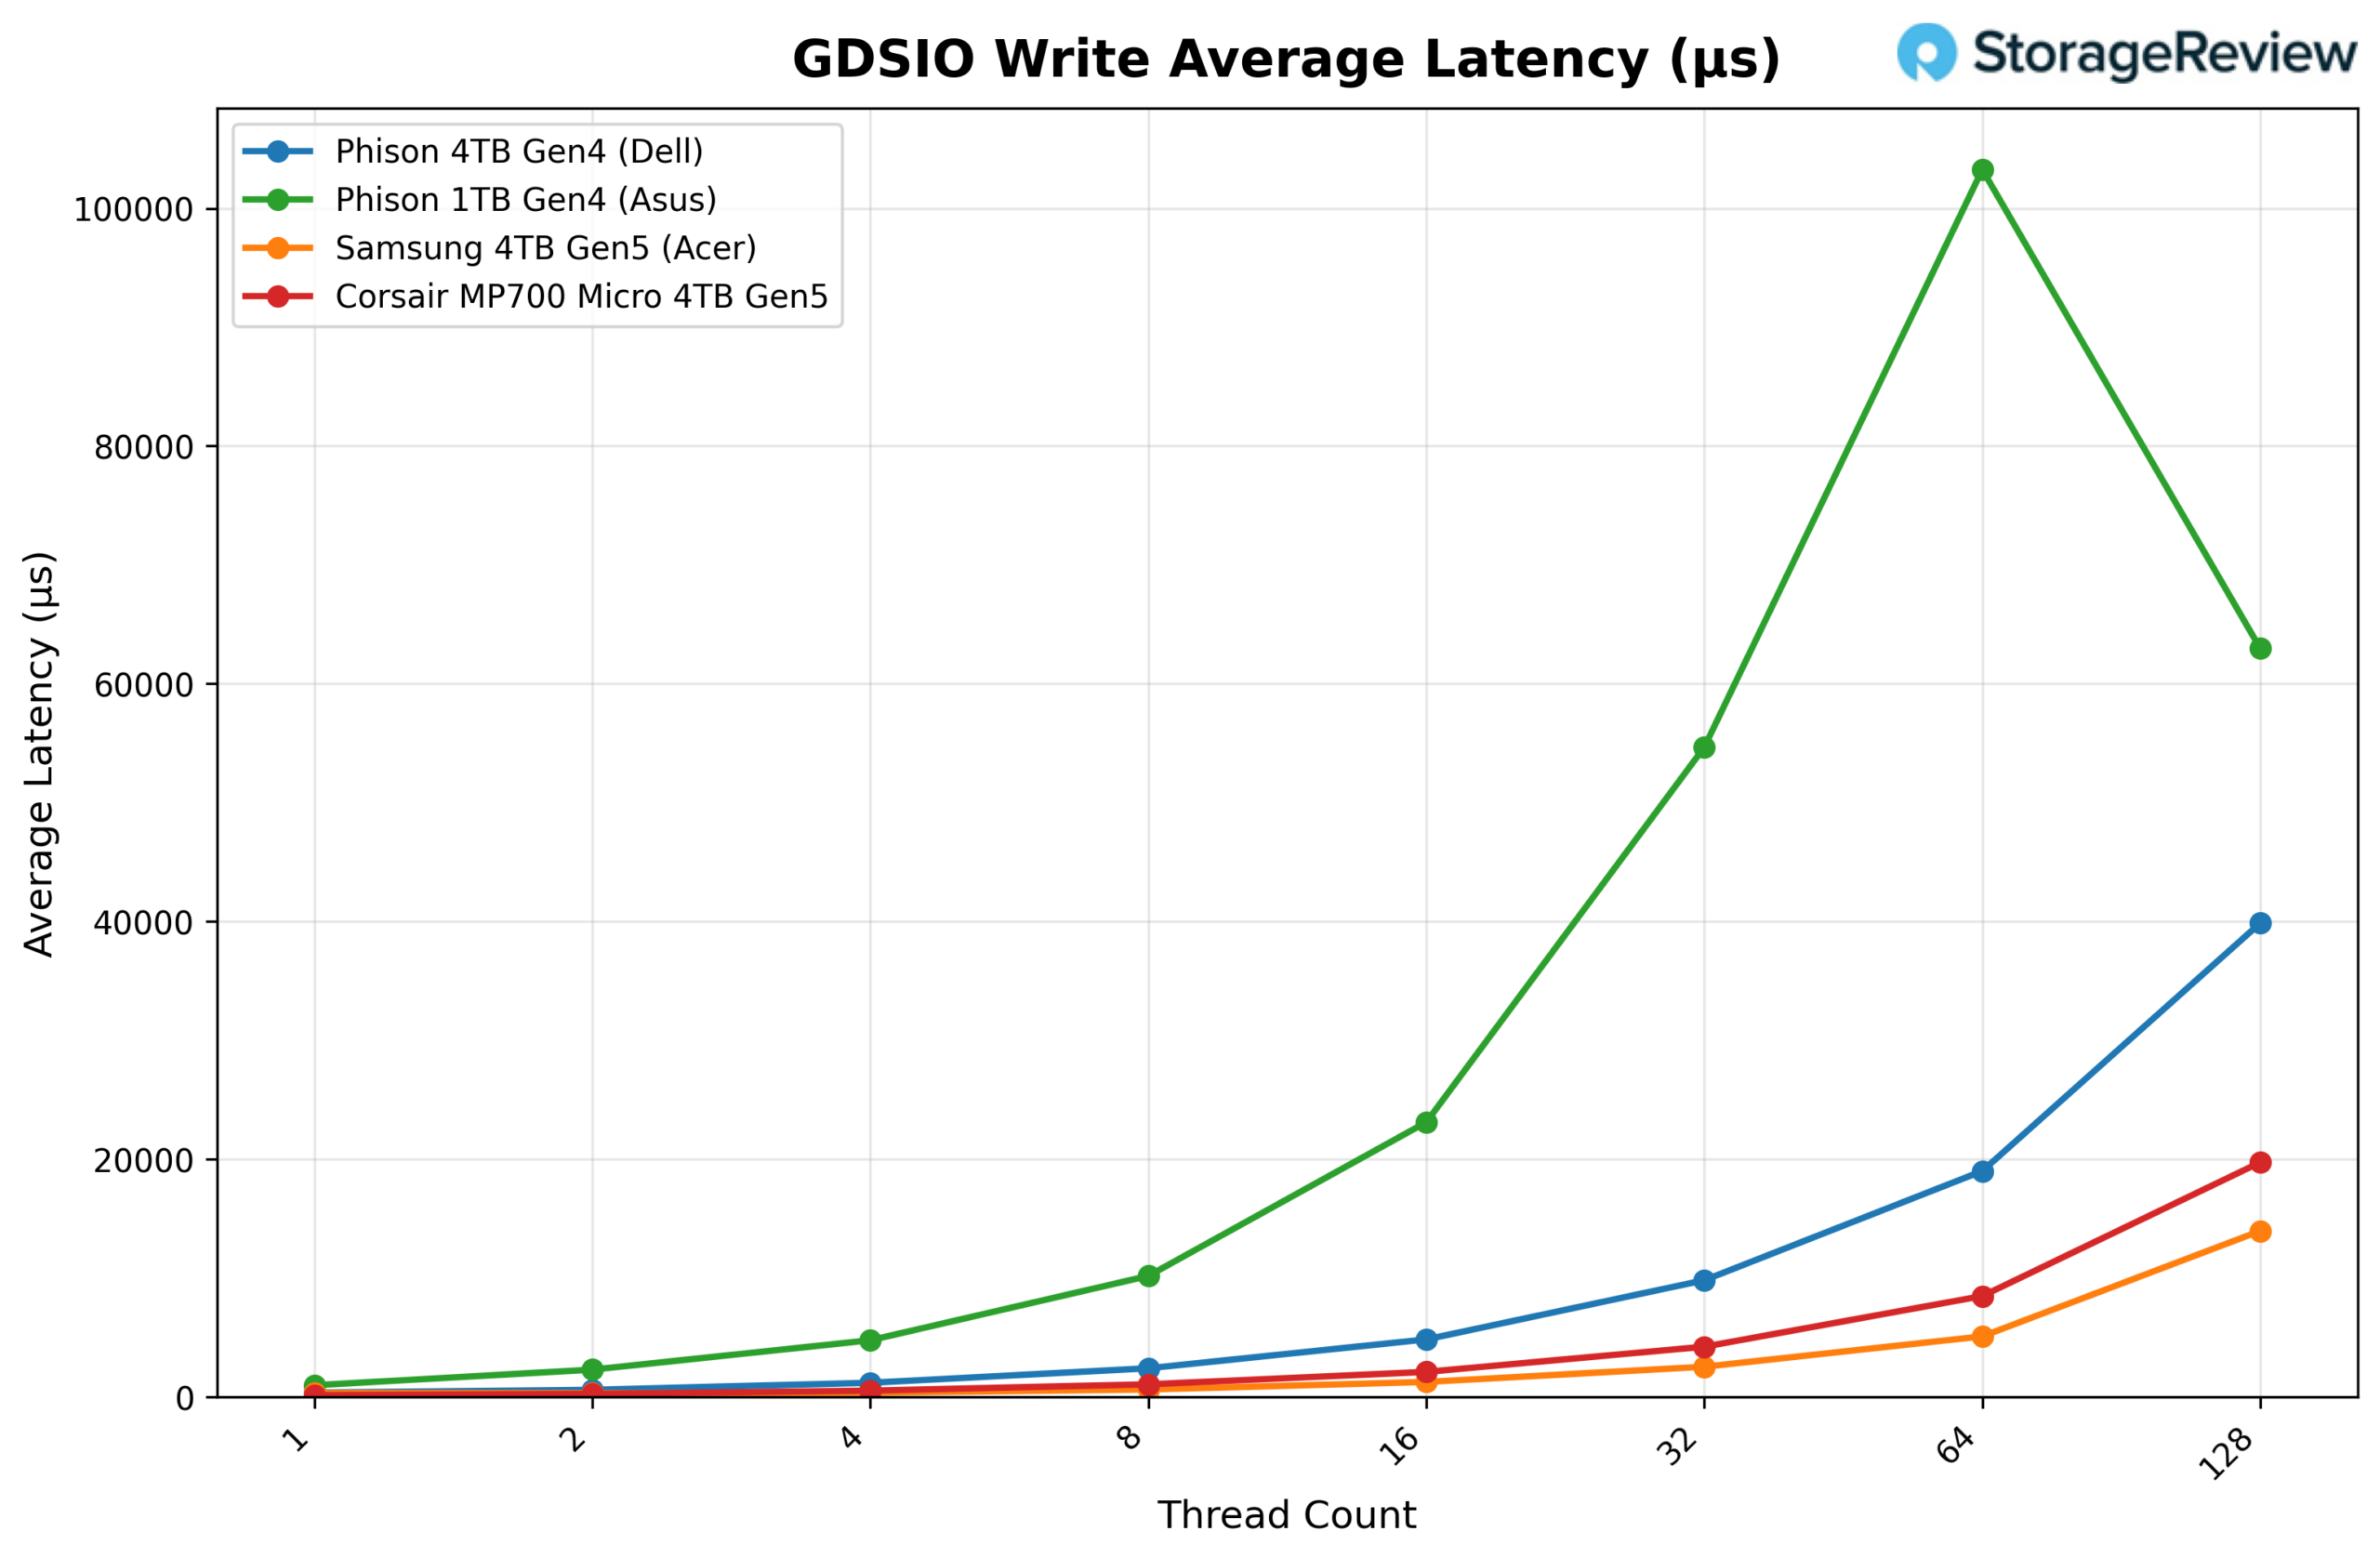
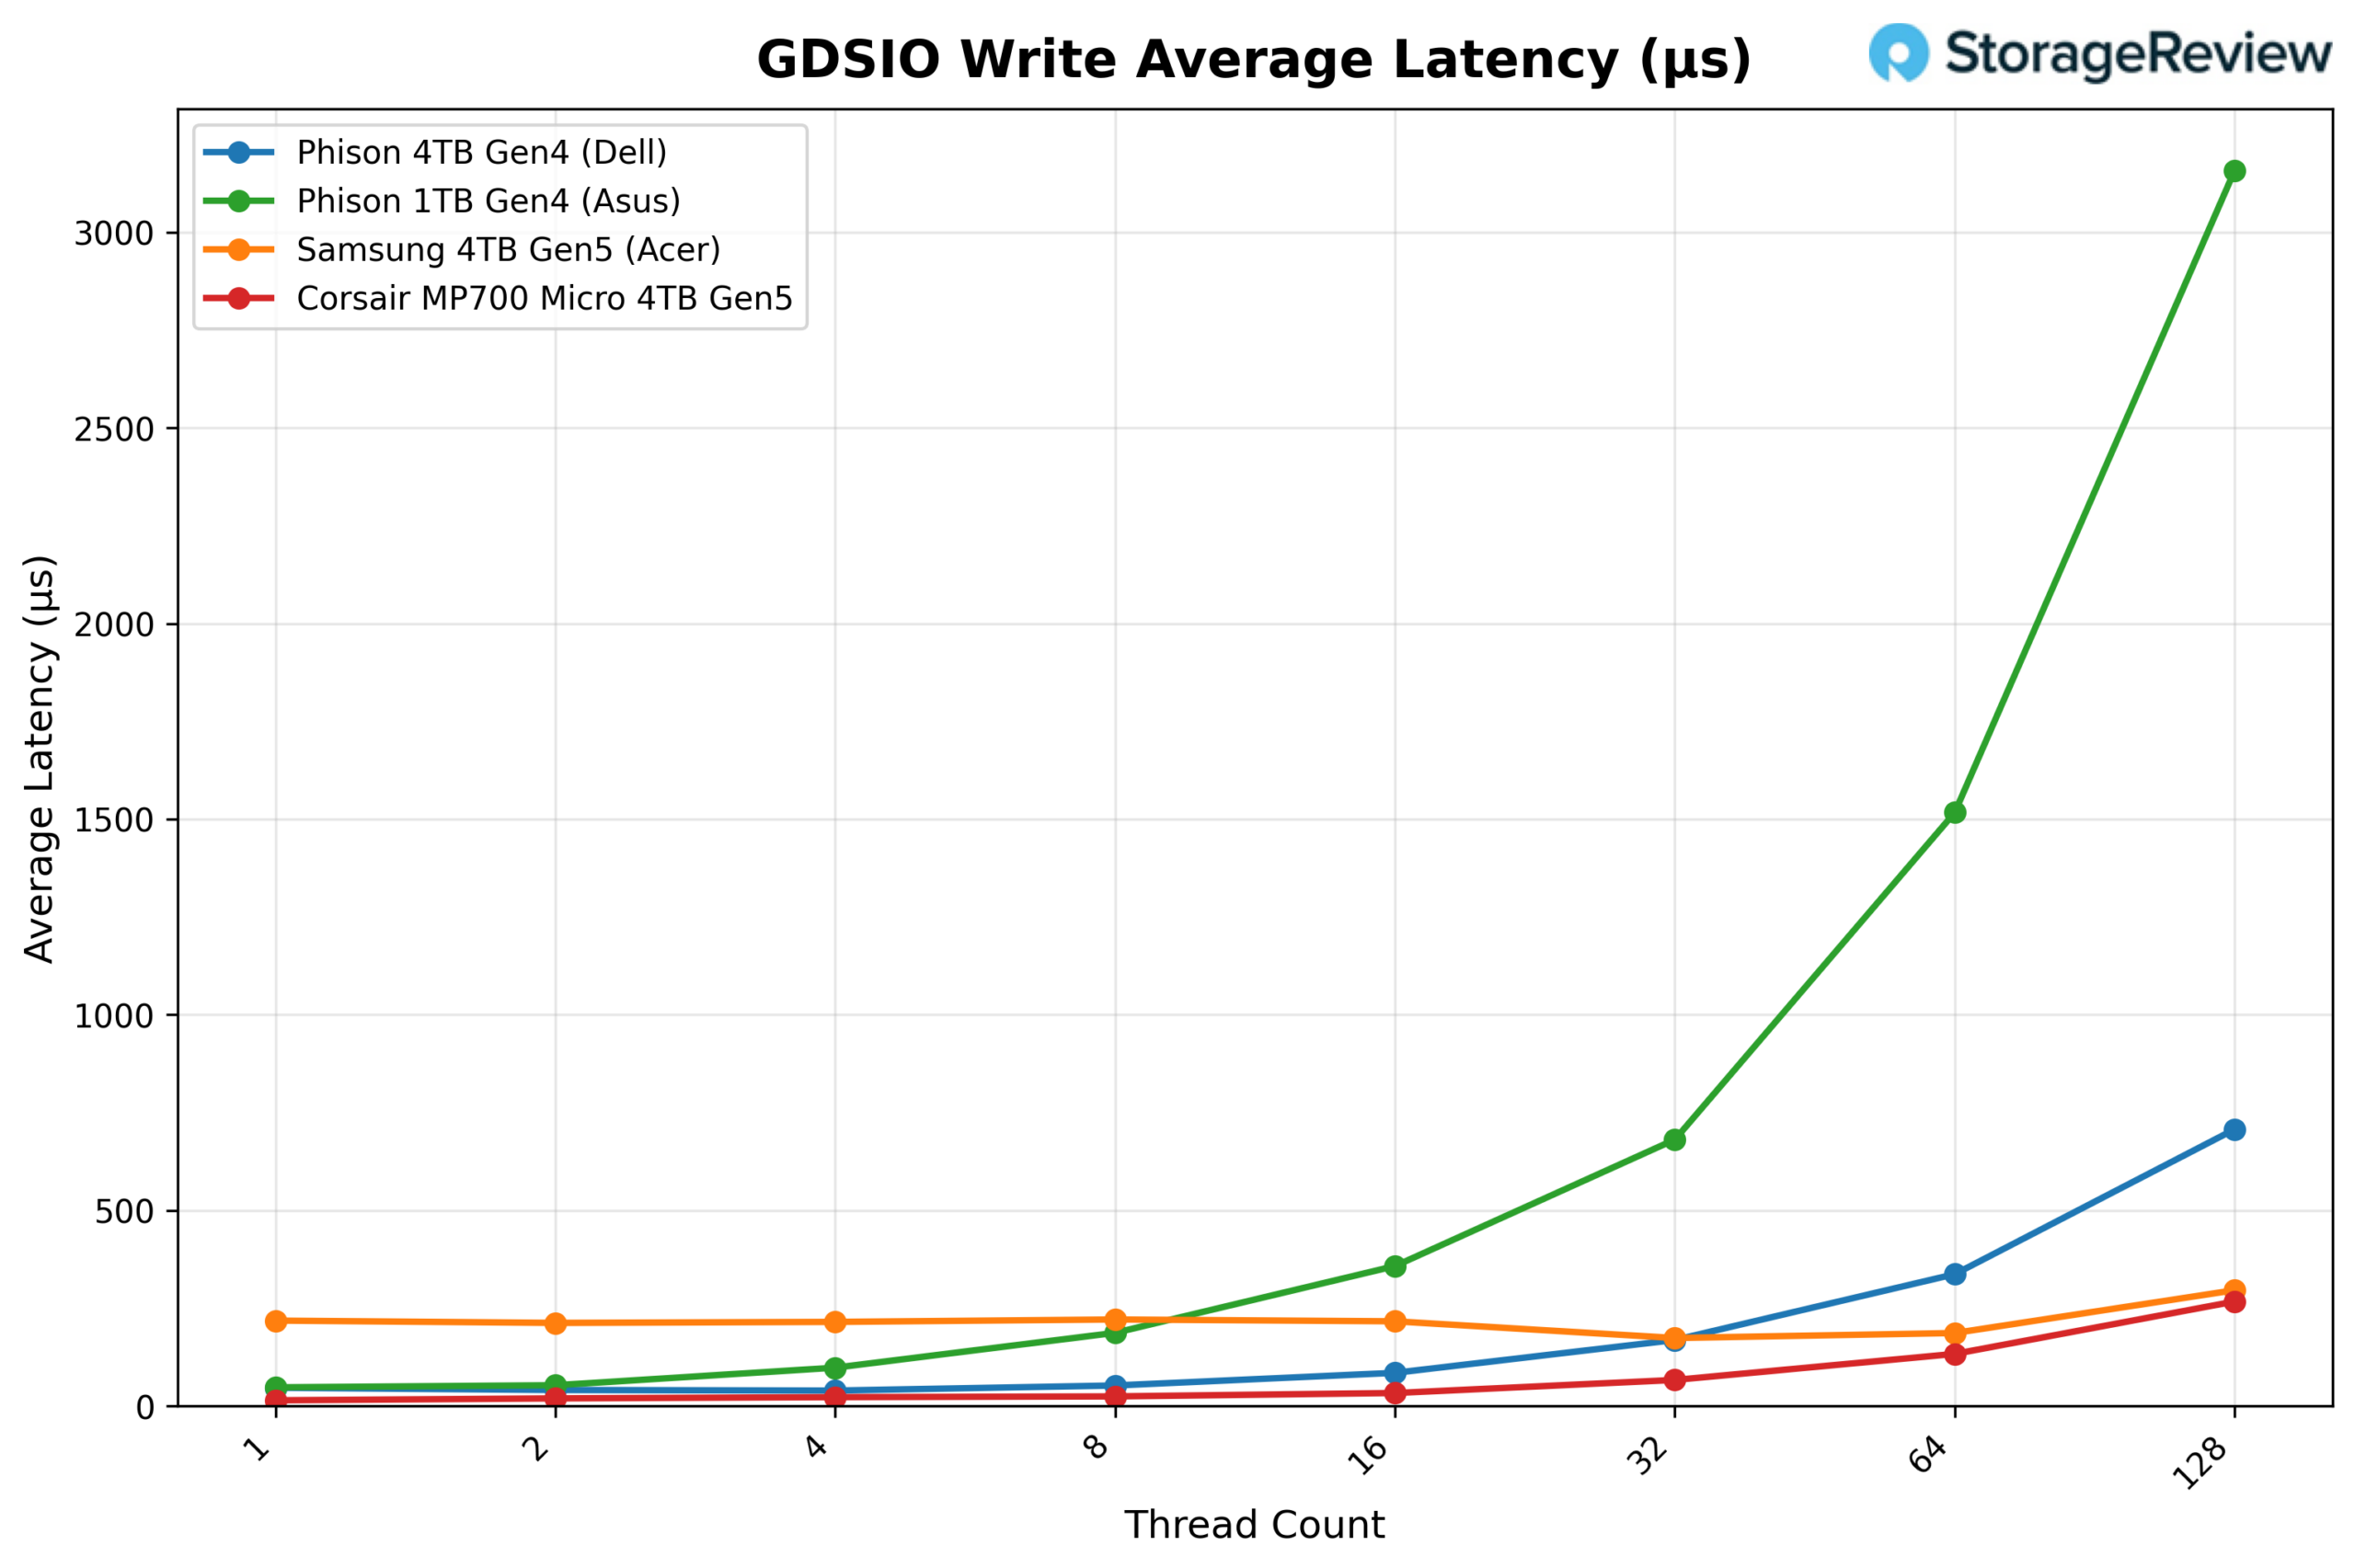
Latency increases as thread counts rise due to the greater queue depth on the drive during the GDS workload. At one thread, the MP700 MICRO records an average latency of about 162µs, increasing to roughly 276µs at two threads and 542µs at four threads. As concurrency grows, latency scales upward to about 1,075µs at eight threads, 2,120µs at sixteen threads, and 4,240µs at thirty-two threads. Higher thread counts increase latency, reaching roughly 8,500 µs at 64 threads and about 19,749 µs at 128 threads. Even with this increase, the MP700 MICRO still has lower latency than the slower Gen4 configuration shown in the chart. It tracks relatively close to the higher-performing Samsung drive across most of the test range.

GDSIO Read Throughput 16K

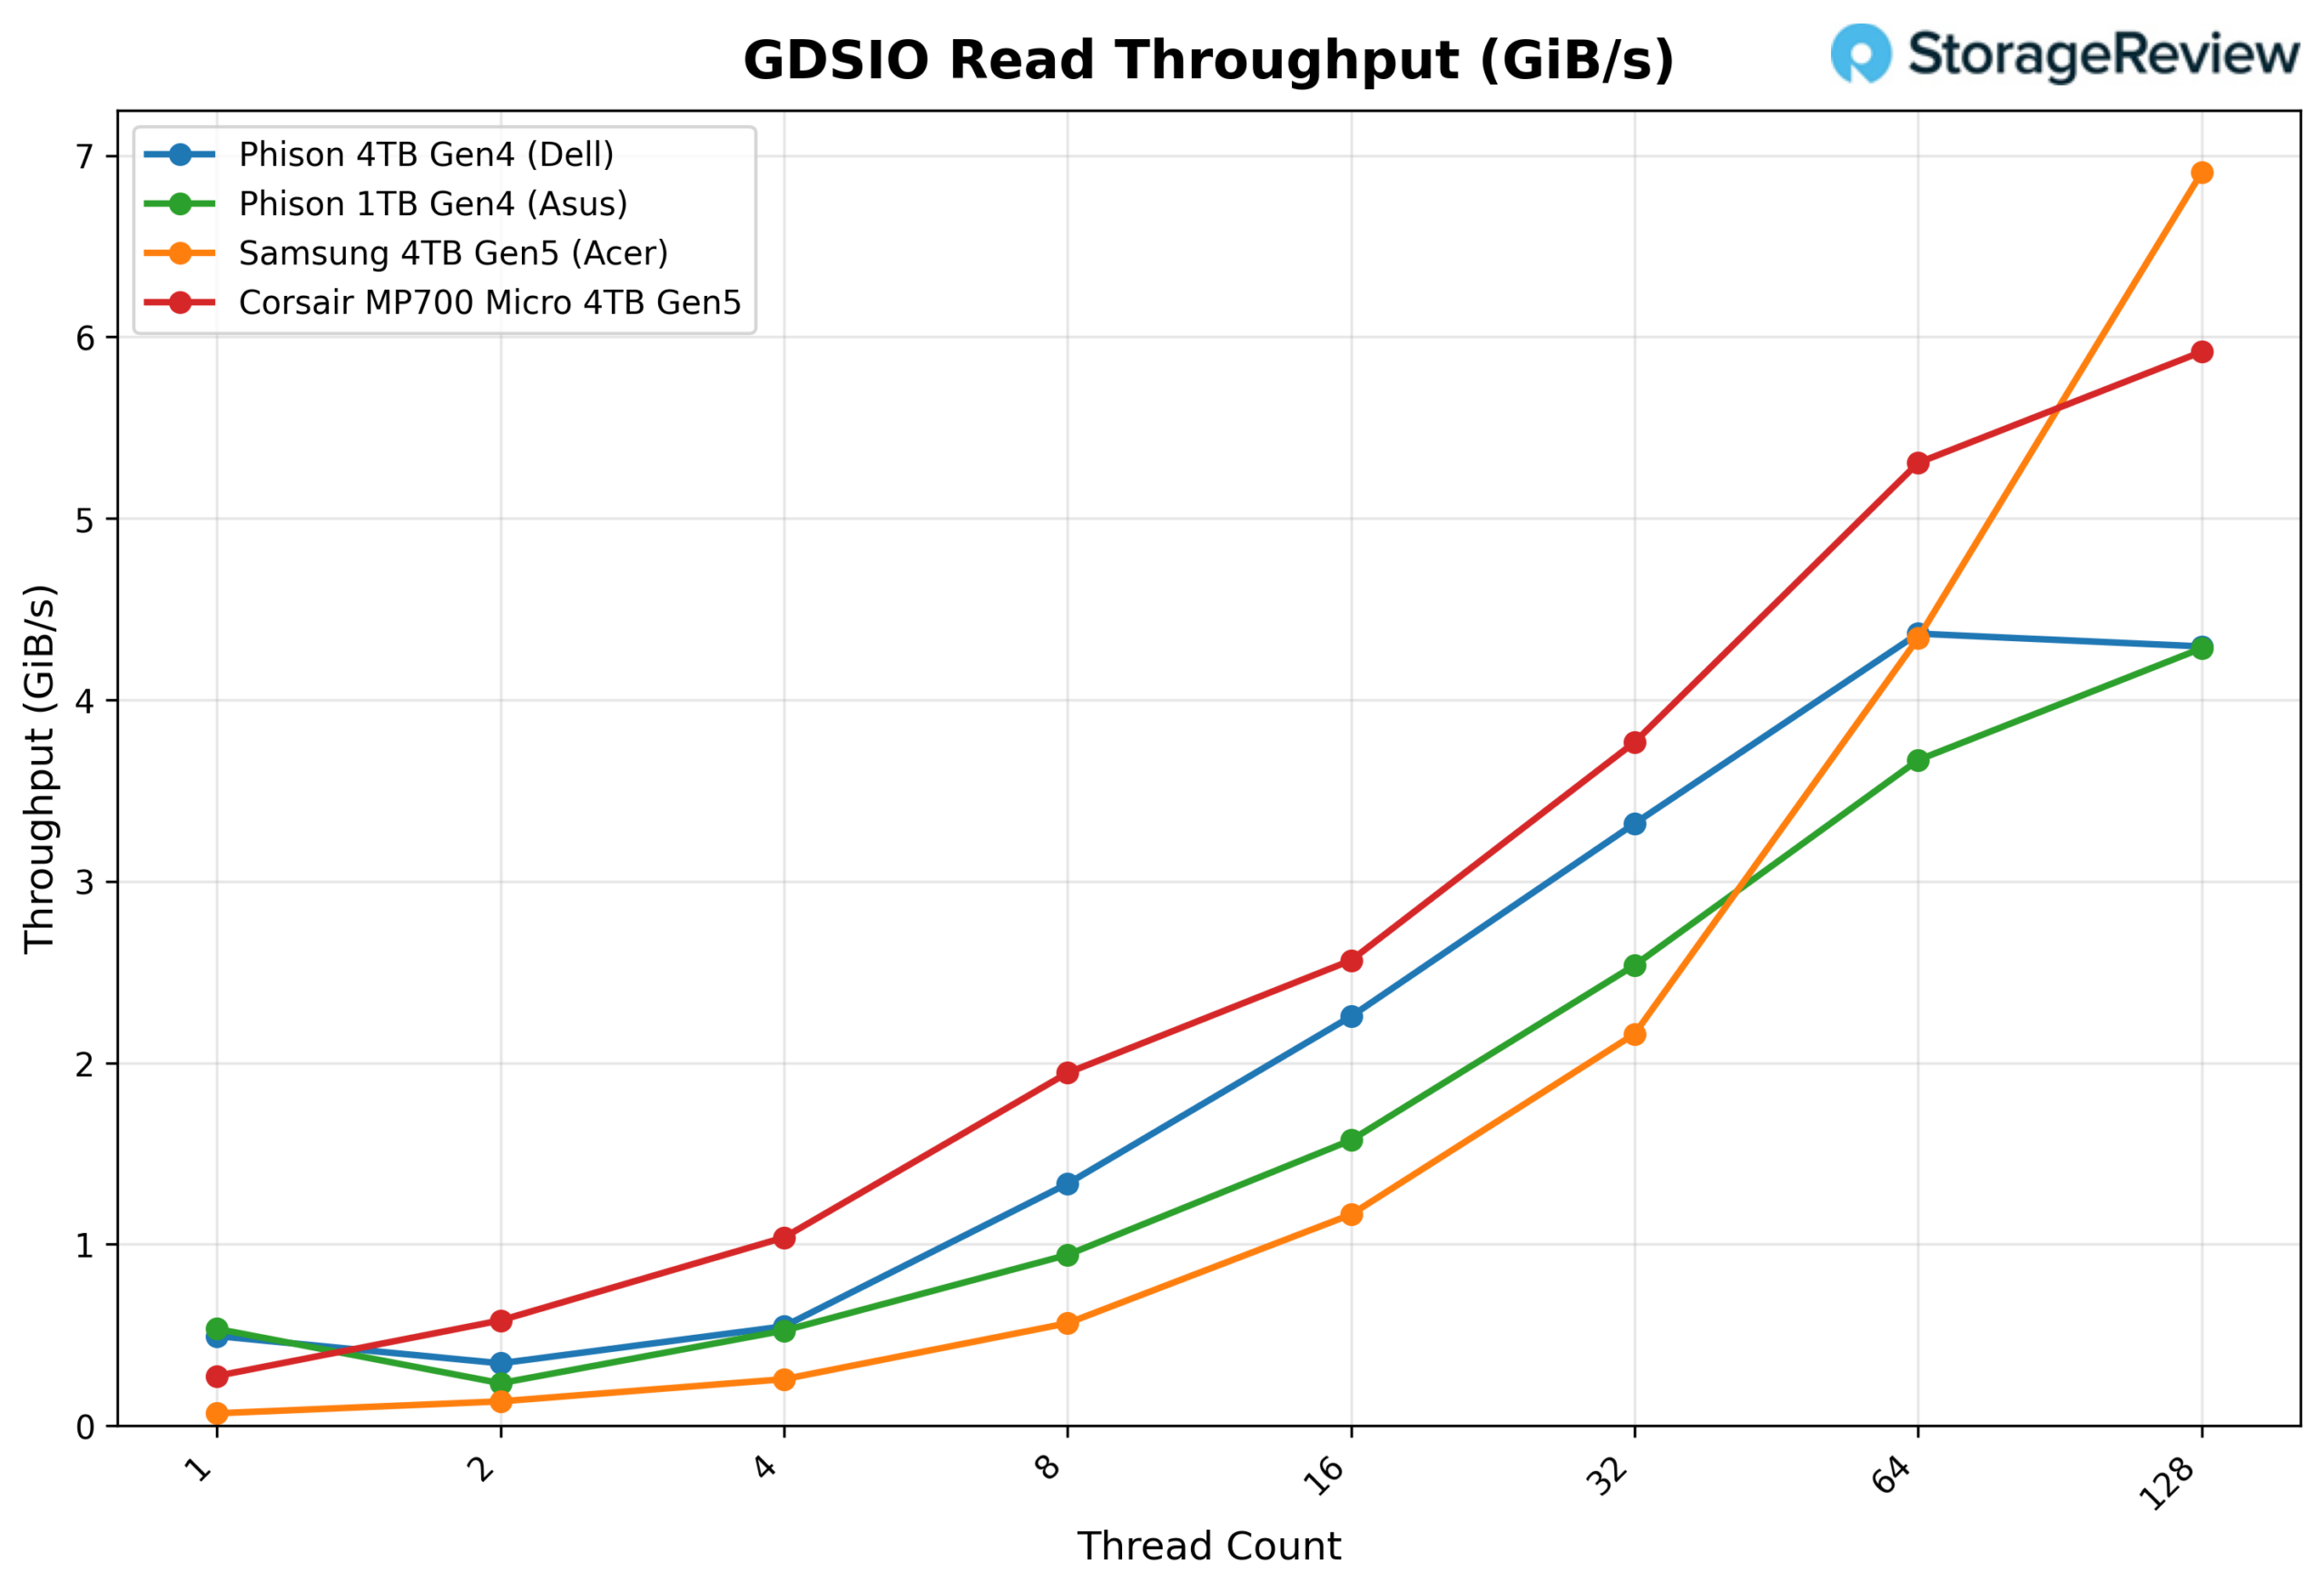
In the 16K read test using GPU Direct Storage, the Corsair MP700 MICRO shows steady scaling as thread counts increase, gradually building throughput. Starting at 0.27GiB/s with a single thread, performance climbs to 0.58GiB/s at two threads and 1.04GiB/s at four threads. The drive continues to scale efficiently with higher queue depths, reaching 1.94GiB/s at eight threads and 2.56GiB/s at sixteen threads. Throughput continues rising to 3.77GiB/s at thirty-two threads and 5.31GiB/s at sixty-four threads, eventually topping out around 5.92GiB/s at 128 threads. Compared to the other drives in the chart, the MP700 MICRO performs particularly well at moderate thread counts, leading the group through much of the midrange before the Samsung Gen5 drive overtakes it at the highest thread count.

GDSIO Read Latency 16K

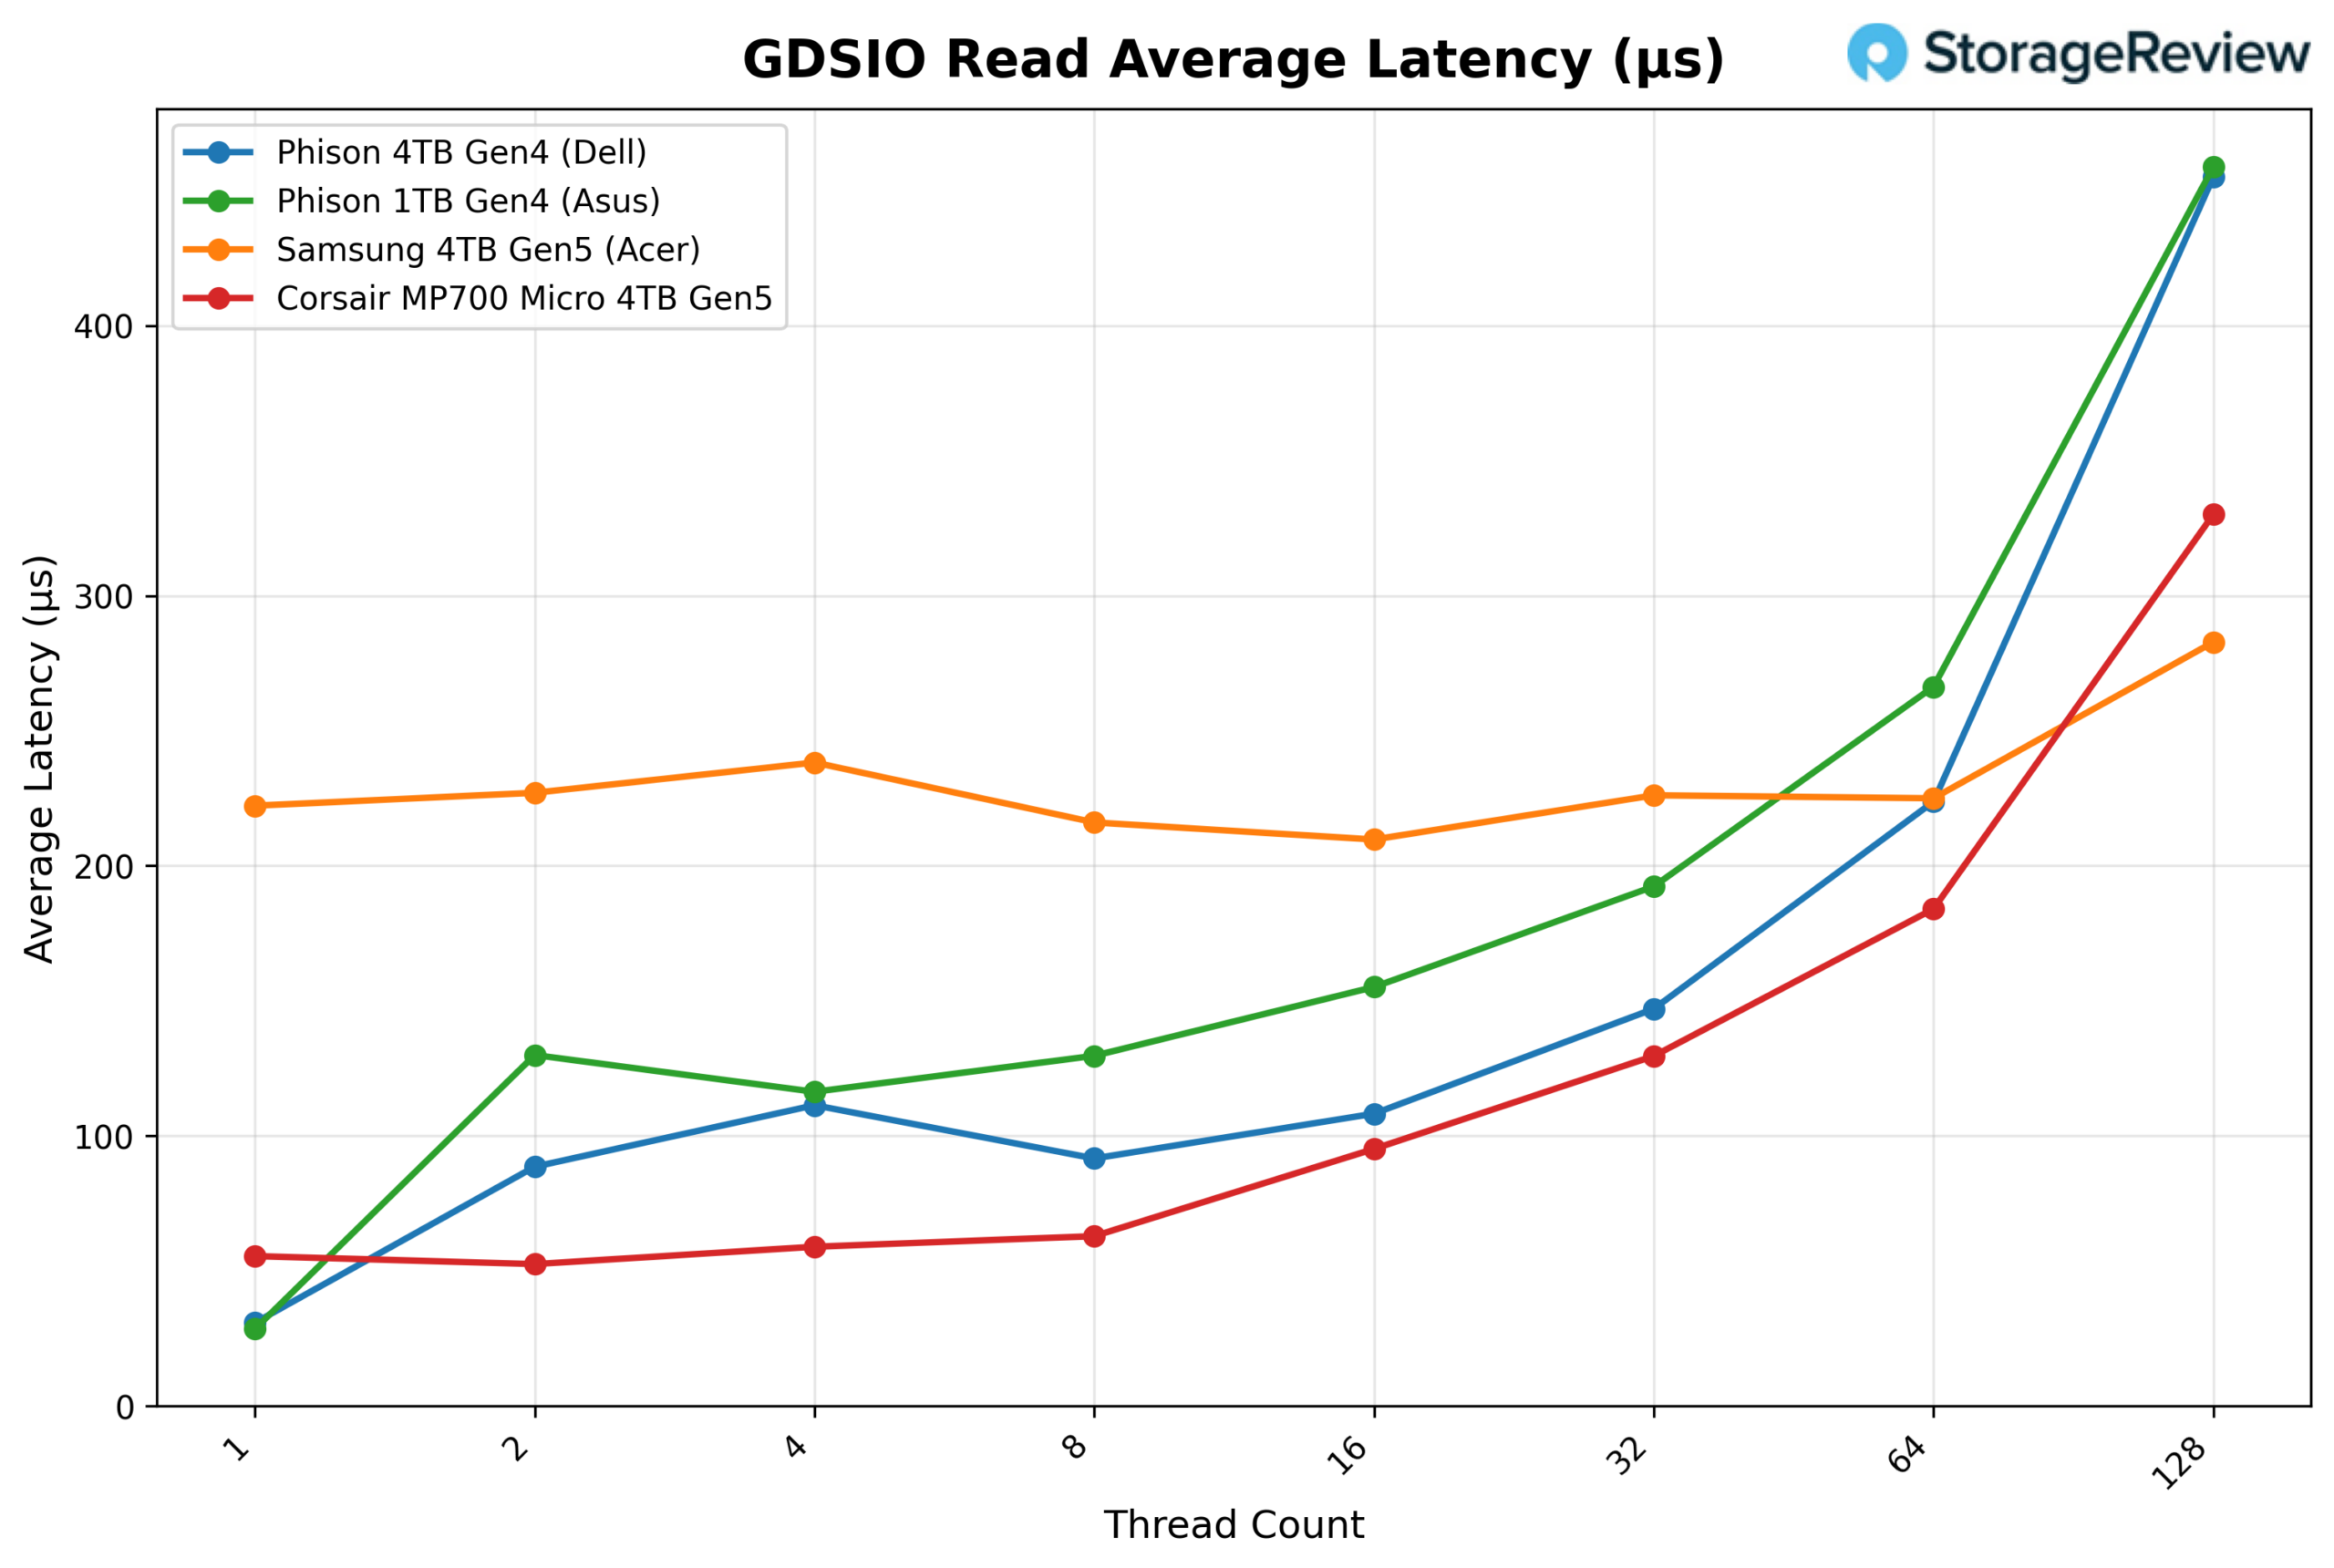
Latency for the 16K read workload starts relatively low and increases gradually as concurrency builds. At one thread, the Corsair MP700 MICRO records an average latency of about 55.5µs, improving slightly to around 52.6µs with two threads before rising to 59.0µs at four threads and 62.9µs at eight threads. As the queue depth increases further, latency grows more noticeably, reaching about 95.2µs at sixteen threads and 129.6µs at thirty-two threads. Higher thread counts continue this upward trend, with latency measuring roughly 184.0 µs at 64 threads and 330.0 µs at 128 threads. Even as the thread count increases, latency remains relatively controlled through the midrange of the test, only climbing more sharply once the workload reaches the highest thread counts.

GDSIO Write Throughput 16K

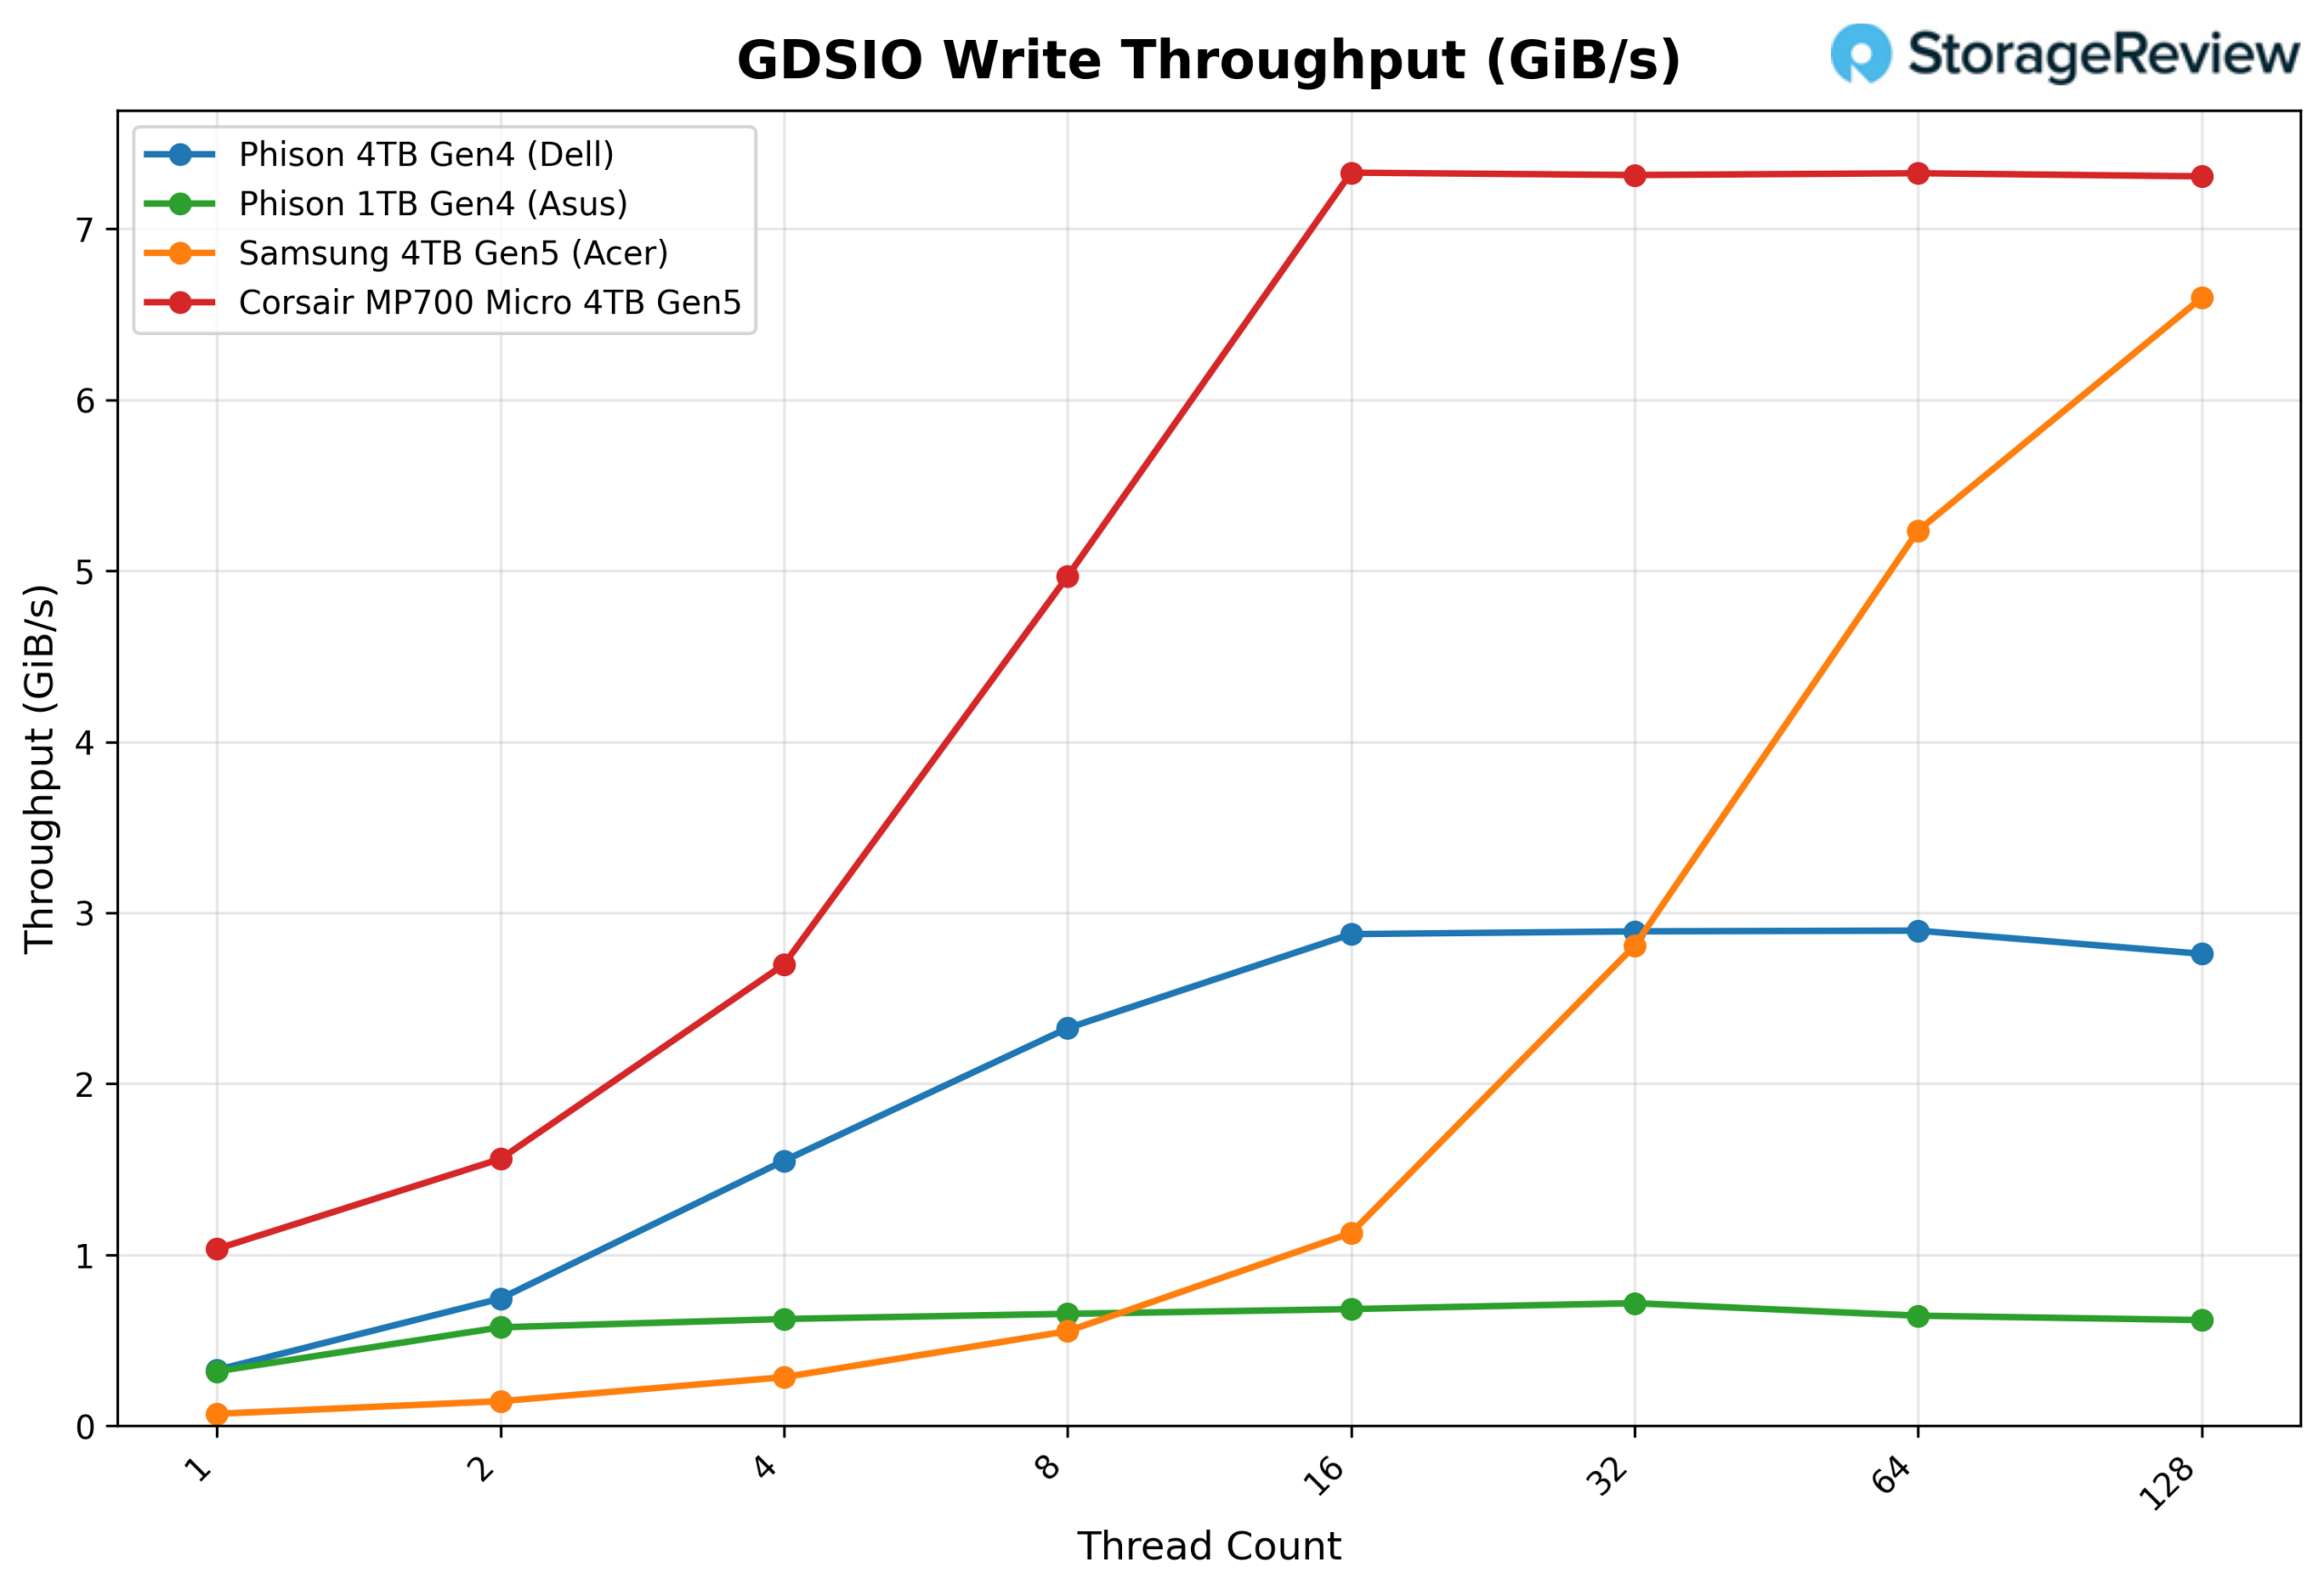
In the 16K write workload using GPU Direct Storage, the MP700 MICRO scales aggressively as thread counts increase, quickly climbing into its steady-state performance range. Starting at 1.03GiB/s with a single thread, throughput rises to 1.56GiB/s at two threads and 2.70GiB/s at four threads. Performance continues ramping with higher thread counts, reaching 4.97GiB/s at eight threads and peaking around 7.33GiB/s at sixteen threads. Beyond that point, the drive effectively plateaus, maintaining roughly 7.31 to 7.32GiB/s through 32, 64, and 128 threads. Compared with the other drives in the chart, the MP700 MICRO reaches its maximum throughput much earlier and maintains that level for the rest of the test, maintaining its lead throughout.

GDSIO Write Latency 16K

Latency begins very low in the 16K write test and stays that way as the leader. At a single thread, the Corsair MP700 MICRO records an average latency of about 14.7µs, rising to 19.6µs at two threads and 22.8µs at four threads. Even as throughput scales rapidly, latency remains relatively controlled by moderate queue depths, measuring 24.8 µs at eight threads and 33.3 µs at sixteen threads. As the number of threads increases, latency rises to 66.8µs at 32 threads, 133.3µs at 64 threads, and eventually about 267.2µs at 128 threads.

Conclusion

Overall, the Corsair MP700 MICRO 4TB delivers strong performance in a compact M.2 2242 form factor, offering a high-capacity option for systems that need serious storage throughput in a very limited physical footprint. Systems such as the Spark-class AI workstations rely entirely on that shorter module length, which narrows the range of drives that can be installed. In that environment, a drive that combines PCIe Gen5 bandwidth with 4TB of TLC NAND provides a nice upgrade path for local storage capacity and throughput. Other compact platforms, including high-end laptops that rely on a single 2242 slot, benefit from sufficient internal capacity for large datasets, AI models, and project files while still maintaining the high transfer speeds expected of modern NVMe storage.

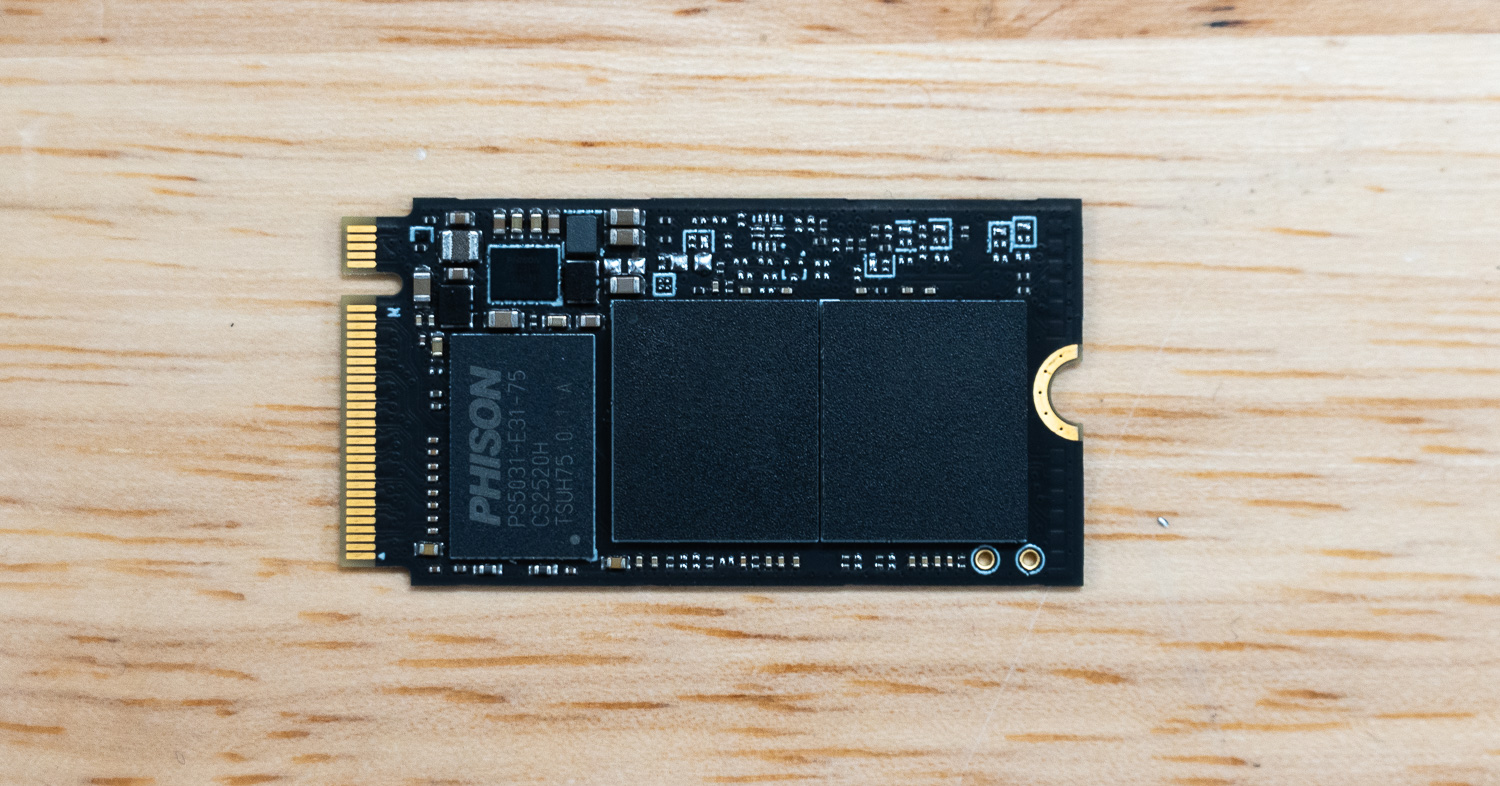
Corsair MP700 MICRO phison controller

Compared with the OEM Phison Gen4 drives used in the Dell Pro Max with GB10 and the ASUS Ascent GX10, the Corsair drive delivers stronger overall performance across several workloads, including GPU Direct Storage tests, where throughput scales quickly and remains steady at higher thread counts. Read-heavy scenarios still favor the Samsung Gen5 drive (which was used inside the Acer Veriton GN100), particularly in tests such as LLM model loading and peak sequential throughput. Ultimately, the Corsair drive primarily serves as an upgrade over Gen4 configurations, but it falls behind the faster Samsung Gen5 implementation.

The value of the MP700 MICRO becomes most apparent when the form-factor constraint is taken into account. Delivering PCIe Gen5 speeds alongside a full 4TB capacity within a 2242 module is still relatively uncommon. That combination gives compact compute platforms significantly more local storage headroom than many alternatives in this size class. Systems built around the Spark ecosystem, compact AI workstations, and thin mobile platforms all benefit from that added capacity and bandwidth when working with large datasets or model files. Priced at $1,034.99 on Corsair’s website and backed by a 5-year warranty, the MP700 MICRO is a premium option for users who require both high capacity and modern interface performance in a 2242 storage slot.

Product Page – Corsair MP700 MICRO 4TB

The post Corsair MP700 MICRO 4TB Review: PCIe Gen5 Performance in a Compact 2242 SSD appeared first on StorageReview.com.
Micron 3610 Review: A Focused Entry Into Gen5 QLC

The Micron 3610 SSD targets the evolving needs of mainstream computing and is widely positioned as one of the first PCIe Gen5 client SSDs built on QLC NAND. By pairing Micron’s latest 9th-generation (G9) QLC with a DRAMless, power-conscious design, the 3610 aims to bridge the gap between notebook efficiency and the burst performance expected from a modern Gen5 interface. Available in capacities from 1TB to 4TB and multiple M.2 form factors, this review focuses on the 2TB 2280 single-sided model to see how well that balance holds up in real-world testing.

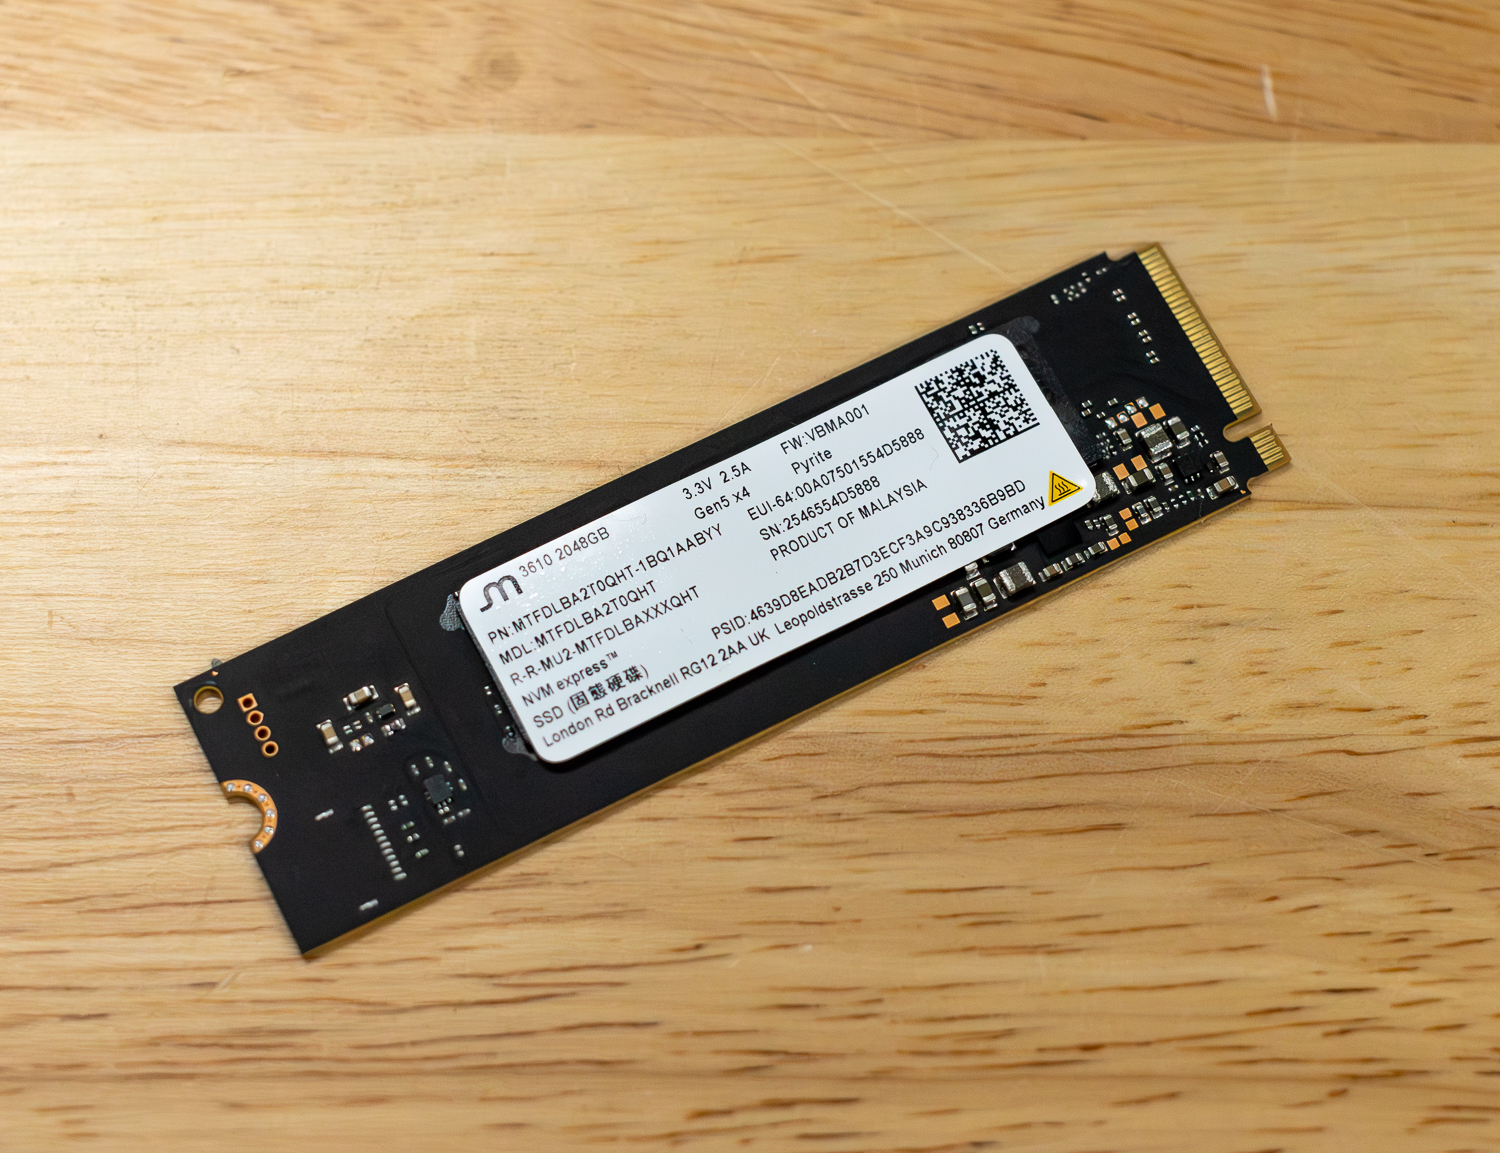
Micron 3610

Examining the performance specs reveals that sequential reads hit a staggering 11,000 MB/s across all capacities, with writes reaching 9,300 MB/s for the 2TB and 4TB models. Random IOPS have also seen a massive uplift, reaching up to 1,500K for reads and 1,600K for writes. Despite this performance, the drive maintains a focus on efficiency for notebook deployments, boasting up to 43% better performance per watt than previous Gen4 TLC solutions.

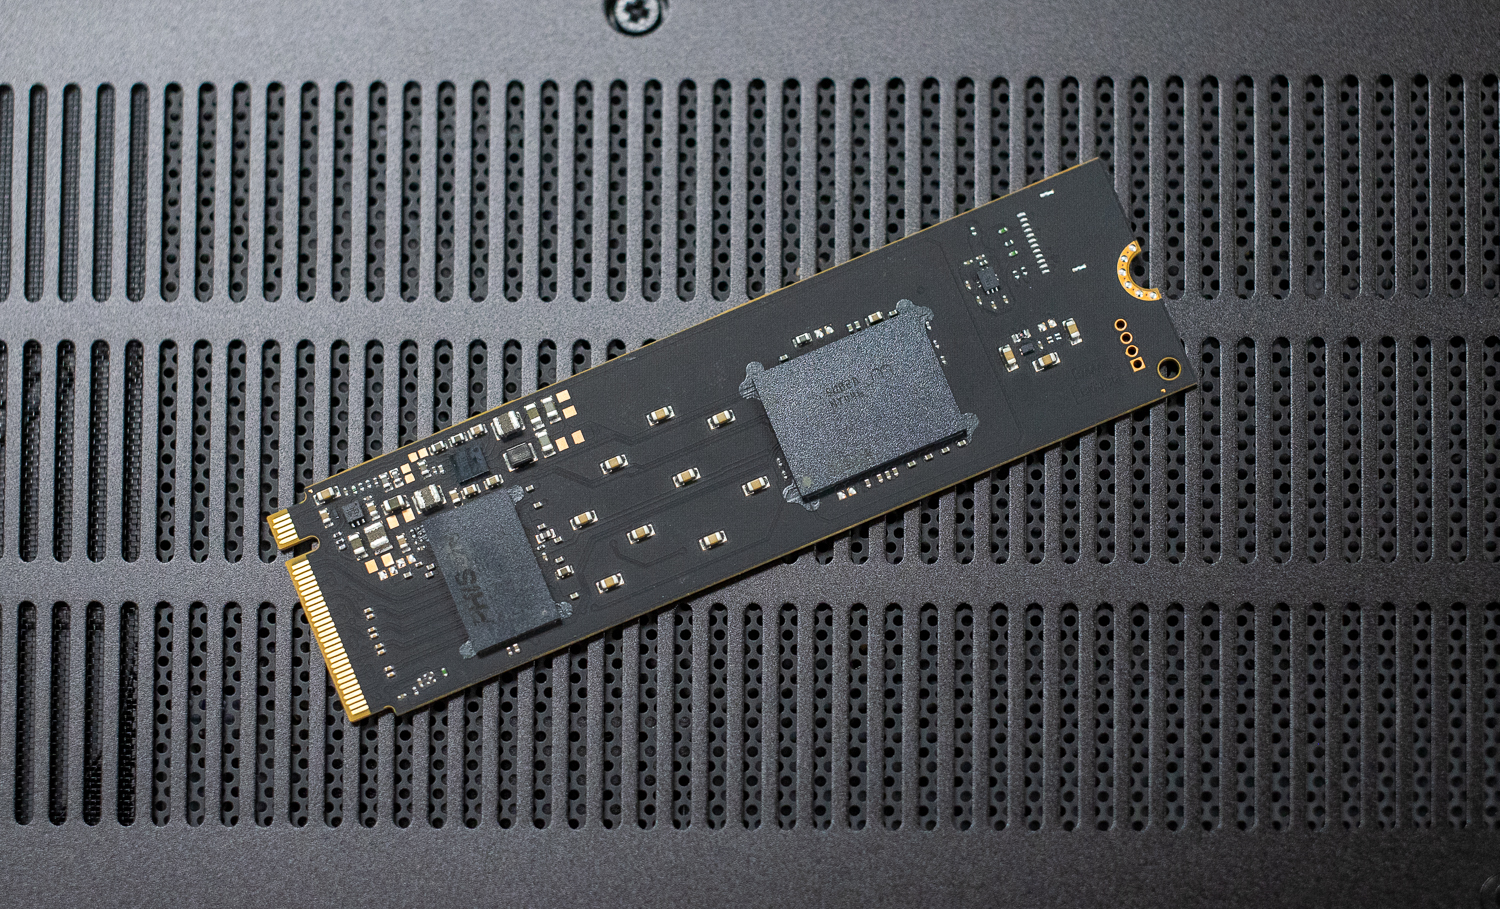
Micron 3610 back

Micron 3610 Features and Market Positioning

Micron leverages its G9 QLC NAND with a Phison E31 controller on the 3610, featuring the industry’s first 2TB QLC NAND die. This density enables high capacity in small form factors, while the ONFI 5.0 interface supports internal speeds up to 3.6 GT/s. By moving to a DRAM-less architecture that utilizes a Host Memory Buffer (HMB), Micron keeps the physical footprint and power consumption low, making it ideal for thin-and-light laptops that still require workstation-class burst speeds.

Endurance ratings are solid for QLC, ranging from 400 TBW for the 1TB model to 1600 TBW for the 4TB version. The drive also emphasizes security, featuring DICE (Device Identifier Composition Engine) and DOE (Data Object Exchange) protocols to ensure firmware integrity.

In terms of positioning, the Micron 3610 is a niche disruptor. It competes directly with entry-level Gen5 drives and high-end Gen4 TLC drives, offering a compelling alternative for users who prioritize burst speed and modern interface support over sustained heavy write endurance or low-latency daily tasks.

Specification 1TB 2TB 4TB
General Information
Category Mainstream PCs and notebooks
Model Micron 3610 SSD
Form factor M.2 (22mm x 30mm, 22mm x 42mm, 22mm x 80mm)
Interface PCIe Gen5, NVMe 2.0d
Performance
Sequential read (MB/s) 11,000 11,000 11,000
Sequential write (MB/s) 7,200 9,300 9,300
Random read (KIOPS) 850 1,500 1,500
Random write (KIOPS) 1,500 1,600 1,600
Read latency (TYP) (µs) 50 50 50
Write latency (TYP) (µs) 12 12 12
Reliability & Endurance
Endurance (TBW) 400 800 1600
MTTF (million hours) 2 2 2
Power Consumption
Sleep/PS4 power (mW) <2.5 <2.5 <2.5
Active idle power (mW) <150 <150 <150
Active read power (mW) <6,500 <6,500 <6,500
Advanced Features
Feature List Micron G9 QLC NAND
Hardware-based AES 256-bit encryption
Power-loss protection (data at rest)
Host-controlled thermal management (HCTM)
Performance-enhancing Micron AWT
Thermal S.M.A.R.T. via SMBus
Basic management commands (BMC)
FW activate without reset
Sanitize block and crypto erase
Power-loss signal support
TCG Opal 2.02, TCG Pyrite 2.01, DOE, DICE
Micron Storage Executive SSD management tool

Peak Synthetic Performance

The FIO test is a flexible and powerful benchmarking tool for measuring the performance of storage devices, including SSDs and HDDs. It evaluates metrics such as bandwidth, IOPS, and latency under different workloads, like sequential and random read/write operations. This test helps to assess the peak performance of storage systems, making it useful for comparing different devices or configurations. We measured the peak burst performance for this test, limiting the workload to a 10GB footprint on both SSDs.

In the FIO synthetic benchmarks, the Micron 3610 displays a very unusual performance profile compared to other QLC drives. While most drives prioritize read speeds, the 3610 actually performs better in sequential writes than in reads.

The 3610’s sequential read speed (6,839 MB/s) is the lowest in the QLC stack, trailing the Crucial P510 (8,835 MB/s) and PNY CS2150 (10,400 MB/s). However, its sequential write speed (9,673 MB/s) is significantly higher than the Micron 2600 (6,612 MB/s) and Crucial P310 (6,376 MB/s). It also punches well above its weight in random 4K writes (1.871M IOPS), outperforming all other QLC competitors, including the PNY CS2150 and Crucial P310.

FIO Test (higher MB/s/IOPS is better) Sequential 128K Read (1T/64Q) Sequential 128K Write (1T/64Q) Random 4K Read (16T/32Q) Random 4K Write (16T/32Q)
SanDisk SN8100 15,000 MB/s (0.56ms avg latency) 14,100 MB/s (0.59ms avg latency) 2.312M IOPS (0.22ms avg latency) 2.144M IOPS (0.24ms avg latency)
Kingston FURY Renegade G5 14,600 MB/s (0.57ms avg latency) 14,100 MB/s (0.59ms avg latency) 2.028M IOPS (0.25ms avg latency) 2.028M IOPS (0.25ms avg latency)
Samsung 9100 Pro 14,600 MB/s (0.57ms avg latency) 13,300 MB/s (0.63ms avg latency) 2.734M IOPS (0.18ms avg latency) 2.734M IOPS (0.19ms avg latency)
SK hynix Platinum P51 14,500 MB/s (0.58ms avg latency) 13,500 MB/s (0.62ms avg latency) 2.369M IOPS (0.22ms avg latency) 2.669M IOPS (0.19ms avg latency)
Crucial T705 14,400 MB/s (0.58ms avg latency) 12,300 MB/s (0.68ms avg latency) 1.585M IOPS (0.32ms avg latency) 2.703M IOPS (0.19ms avg latency)
TEAMGROUP GE Pro 2TB 13,900 MB/s (0.60ms avg latency) 12,800 MB/s (0.65ms avg latency) 2.585M IOPS (0.23ms avg latency) 1.818M IOPS (0.28ms avg latency)
Lexar Professional NM1090 PRO 13,800GB/s (0.61ms avg latency) 13,600 MB/s (0.62ms avg latency) 2.251M IOPS (0.23ms avg latency) 1.818M IOPS (0.28ms avg latency)
TEAMGROUP GC Pro 2TB 13,600 MB/s (0.62ms avg latency) 12,700 MB/s (0.66ms avg latency) 2.110M IOPS (0.24ms avg latency) 1.686M IOPS (0.28ms avg latency)
PNY CS2150 10,400GB/s (0.80ms avg latency) 8,801MB/s (0.95ms avg latency) 1.379M IOPS (0.371ms avg latency) 1.623 IOPS (0.32ms avg latency)
Crucial P510 8,835 MiB/s (0.90 ms avg latency) 9,961 MB/s (0.80 ms avg latency) 1.163M IOPS (0.44ms avg latency) 1.196M IOPS (0.51ms avg latency)
Micron 3610 2TB 6,839 MB/s (1.23ms avg latency) 9,673 MB/s (0.87ms avg latency) 1.523M IOPS (0.34ms avg latency) 1.871M IOPS (0.27ms avg latency)
Samsung 990 Pro 7,483 MB/s (1.12ms avg latency) 7,197 MB/s (1.16ms avg latency) 1.400M IOPS (0.36ms avg latency) 1.403M IOPS (0.36ms avg latency)
Crucial P310 2TB 7,197 MB/s (1.16ms avg latency) 6,376 MB/s (1.31ms avg latency) 1.163M IOPS (0.44ms avg latency) 1.196M IOPS (0.43ms avg latency)
WD SN850X 2TB 6,632 MB/s (0.76ms avg latency) 7,235 MB/s (0.92ms avg latency) 1.2M IOPS (0.43ms avg latency) 825K IOPS (0.62ms avg latency)
Micron 2600 2TB 5,702 MB/s (1.47ms avg latency) 6,612 MB/s (1.27ms avg latency) 1.11M IOPS (0.46ms avg latency) 1.36M IOPS (0.38ms avg latency)

Average LLM Load Time

The Average LLM Load Time test evaluated the load times of three different LLMs: DeepSeek R1 7B, Meta Llama 3.2 11B, and DeepSeek R1 32B. Each model was tested 10 times, and the average load time was calculated. This test measures the drive’s ability to quickly load large language models (LLMs) into memory. LLM load times are critical for AI-related tasks, especially for real-time inference and processing large datasets. Faster loading enables the model to process data more quickly, thereby improving AI responsiveness and reducing wait times.

When it comes to loading Large Language Models into memory, the Micron 3610 ranks last among QLC drives. Because LLM loading is a read-intensive task, the 3610’s lower sequential read ceiling becomes a bottleneck. For the DeepSeek R1 32B model, the 3610 takes 5.57 seconds, which is nearly a full second slower than the PNY CS2150 (4.89s). Across all three models (7B, 11B, and 32B), the 3610 consistently trails the Crucial P510 and Micron 2600, making it less suitable for users who frequently swap large AI models in and out of VRAM.

Average LLM Load Time (lower is better) DeepSeek R1 7B Meta Llama 3.2 11B Vision DeepSeek R1 32B
SK hynix Platinum P51 2.5481s 3.5809s 4.1790s
SanDisk SN8100 2.5702s 3.5856s 4.2870s
Samsung 9100 Pro 4TB 2.6173s 3.6017s 4.3735s
PNY CS2150 2.8107s 3.6820s 4.8962s
Crucial T705 2TB 2.8758s 3.6312s 5.1080s
Samsung 990 Pro 2TB 2.8758s 3.6312s 5.1080s
Crucial P510 1TB 2.8817s 3.6631s 5.0594s
TEAMGROUP GE Pro 2TB 2.9092s 3.9136s 4.8974s
TEAMGROUP GC Pro 2TB 2.9379s 3.9267s 4.8188s
WD SN850X 2TB 3.0082s 3.6543s 5.4844s
Kingston FURY Renegade G5 3.1843s 4.8009s 4.6523s
Crucial P310 2TB 3.1889s 3.7083s 5.4844s
Lexar Professional NM1090 PRO 3.2135s 4.9504s 7.2108s
Micron 2600 2TB 3.3178s 3.9174s 5.9060s
Micron 3610 2TB 3.5348s 5.3853s 5.5731s

3DMark Direct Storage

The 3DMark DirectStorage Feature Test evaluates how Microsoft’s DirectStorage optimizes game asset loading on PCIe SSDs. By reducing CPU overhead and improving data transfer speeds, DirectStorage enhances loading times, especially when paired with GDeflate compression and Windows 11’s BypassIO. This test isolates storage performance to highlight the potential bandwidth improvements when DirectStorage is enabled.

The Micron 3610 finds its redemption in DirectStorage scenarios. Despite its lower synthetic read speeds, it handles compressed game assets surprisingly well. In the Storage to VRAM (GDeflate) test, the 3610 reached 20.29 GB/s, beating out the Crucial P510 (19.63 GB/s) and the PNY CS2150 (19.49 GB/s). It significantly outperforms the Micron 2600 (14.11 GB/s) and Crucial P310 (14.81 GB/s) in this category, suggesting that its controller or firmware is better optimized for the high-bandwidth, multi-request nature of DirectStorage.

3DMark Direct Storage, (GB/s, higher is better) Storage to VRAM (GDeflate Compression) Storage to VRAM (DirectStorage on, Uncompressed) Storage to VRAM (DirectStorage off, Uncompressed) Storage to RAM (DirectStorage on, Uncompressed) Storage to RAM (DirectStorage off, Uncompressed) GDeflate Decompression Bandwidth
SK hynix Platinum P51 26.32 11.20 7.75 12.85 9.46 64.68
SanDisk SN8100 26.11 12.94 7.63 12.94 9.78 64.51
Crucial T705 2TB 25.75 10.71 8.79 12.03 8.83 66.36
TEAMGROUP GE Pro 2TB 24.70 10.19 7.49 11.33 9.35 65.05
Lexar Professional NM1090 PRO 24.03 11.23 7.57 12.18 8.72 63.15
Samsung 9100 Pro 4TB 23.77 11.26 8.92 11.62 9.48 66.61
Kingston FURY Renegade G5 23.29 10.03 7.44 11.81 9.63 65.79
TEAMGROUP GC Pro 2TB 22.94 9.46 7.13 10.71 8.14 63.80
Micron 3610 2TB 20.29 9.42 6.94 7.93 8.48 65.46
Crucial P510 1TB 19.63 8.33 6.92 9.06 7.49 66.22
PNY CS2150 19.49 8.60 6.98 9.22 7.70 62.43
WD SN850X 2TB 15.28 11.11 8.93 6.78 6.27 64.96
Crucial P310 2TB 14.81 10.75 8.56 6.46 5.87 65.43
Samsung 990 Pro 2TB 14.18 11.28 8.84 6.57 6.20 65.71
Micron 2600 2TB 14.11 5.93 5.27 6.34 5.50 64.09

PCMark 10 Storage Benchmark

PCMark 10 Storage Benchmarks evaluate real-world storage performance using application-based traces. It tests the system and data drives, measuring bandwidth, access times, and consistency under load. These benchmarks offer practical insights beyond synthetic tests, enabling users to compare modern storage solutions effectively.

In real-world application traces, the Micron 3610 struggles to keep pace with the rest of the QLC stack. With a score of 5,635, it is the lowest-performing QLC drive in this specific test. It lags the Micron 2600 (5,885) and trails the Crucial P310 (6,436) by a significant margin. This indicates that for general “daily driver” tasks like booting Windows, launching apps, or moving small files, the 3610’s latency and overhead result in a less responsive experience than its peers.

PCMark 10 Data Drive (higher is better) Overall Score
Crucial T705 2TB 8,783
SK hynix Platinum P51 8,665
SanDisk SN8100 8,644
Lexar Professional NM1090 PRO 8,247
Kingston FURY Renegade G5 8,062
TEAMGROUP GC Pro 2TB 7,648
Samsung 9100 Pro 4TB 7,552
Samsung 990 Pro 2TB 7,173
TEAMGROUP GE Pro 2TB 6,957
Crucial P310 2TB 6,436
PNY CS2150 6,070
Micron 2600 2TB 5,885
Micron 3610 2TB 5,635
WD SN850X 2TB 4,988

BlackMagic Disk Speed Test

The BlackMagic Disk Speed Test benchmarks a drive’s read and write speeds to estimate its performance, especially for video editing tasks. It helps users ensure their storage is fast enough for high-resolution content, like 4K or 8K video.

In the BlackMagic test, we see the trade-offs of 4-bit NAND. While most TLC drives are pushing 9,000+ MB/s, the QLC models sit at the bottom, but with one major surprise. Despite being QLC, it achieves an 8,519 MB/s write speed, outperforming TLC competitor drives like the Samsung 990 Pro and WD SN850X in this specific burst test. This is likely due to Micron’s aggressive SLC caching.

BlackMagic Disk Speed (MB/s, higher is better) Read MB/s Write MB/s
SanDisk SN8100 10,005.2 10,581.0
Kingston FURY Renegade G5 9,665.0 10,831.0
Samsung 9100 Pro 4TB 9,542.3 9,907.9
SK hynix Platinum P51 9,241.0 9,109.0
Lexar Professional NM1090 PRO 9,149.2 10,466.6
Crucial T705 2TB 8,464.2 10,256.4
Crucial P510 1TB 7,853.9 7,939.6
TEAMGROUP GE Pro 2TB 6933.6 8700.6
PNY CS2150 6,625.5 7,299.5
TEAMGROUP GC Pro 2TB 6,476.8 7,796.8
WD SN850X 2TB 5,862.6 5,894.8
Micron 3610 2TB 5,834,9 8,519.1
Samsung 990 Pro 2TB 5,769.5 5,842.9
Crucial P310 2TB 5,282.4 5,458.9
Micron 2600 2TB 4,663.3 5,607.4

GPU Direct Storage

One of the tests we conducted on this testbench was the Magnum IO GPU Direct Storage (GDS) test. GDS is a feature developed by NVIDIA that allows GPUs to bypass the CPU when accessing data stored on NVMe drives or other high-speed storage devices. Instead of routing data through the CPU and system memory, GDS enables direct communication between the GPU and the storage device, significantly reducing latency and improving data throughput.

How GPU Direct Storage Works

Traditionally, when a GPU processes data stored on an NVMe drive, the data must first travel through the CPU and system memory before reaching the GPU. This process introduces bottlenecks because the CPU acts as a middleman, adding latency and consuming valuable system resources. GPU Direct Storage eliminates this inefficiency by enabling the GPU to access data directly from the storage device via the PCIe bus. This direct path reduces data-movement overhead, enabling faster, more efficient data transfers.

AI workloads, especially those involving deep learning, are highly data-intensive. Training large neural networks requires processing terabytes of data, and any delay in data transfer can lead to underutilized GPUs and longer training times. GPU Direct Storage addresses this challenge by ensuring that data is delivered to the GPU as quickly as possible, minimizing idle time and maximizing computational efficiency.

In addition, GDS is particularly beneficial for workloads that involve streaming large datasets, such as video processing, natural language processing, or real-time inference. By reducing the reliance on the CPU, GDS accelerates data movement and frees up CPU resources for other tasks, further enhancing overall system performance.

The data truly gets “spicy” when analyzing GPU Direct Storage (GDS) performance, particularly where the Micron 3610 starts to show cracks in QLC performance. While GDS is engineered to bypass the CPU and feed data directly to the GPU to reduce latency, the 3610 sees its 16K Block Average Write speed plummet to a measly 307.7 MiB/s, which is a sharp decline compared to the 1.5–2.4 GiB/s seen by Gen 5 TLC drives. This performance crater is essentially the “QLC Tax” in action: the drive’s DRAMless architecture, paired with the slower nature of QLC NAND, struggles with small-block random writes, causing it to effectively “stutter” when handling tiny data chunks directly from the GPU. Paradoxically, the Crucial P310 and Micron 2600, which are both older Gen 4 QLC designs, show far greater consistency at this 16K block size, with speeds reaching 2.1–2.2 GiB/s. This suggests that for AI or gaming workloads involving massive quantities of small files, the more mature Gen 4 QLC architecture is actually more stable and reliable than the early, “speed-focused” Gen 5 QLC implementation found in the 3610.

GDSIO Chart (16K,128K,1M Block Size Averages) (16K Block Size 128 IO Depth) Average Read (16K Block Size 128 IO Depth) Average Write (128K Block Size 128 IO Depth) Average Read (128K Block Size 128 IO Depth) Average Write (1M Block Size 128 IO Depth) Average Read (1M Block Size 128 IO Depth) Average Write
Kingston FURY Renegade G5 3.7 GiB/s (0.526ms) IOPS: 242.1K 2.4 GiB/s (0.824ms) IOPS: 154.7K 5.9 GiB/s (2.704ms) IOPS: 48.5K 5.8 GiB/s (0.564ms) IOPS: 47.3K 6.5 GiB/s (19.356ms) IOPS: 6.6K 6.3 GiB/s (19.690ms) IOPS: 6.5K
Lexar Professional NM1090 PRO 3.6 GiB/s (0.533ms) IOPS: 238.7K 2.3 GiB/s (0.845ms) IOPS: 150.8K 5.9 GiB/s (2.639ms) IOPS: 48.4K 4.2 GiB/s (3.714ms) IOPS: 34.4K 6.5 GiB/s (19.274ms) IOPS: 6.6K 6.2 GiB/s (20.127ms) IOPS: 6.4K
SanDisk SN8100 3.4 GiB/s (0.564ms) IOPS: 225.9K 2.1 GiB/s (0.907ms) IOPS: 140.6K 5.9 GiB/s (2.626ms) IOPS: 48.7K 5.8 GiB/s (2.668ms) IOPS: 47.9K 6.5 GiB/s (19.264ms) IOPS: 6.6K 5.9 GiB/s (21.063ms) IOPS: 6.1K
Samsung 9100 Pro 4TB 3.4 GiB/s (0.565ms) IOPS: 226.4K 2.3 GiB/s (0.839ms) IOPS: 161.7K 5.2 GiB/s (3.001ms) IOPS: 44.9K 5.9 GiB/s (2.662ms) IOPS: 47.3K 6.3 GiB/s (19.877ms) IOPS: 6.4K 6.1 GiB/s (20.579ms) IOPS: 6.2K
Crucial T705 2TB 3.3 GiB/s (0.587ms) IOPS: 217.0K 2.3 GiB/s (0.836ms) IOPS: 152.6K 5.5 GiB/s (2.863ms) IOPS: 44.7K 5.6 GiB/s (2.799ms) IOPS: 45.7K 6.0 GiB/s (20.738ms) IOPS: 6.2K 6.0 GiB/s (20.855ms) IOPS: 6.1K
SK hynix Platinum P51 3.1 GiB/s (0.634ms) IOPS: 200.9K 1.5 GiB/s (1.314ms) IOPS: 97.2K 5.6 GiB/s (2.781ms) IOPS: 46.0K 3.9 GiB/s (4.014ms) IOPS: 31.9K 6.2 GiB/s (20.126ms) IOPS: 6.4K 4.2 GiB/s (29.576ms) IOPS: 4.3K
Crucial P310 2TB 3.1 GiB/s (0.627ms) IOPS: 203.2K 2.2 GiB/s (0.902ms) IOPS: 141.4K 4.1 GiB/s (3.845ms) IOPS: 33.3K 3.9 GiB/s (3.992ms) IOPS: 32.0K 4.4 GiB/s (28.462ms) IOPS: 4.5K 4.1 GiB/s (30.964ms) IOPS: 4.2K
Micron 2600 2TB 3.1 GiB/s (0.629ms) IOPS: 202.4K 2.1 GiB/s (0.906ms) IOPS: 140.8K 4.0 GiB/s (3.889ms) IOPS: 32.9K 3.9 GiB/s (3.960ms) IOPS: 32.3K 4.4 GiB/s (28.535ms) IOPS: 4.5K 4.2 GiB/s (30.053ms) IOPS: 4.3K
Samsung 990 Pro 2TB 2.7 GiB/s (0.731ms) IOPS: 174.4K 2.2 GiB/s (0.903ms) IOPS: 141.2K 4.0 GiB/s (3.944ms) IOPS: 32.4K 4.1 GiB/s (3.849ms) IOPS: 33.2K 3.9 GiB/s (32.415ms) IOPS: 3.9K 4.2 GiB/s (29.520ms) IOPS: 4.3K
PNY CS2150 2.5 GiB/s (0.779ms) IOPS: 163.5K 1.8 GiB/s 1.107ms) IOPS: 115.3K 4.5 GiB/s (3.473ms) IOPS: 36.8K 4.7 GiB/s (3.357ms) IOPS: 38.1K 4.6 GiB/s (27.157ms) IOPS: 174.4K 4.9 GiB/s (25.682ms) IOPS: 5.0K
Crucial P510 2.3 GiB/s (0.837ms) IOPS: 152.2K 2.3 GiB/s (0.842ms) IOPS: 151.5K 4.5 GiB/s (3.450ms) IOPS: 37.1K 4.8 GiB/s (3.262ms) IOPS: 39.2K 4.8 GiB/s (26.218ms) IOPS: 4.9K 5.0 GiB/s (25.121ms) IOPS: 5.1K
WD SN850X 2.3 GiB/s (0.736ms) IOPS: 173.2K 2.0 GiB/s (0.989ms) IOPS: 129.0K 4.1 GiB/s (3.878ms) IOPS: 33.3K 4.0 GiB/s (3.958ms) IOPS: 33.0K 4.4 GiB/s (30.501ms) IOPS: 4.5K 4.1 GiB/s (30.782ms) IOPS: 4.2K
Micron 3610 2TB 2.2 GiB/s (0.884ms) IOPS: 144.3K 307.7 MiB/s (6.5ms) IOPS: 19.7K 2.9 GiB/s (5.4ms) IOPS: 23.7K 2.1 GiB/s (7.6ms) IOPS: 16.8K 3.8 GiB/s (33.1ms) IOPS: 3.9K 4.9 GiB/s (25.5ms) IOPS: 5.0K
TEAMGROUP GE PRO 2TB 0.8 GiB/s (2.464ms) IOPS: 51.8K 1.0 GiB/s (1.913ms) IOPS: 68.8K 2.8 GiB/s (5.627ms) IOPS: 22.7K 2.1 GiB/s (7.309ms) IOPS: 17.5K 4.2 GiB/s (29.599ms) IOPS: 4.3K 2.7 GiB/s (49.915ms) IOPS: 2.7K
TEAMGROUP GC PRO 2TB 0.8 GiB/s (2.589ms) IOPS: 49.3K 1.0 GiB/s (1.899ms) IOPS: 67.3K 2.7 GiB/s (5.860ms) IOPS: 21.8K 2.4 GiB/s (6.636ms) IOPS: 19.3K 3.7 GiB/s (34.007ms) IOPS: 3.8K 3.7 GiB/s (33.414ms) IOPS: 3.8K

Conclusion

The Micron 3610 marks an important step in bringing QLC NAND into the PCIe Gen5 client space, but its performance profile is clearly specialized. It delivers impressive burst write speeds and shows strong behavior in DirectStorage workloads, making it a reasonable fit for modern gaming systems and thin-and-light notebooks that value power efficiency and cost.

Outside of those scenarios, however, the tradeoffs are evident. Read-heavy workloads, such as AI model loading, expose the lower sequential ceiling, and small-block GPU Direct Storage writes reveal the limitations of a DRAMless Gen5 QLC design. In broader application testing, it trails even older Gen4 QLC drives in responsiveness.

The Micron 3610 is neither a performance leader nor a universal upgrade over established TLC or mature Gen4 QLC options. Instead, it serves a specific purpose: delivering strong burst performance and modern platform compatibility in an efficient form factor. For buyers who understand those boundaries, it can make sense, especially if pricing aligns with those expectations.


The post Micron 3610 Review: A Focused Entry Into Gen5 QLC appeared first on StorageReview.com.
❌