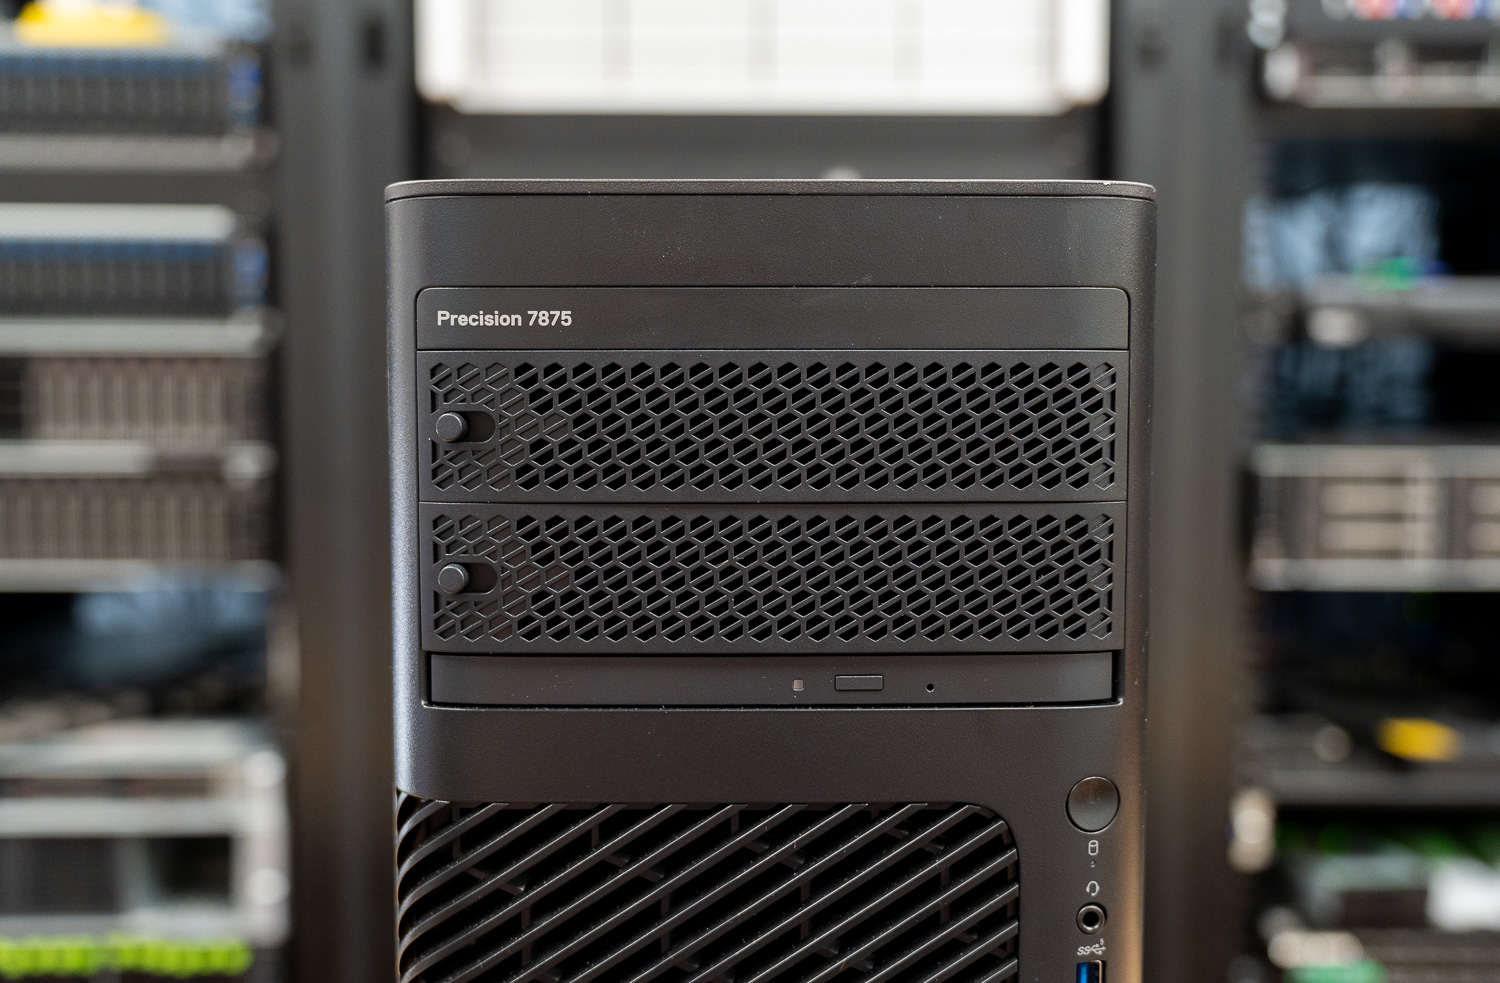
Dell PowerProtect One: Open, Integrated, and Intelligent Cyber Resilience
Backup and recovery infrastructure has always been the part of the data center that gets the most attention when something goes wrong, but that pattern has shifted. Ransomware has made backup the last line of defense rather than an insurance policy, and the operational expectations have shifted accordingly. Recovery times that were acceptable five years ago are now liabilities; backup data itself is a major target; and the teams running cyber resilience are smaller and less specialized than they used to be, even as the platforms they manage have grown more complex.
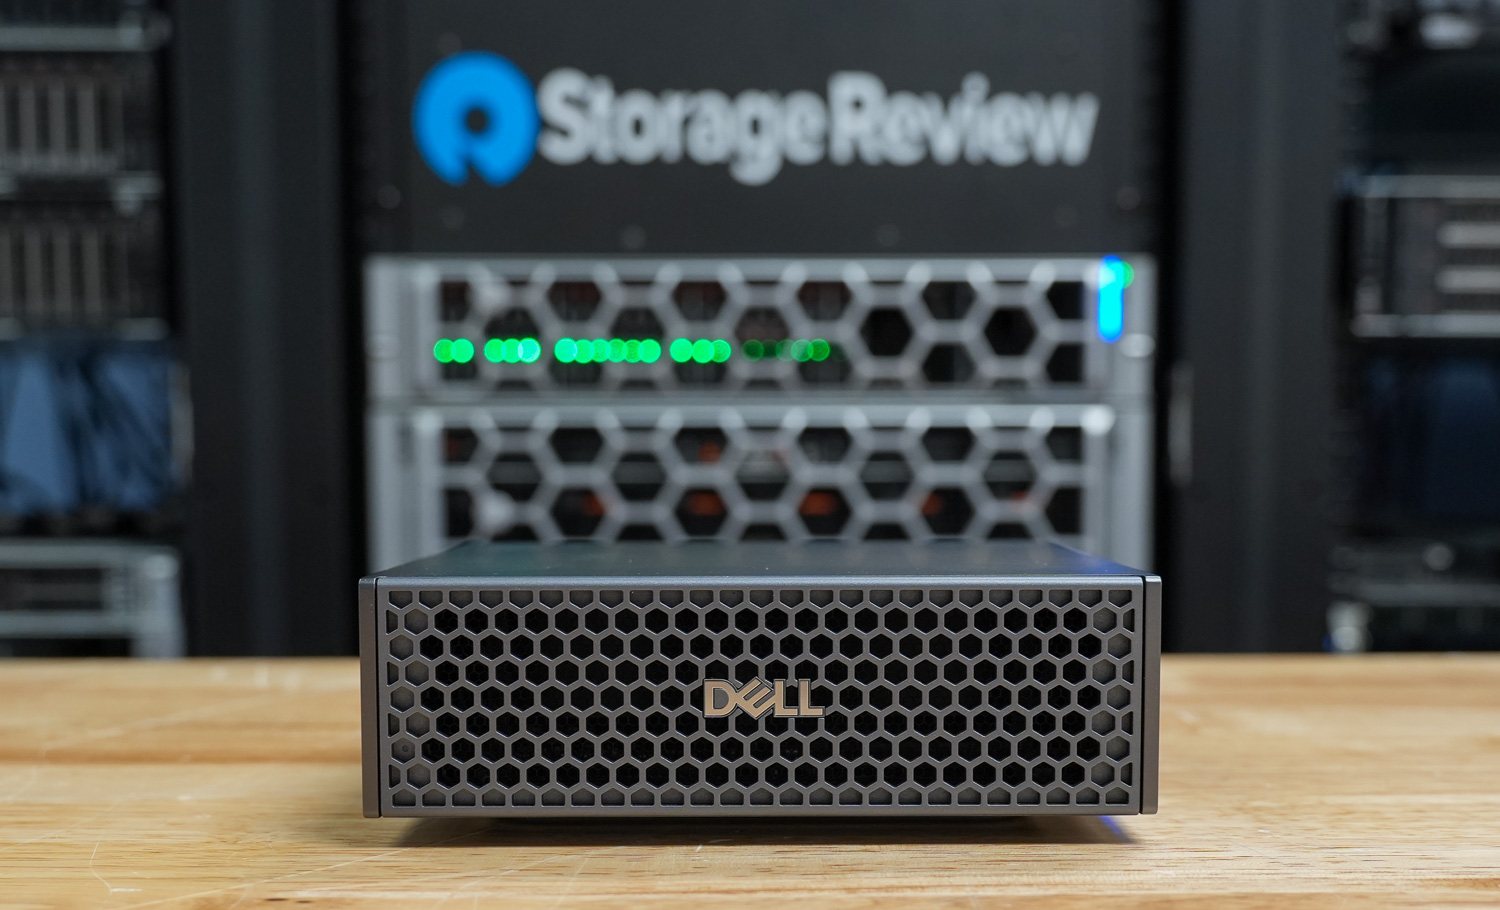
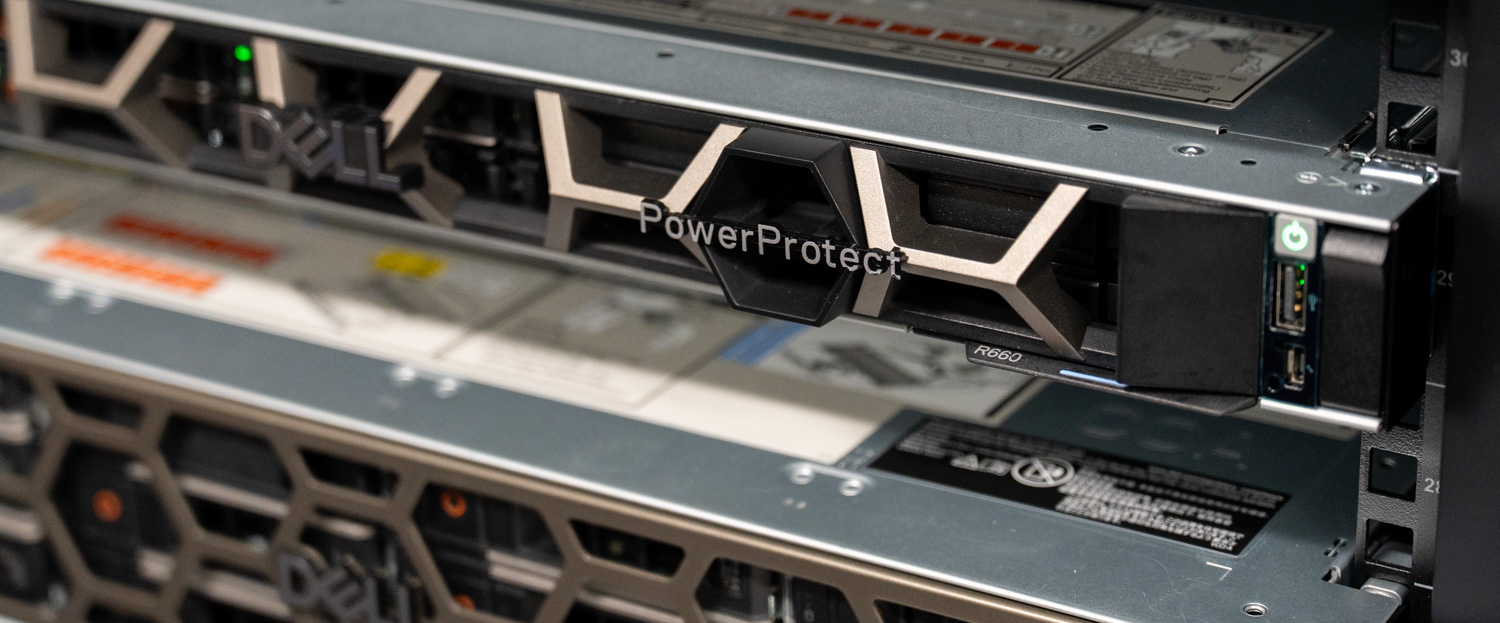
Dell’s response to this shift is PowerProtect One. The platform is built on products customers already know, and the introduction of PowerProtect One signals a sharper positioning: It is Dell’s answer to the historical trade-off between open ecosystems and integrated management. PowerProtect One is a unified cyber resilience platform that brings together management, orchestration, and secure protection storage into a single, intelligent experience.
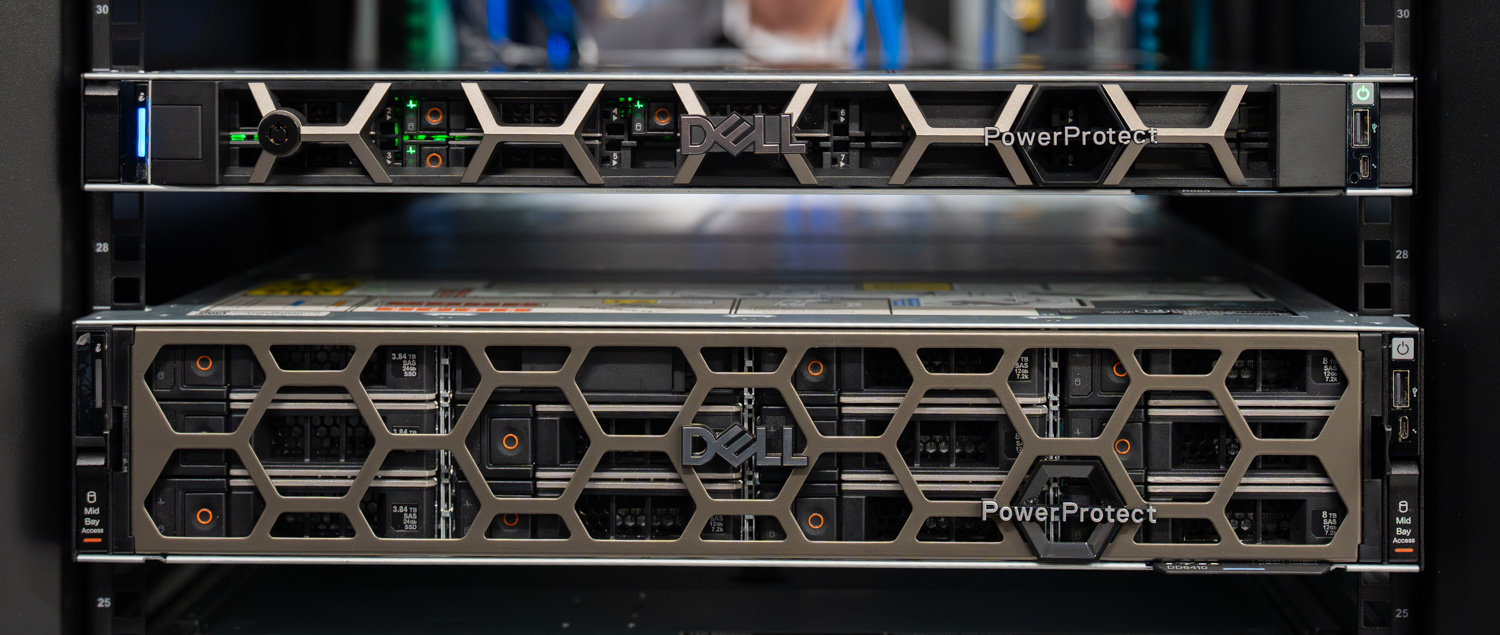
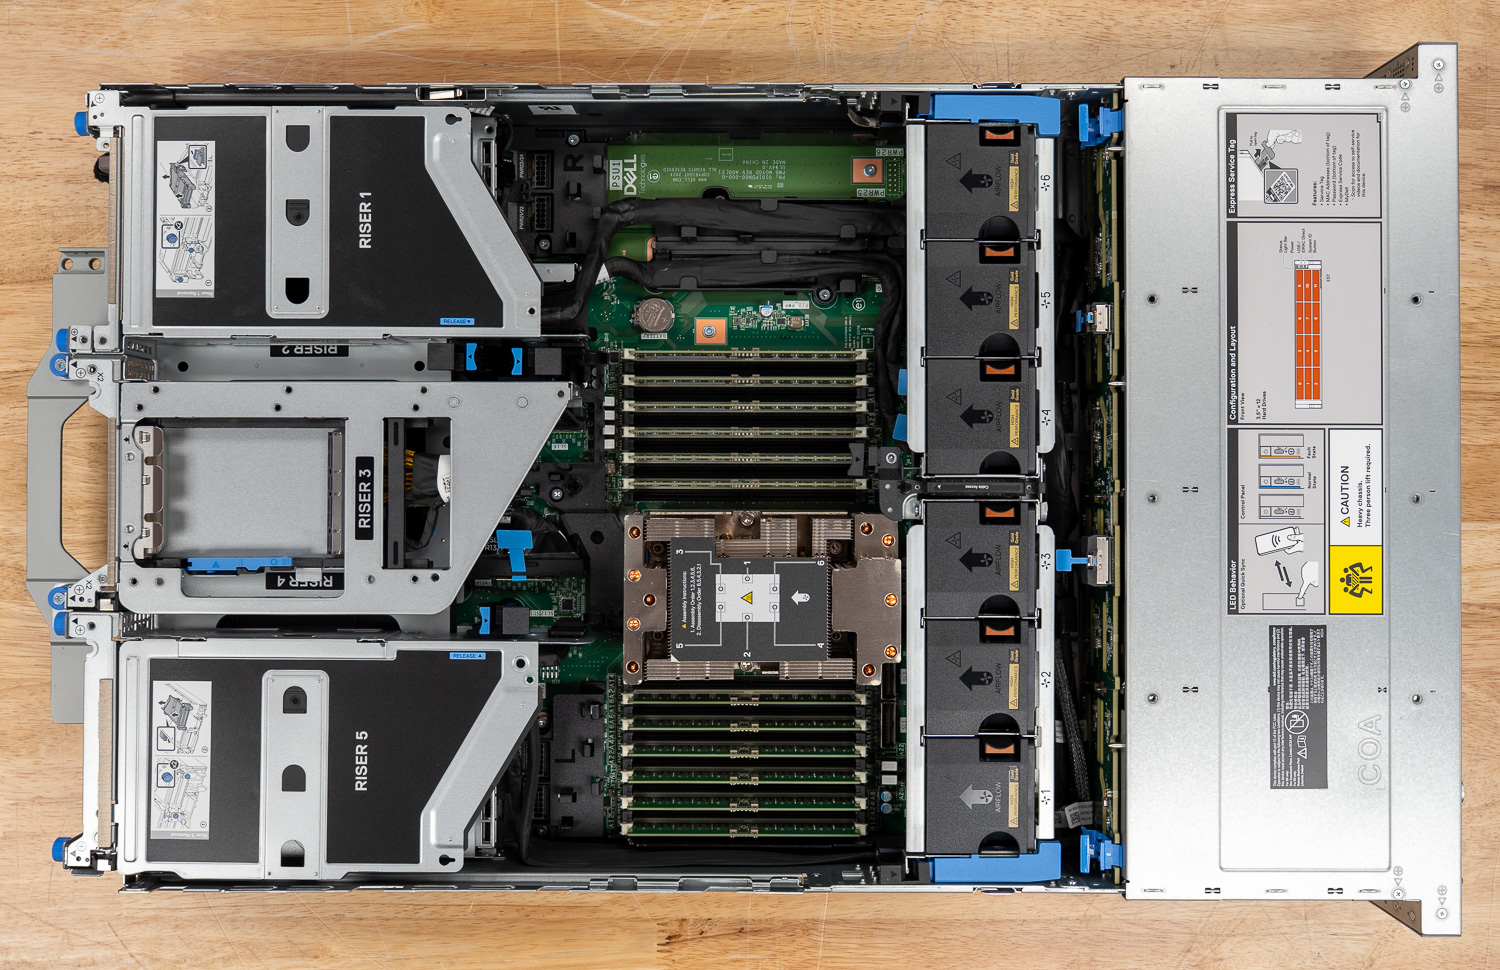
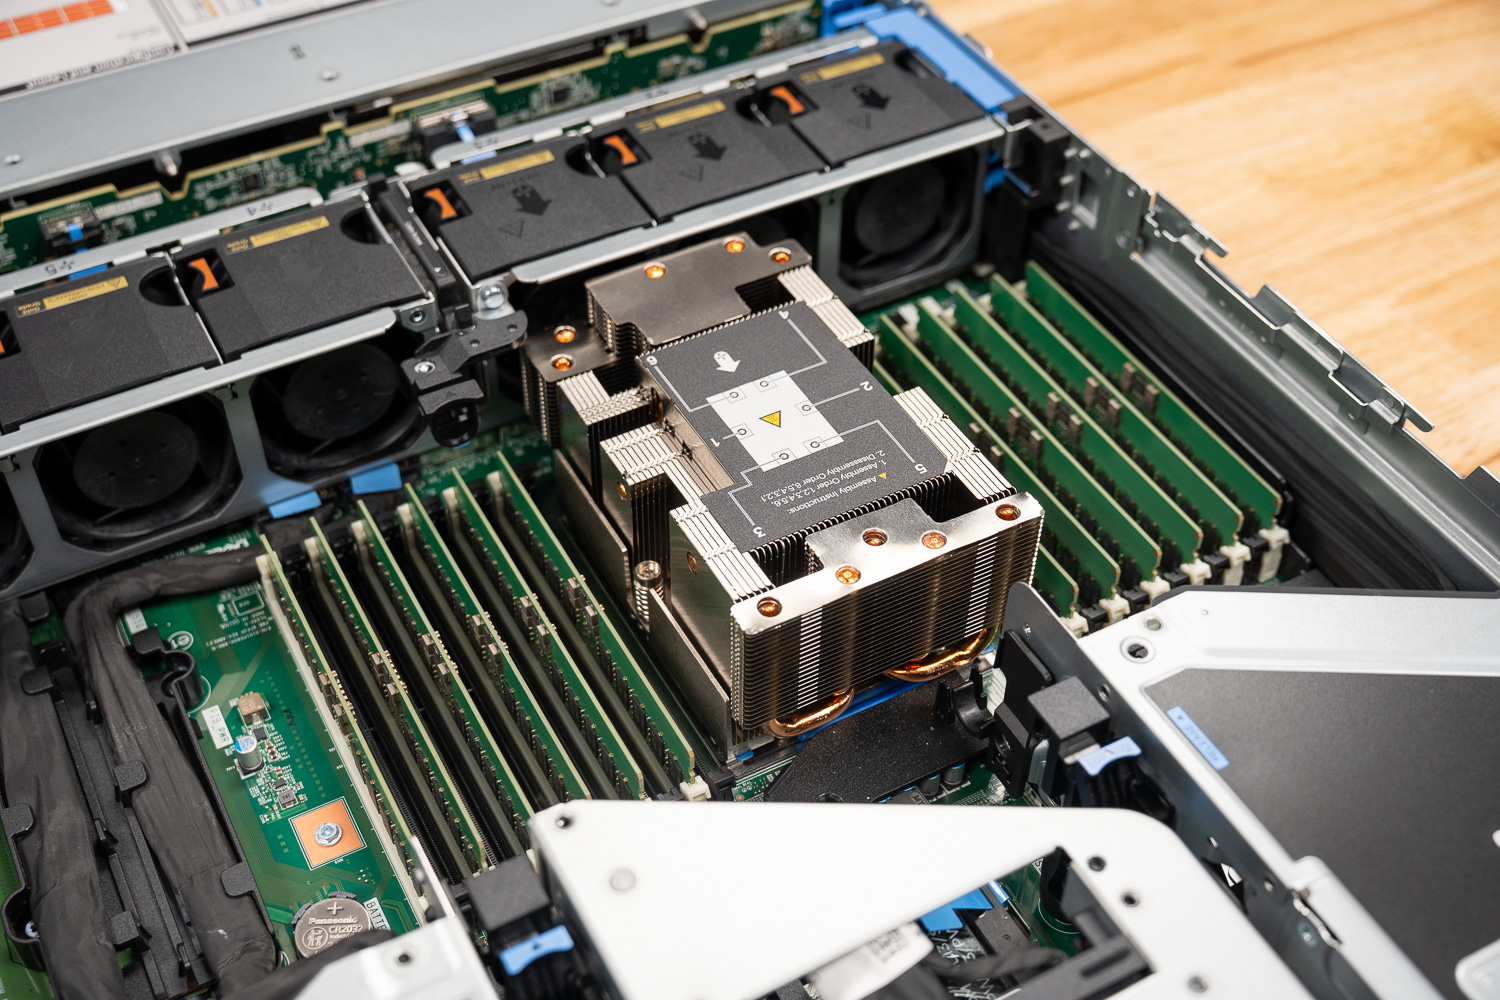
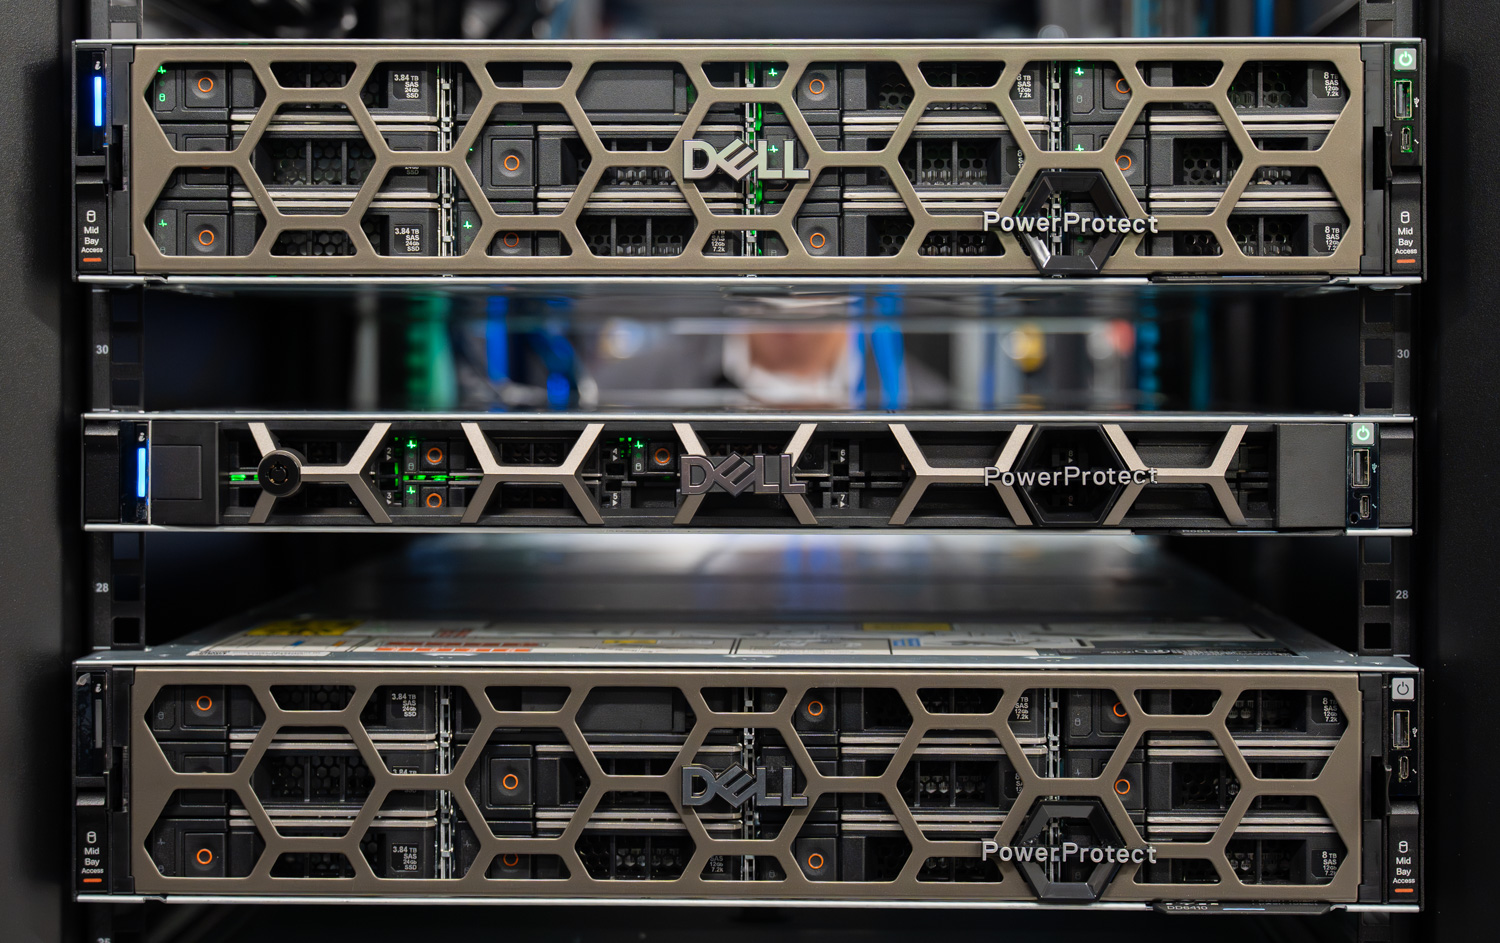
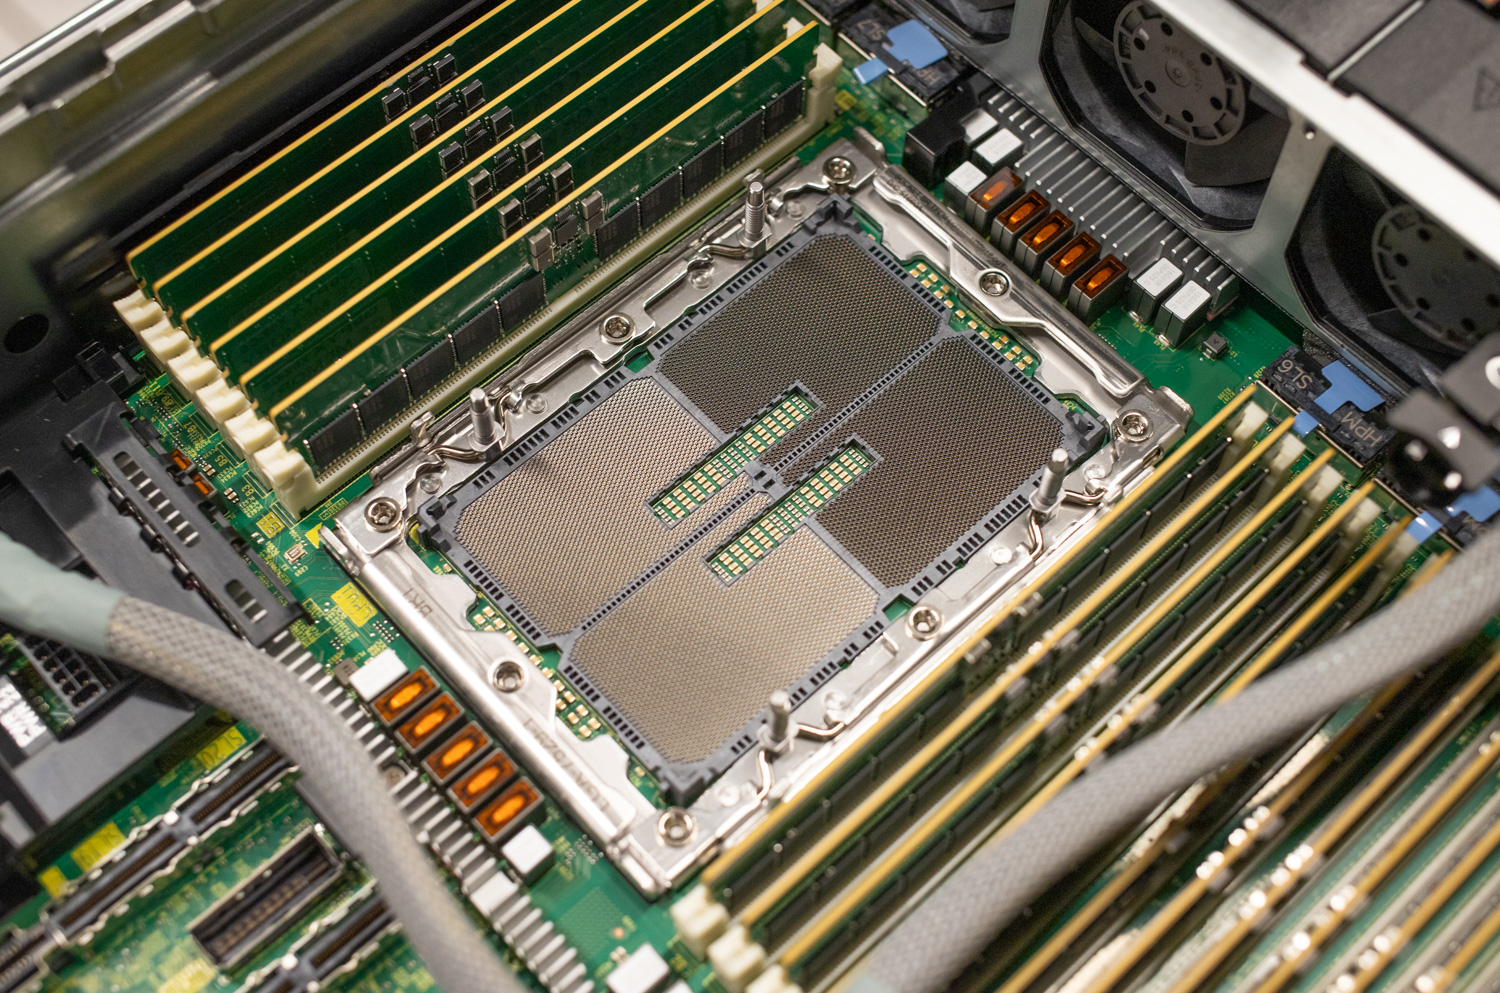
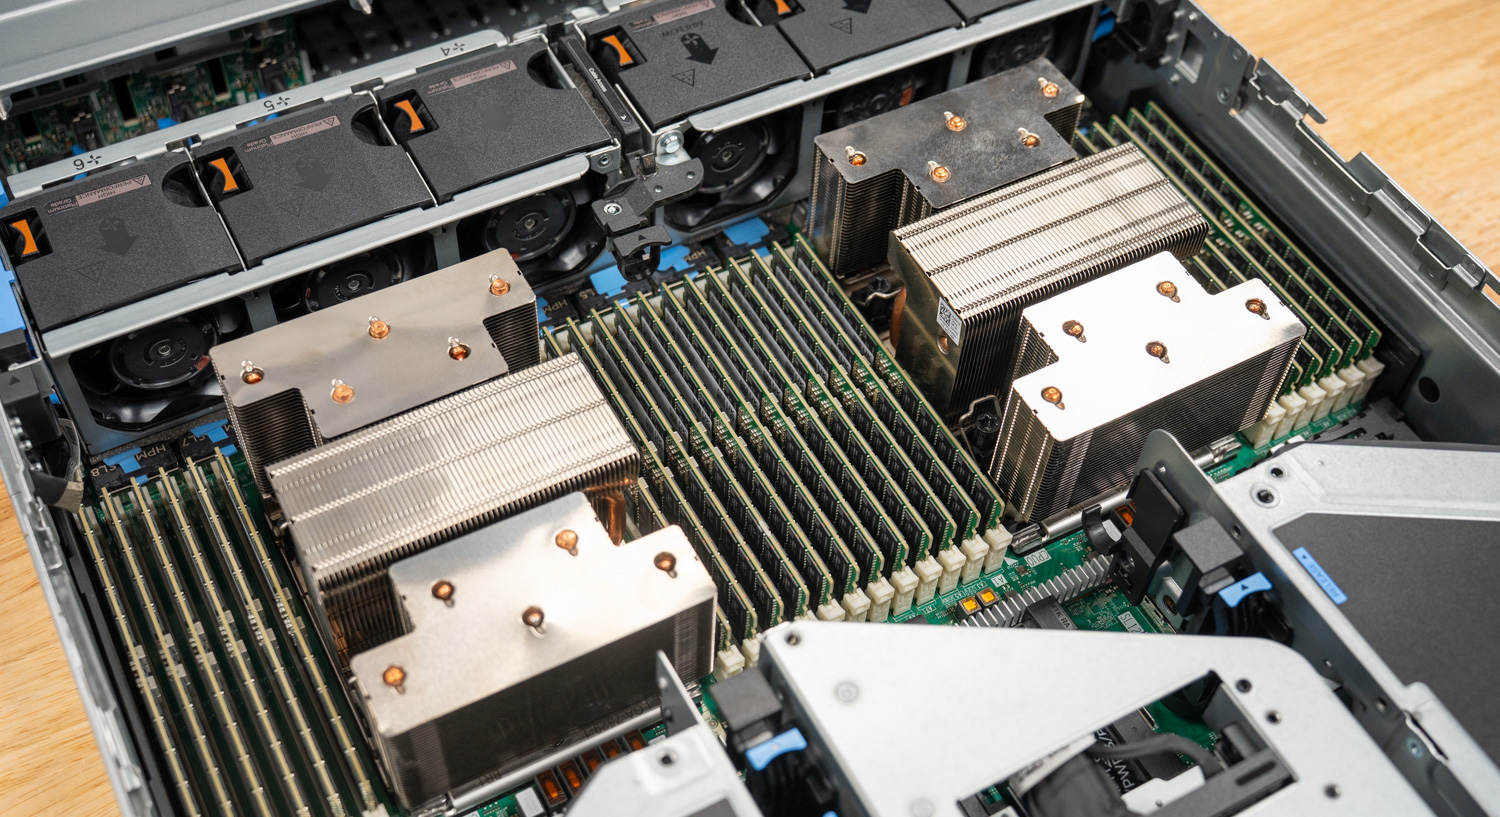
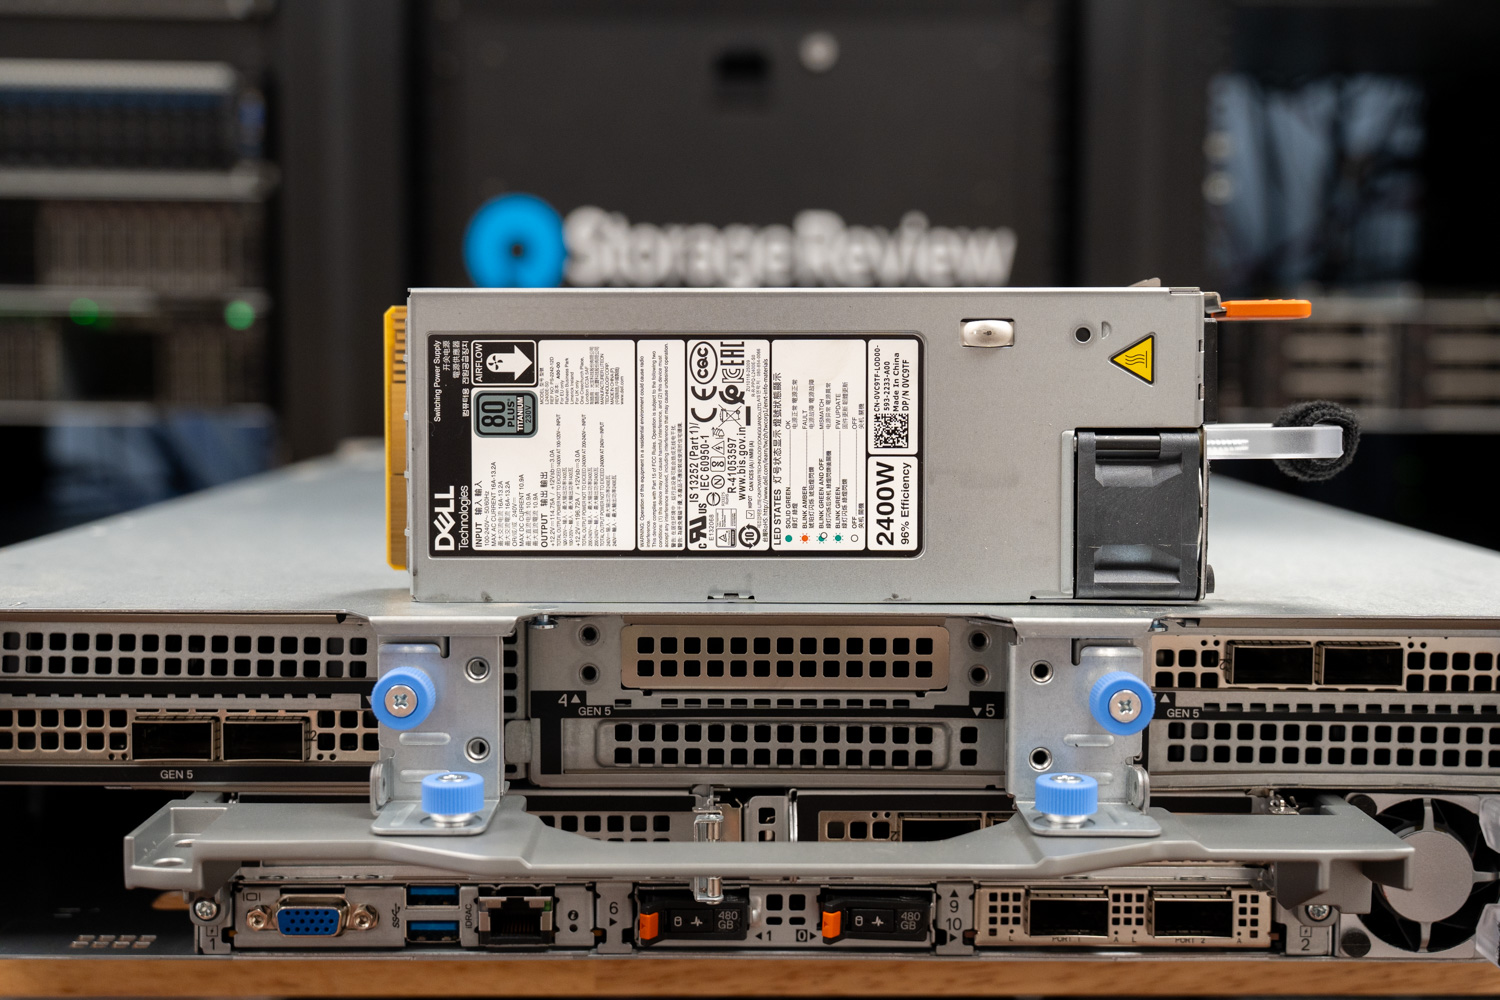
Designed to protect business-critical data across any environment, PowerProtect One simplifies how organizations build and operate cyber resilience—without forcing them to abandon the heterogeneous ecosystems they already rely on. Built on the combined strengths of PowerProtect Data Manager and PowerProtect Data Domain, PowerProtect One delivers a single control plane that defines policies, governs assets, and handles operational workflows across the protected environment. We have written about Data Domain extensively over the past several years, and the broader Data Domain platform remains the most widely deployed purpose-built backup foundation in the market, with more than 15,000 active customers globally.
The platform also leans heavily on its AI Assistant, a capability that takes on more weight in the current operational climate than it might have a few years ago. Backup and recovery teams are smaller and increasingly staffed by generalists; the volume of repetitive monitoring and triage work has grown, and the windows for responding to ransomware activity or initiating recovery have tightened. The AI Assistant pulls real-time telemetry from across the platform, answers natural language queries about protection status, failed jobs, capacity, and system health, and surfaces clickable navigation links that take administrators directly from question to action. It connects to a customer-hosted LLM through a configurable API endpoint and runs against curated Dell product knowledge. This ensures the answers are grounded in both the live system state and Dell’s documentation, rather than in generic AI output.
In this analysis, we examine PowerProtect One as it lands at Dell Technologies World 2026, including the operational experience, the open ecosystem architecture that lets third-party backup tools work with the platform, the cyber resilience capabilities built around immutability and anomaly detection, and how the AI Assistant changes the path from question to answer. We also touch on what the platform will look like beyond launch, with Dell signaling support for other models within the Data Domain family.
Open Ecosystem and Storage Architecture
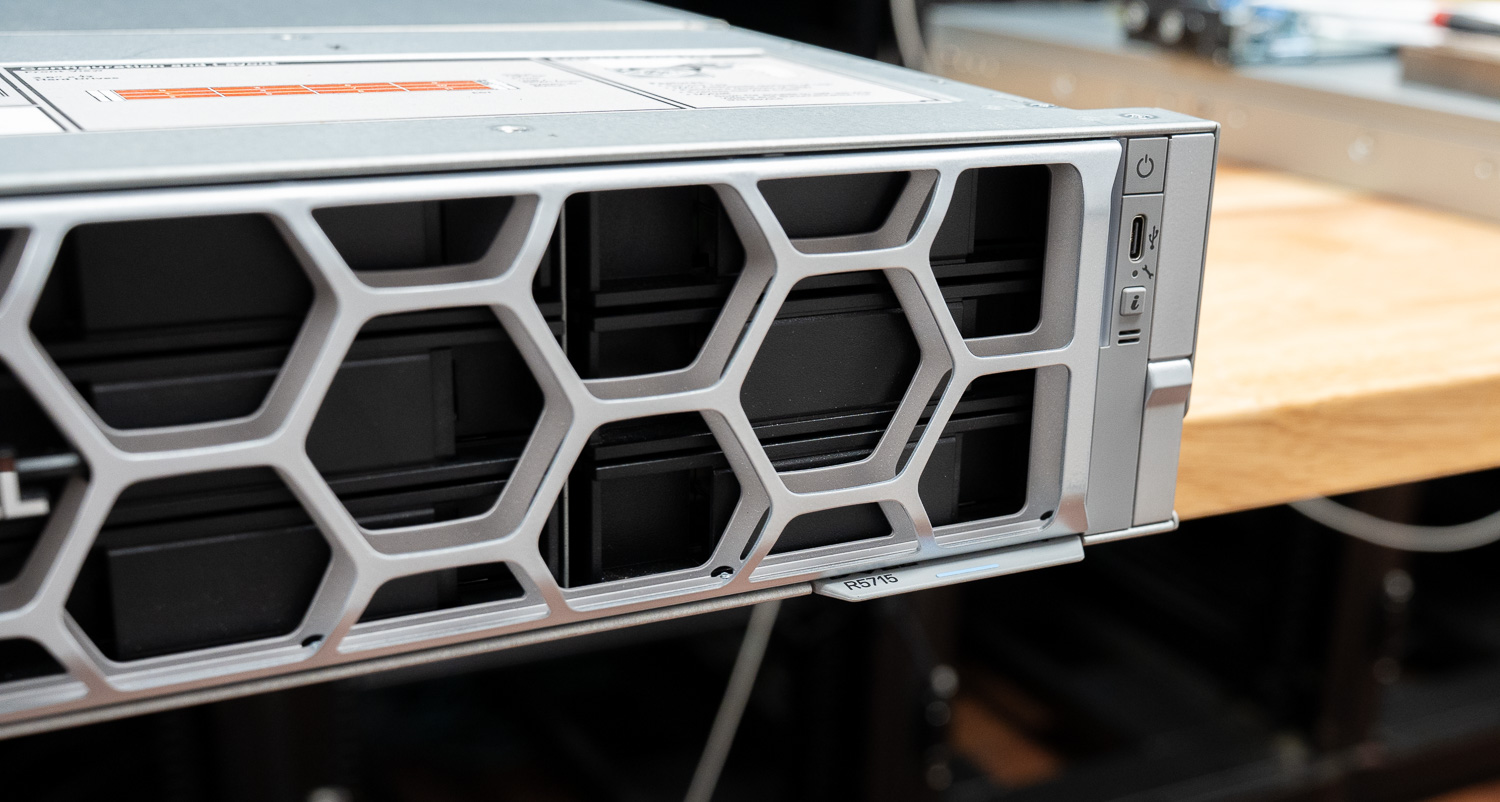
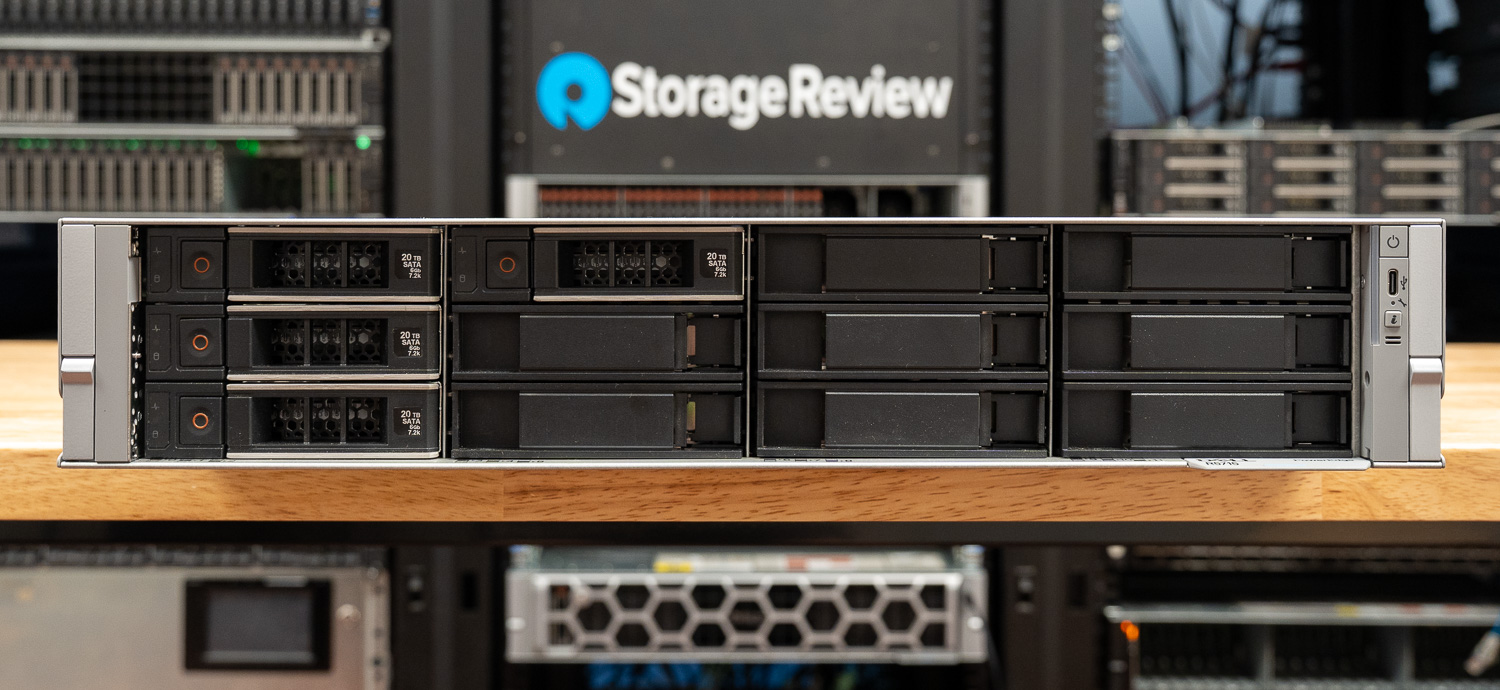
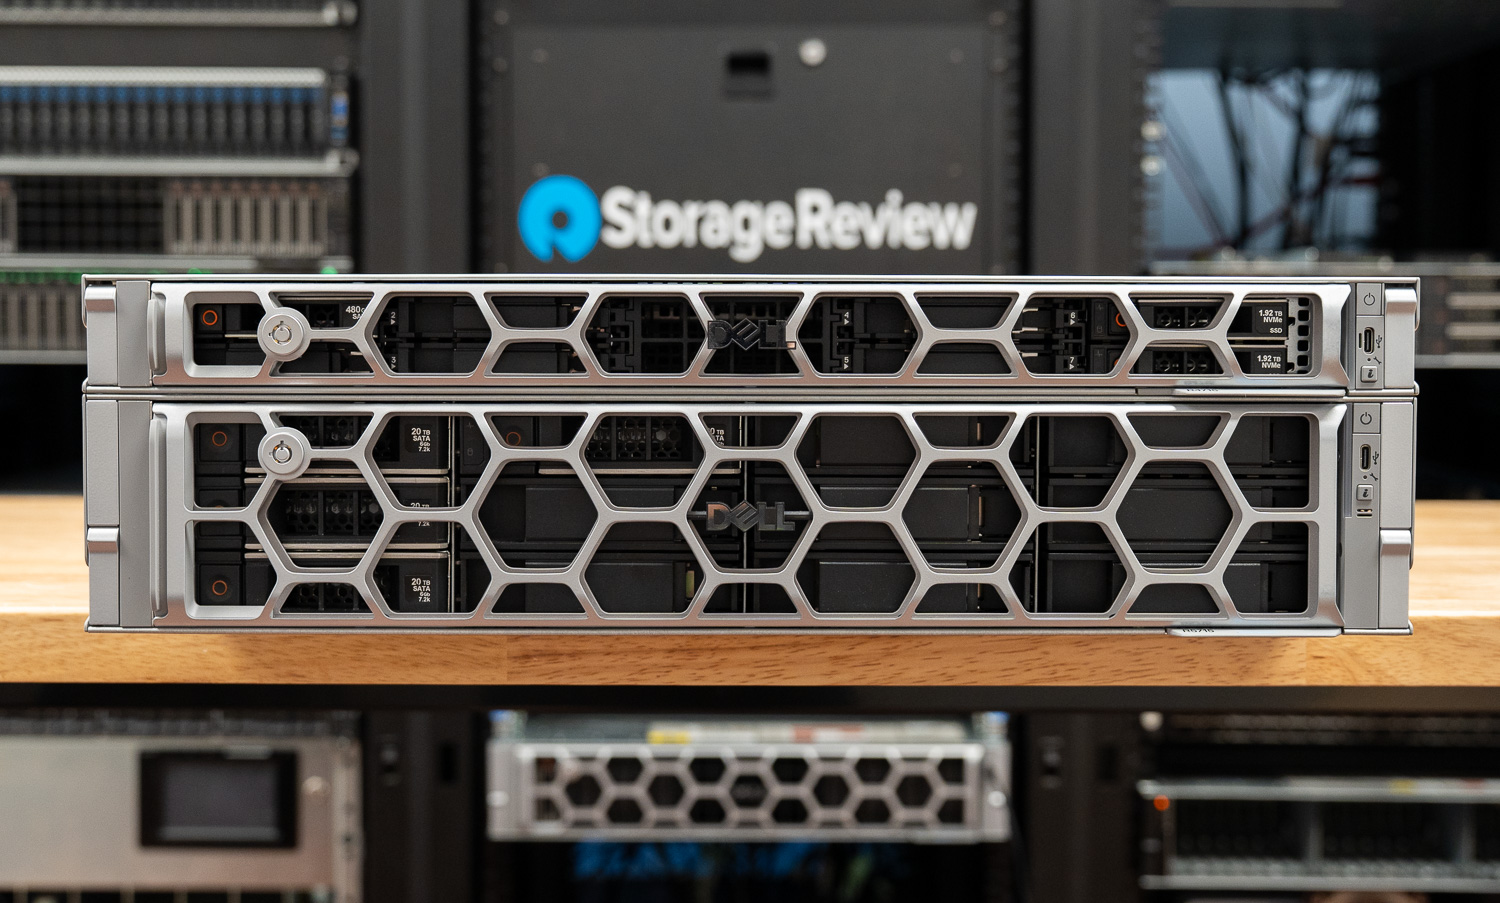
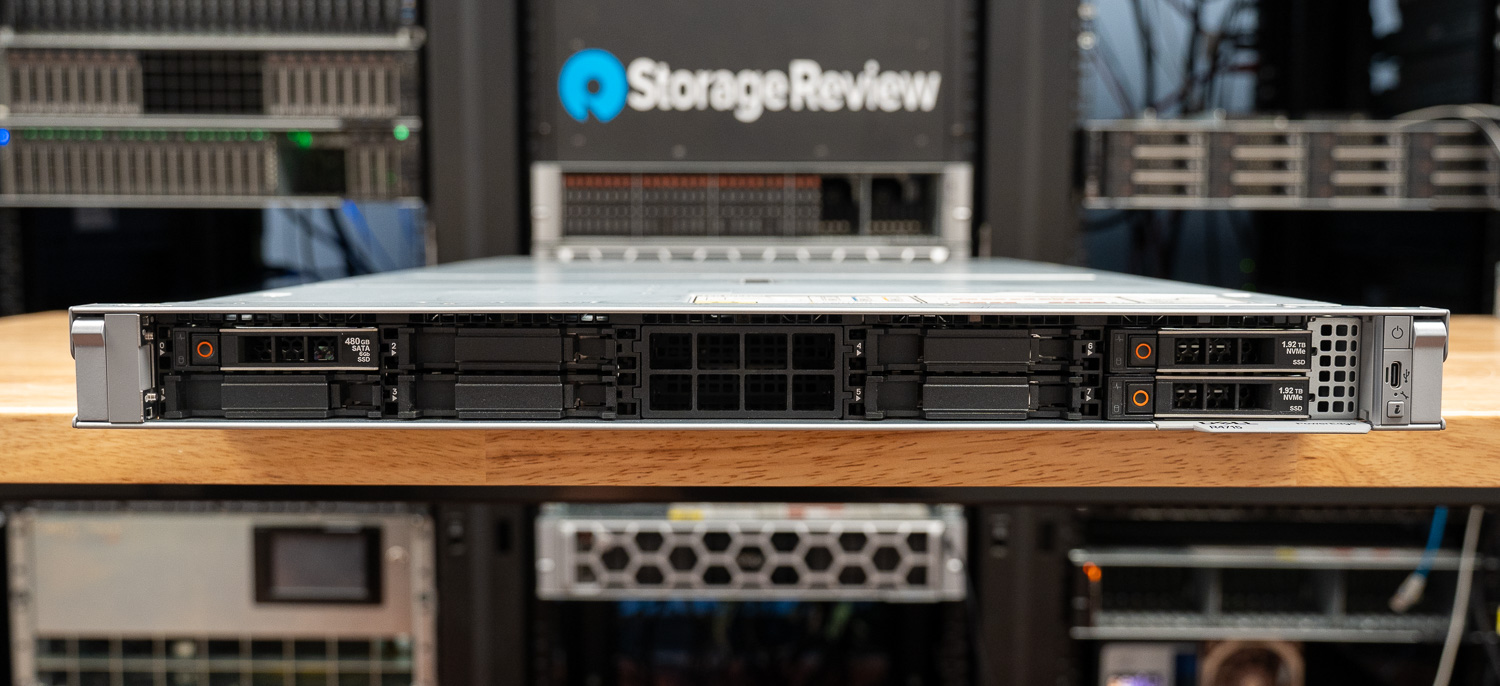
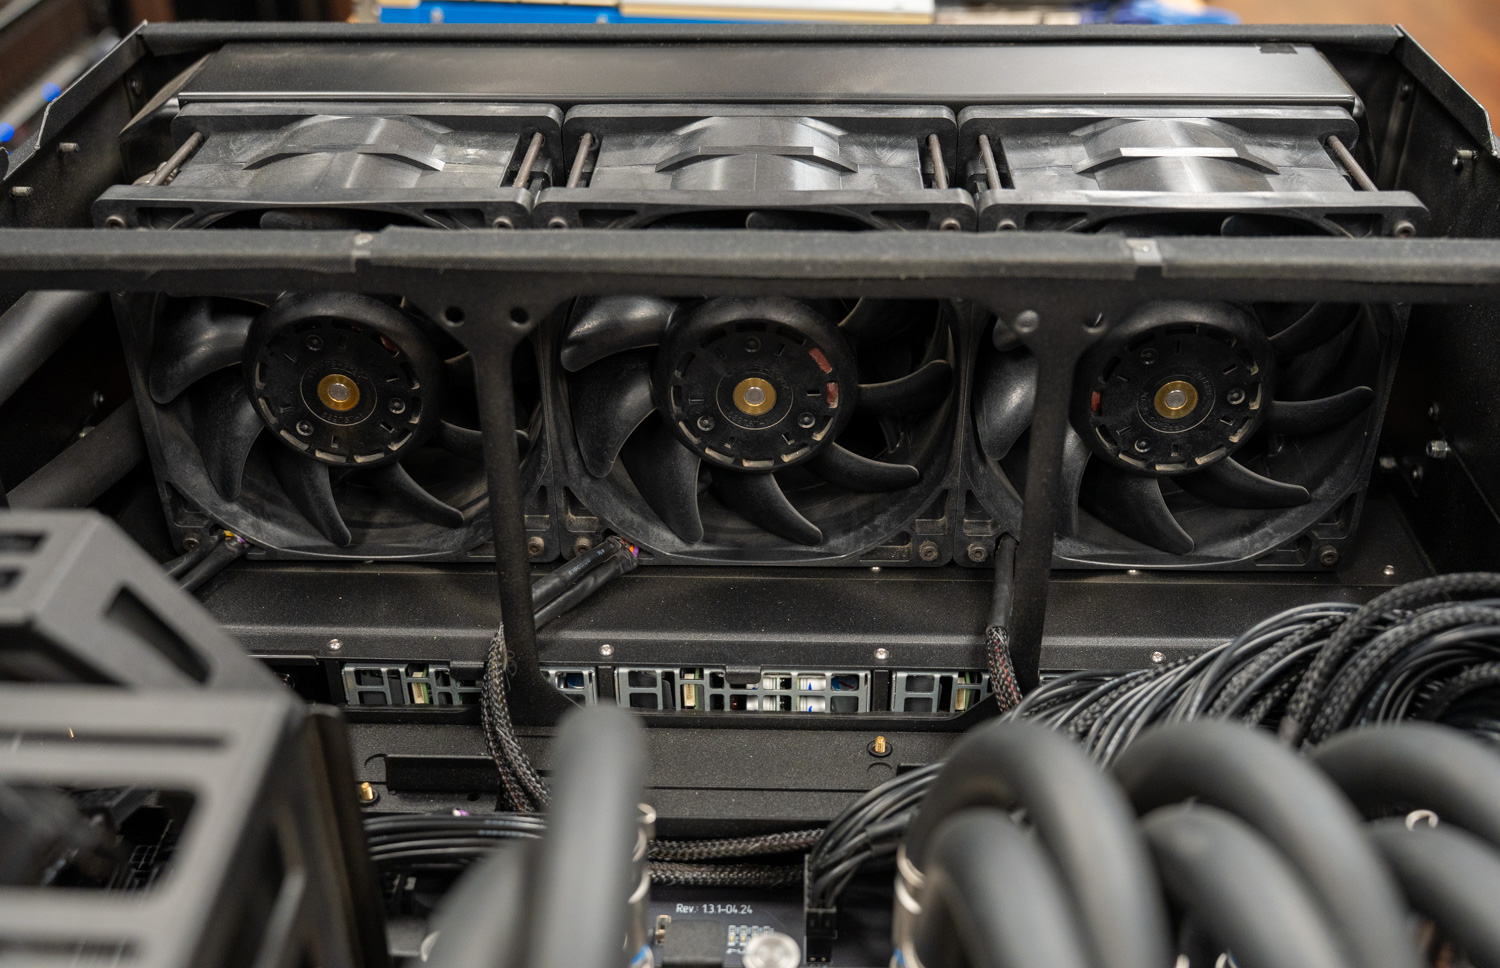
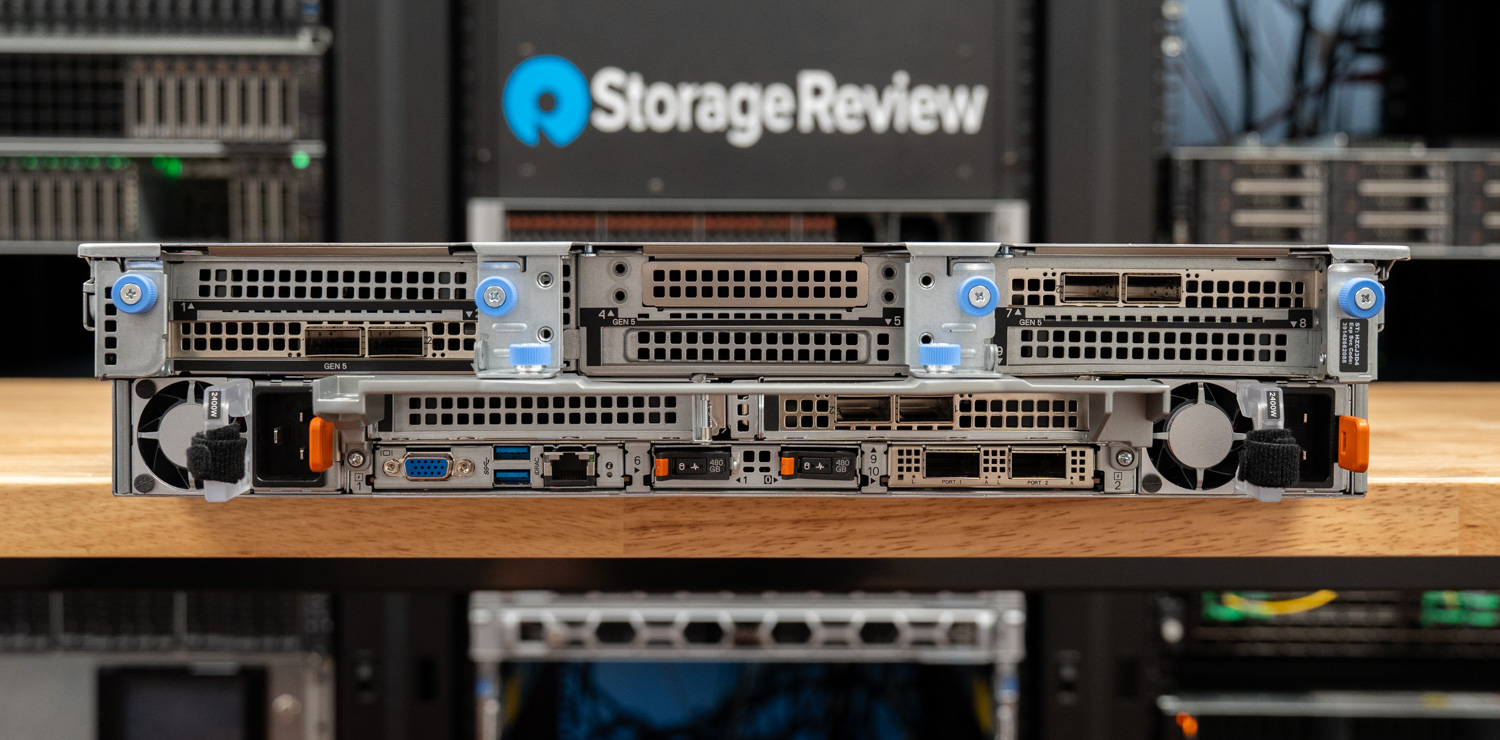
One of the clearest signals of how PowerProtect One operates as a unified cyber resilience platform is its approach to storage. Backup data lives in storage units that administrators create and manage directly from the unified interface, which is familiar to anyone who has worked with Data Domain. What is different is how the platform handles those storage units once they exist.
A storage unit on PowerProtect One can serve two distinct purposes. The first is internal use by the solution’s own protection policies, with backup jobs scheduled and orchestrated, and data landing in a storage unit dedicated to that policy. The second is more interesting. The same storage unit construct can be exposed externally through DD Boost, allowing third-party backup applications to write directly to PowerProtect One as a target. Commvault, HYCU, Veeam, and other DD Boost ecosystem partners can use the platform as backup storage without changing their own software stack, and the data is stored in the same protection storage with the same data reduction, compression, and retention lock options as Dell-orchestrated backups.
This is the practical mechanism behind Dell’s “open by design, integrated by experience” framing. Customers running mixed environments do not have to choose between keeping the backup tools their teams already know and consolidating onto a unified protection storage layer. They can do both at the same time. The platform also offers an unusually broad workload catalog through PowerProtect One itself, with native protection for VMware, Hyper-V, Nutanix AHV, Kubernetes, Oracle, SQL, Exchange, SAP HANA, file systems, NAS, and Storage Direct Protection for Dell PowerStore and Dell PowerMax. That depth of coverage matters because it lets the platform serve as a protective layer for nearly anything in the environment, without forcing a tooling decision on the workloads themselves.
Storage unit creation is straightforward in practice. Administrators define soft and hard quotas, set stream limits, enable retention lock when immutability is required, and apply workload-specific tuning where relevant. Both active and cloud tiers are supported, so data can remain local or extend to cloud object storage based on retention and access requirements. Storage units are not exclusively a Dell construct in this platform. The storage units are leveraged by PowerProtect One and third-party utilities separately, but as part of the shared storage layer.
Cyber Resilience by Design
Beyond Anomaly Detection and the operational workflows that surface it, PowerProtect One layers in the security and compliance capabilities that enterprise environments require. The platform supports FIPS 140/2 compliance for cryptographic operations, with all in-flight data encrypted and the option to enable encryption at rest for stored backup copies. Common Criteria readiness is part of the same compliance posture, and Dell runs the platform through ongoing security scans for malware, rootkit activity, OS vulnerabilities, container integrity, and web API flaws.
Access control extends across multiple authentication paths. Single sign-on integrations include Okta, Microsoft Entra ID, PingOne, and RSA SecurID. At the same time, multifactor authentication is supported via TOTP providers such as Google Authenticator, Microsoft Authenticator, Authy, Duo, and LastPass. Role-based access control limits administrative actions to the appropriate users, and audit logging captures activity across the platform for compliance reviews and forensic analysis.
Retention lock is the immutability mechanism most directly tied to ransomware defense. Once applied, backup data cannot be deleted or modified before the retention period expires, even by administrators with elevated privileges. The platform supports both governance and compliance modes, allowing organizations to align with regulatory requirements that demand stricter immutability controls. Combined with Anomaly Detection workflows that flag suspicious changes in backup data, retention lock provides PowerProtect One with the foundation to recover cleanly from ransomware events without relying on the compromised production environment.
PowerProtect One Management
Day 1: Deployment
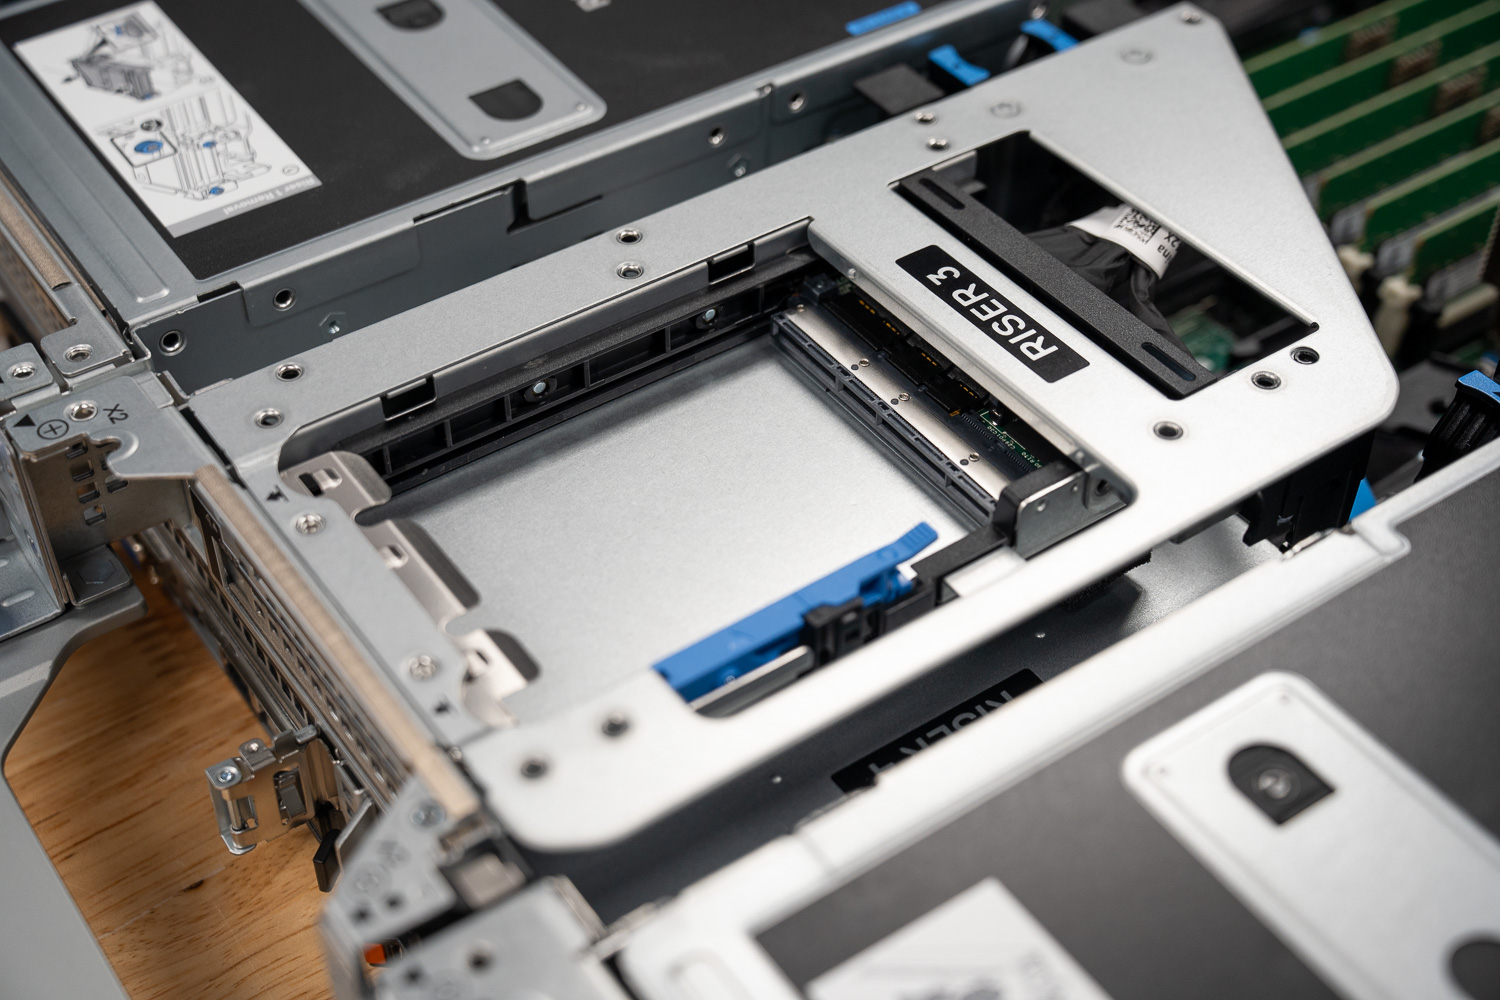
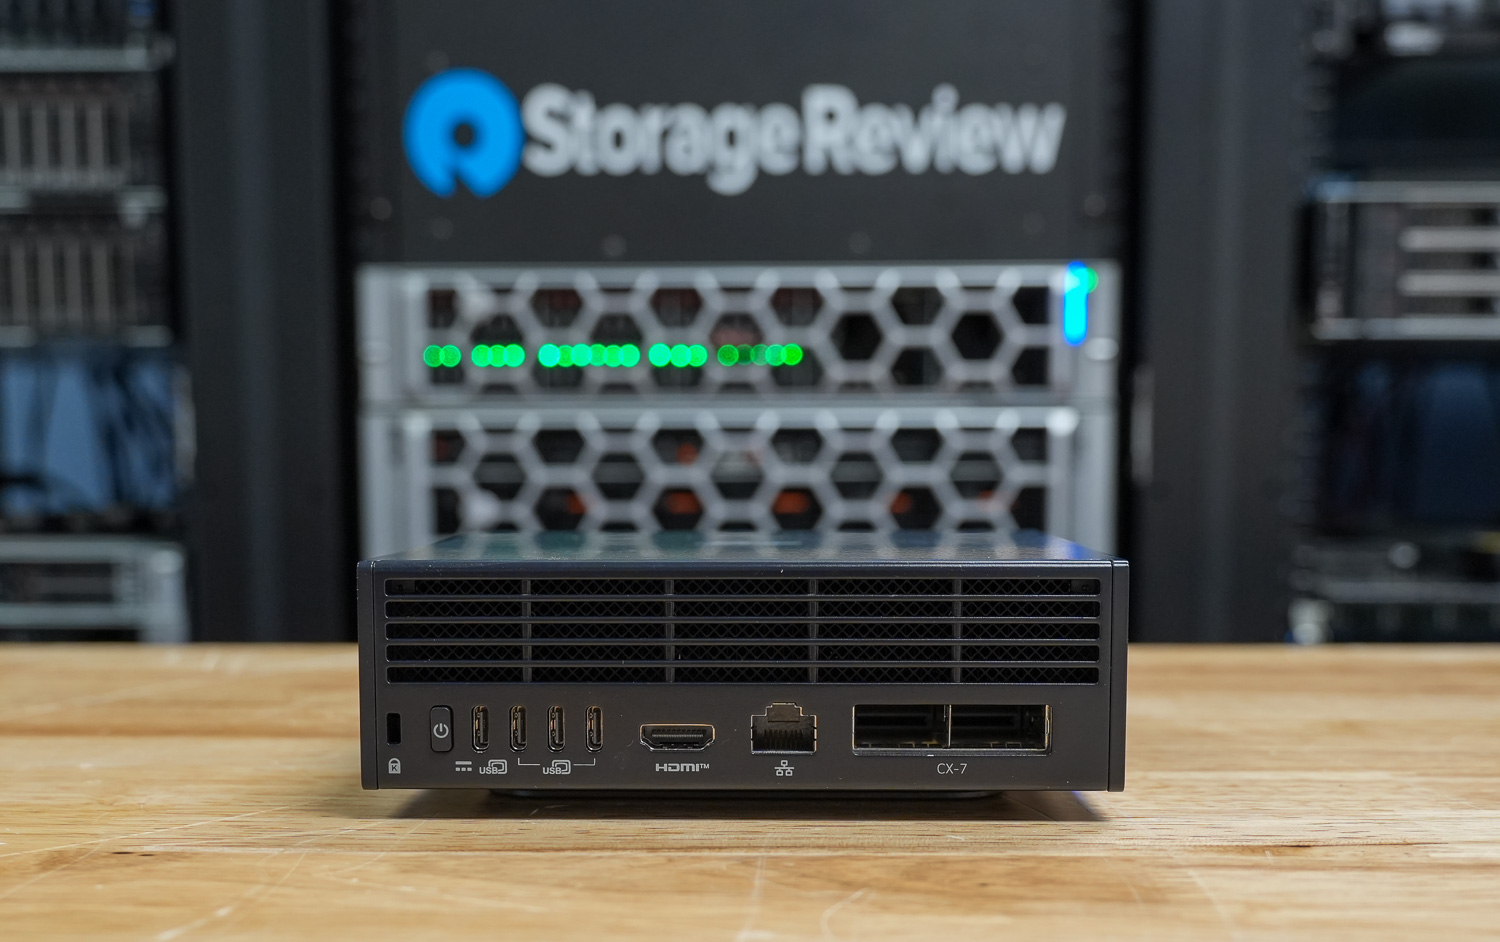
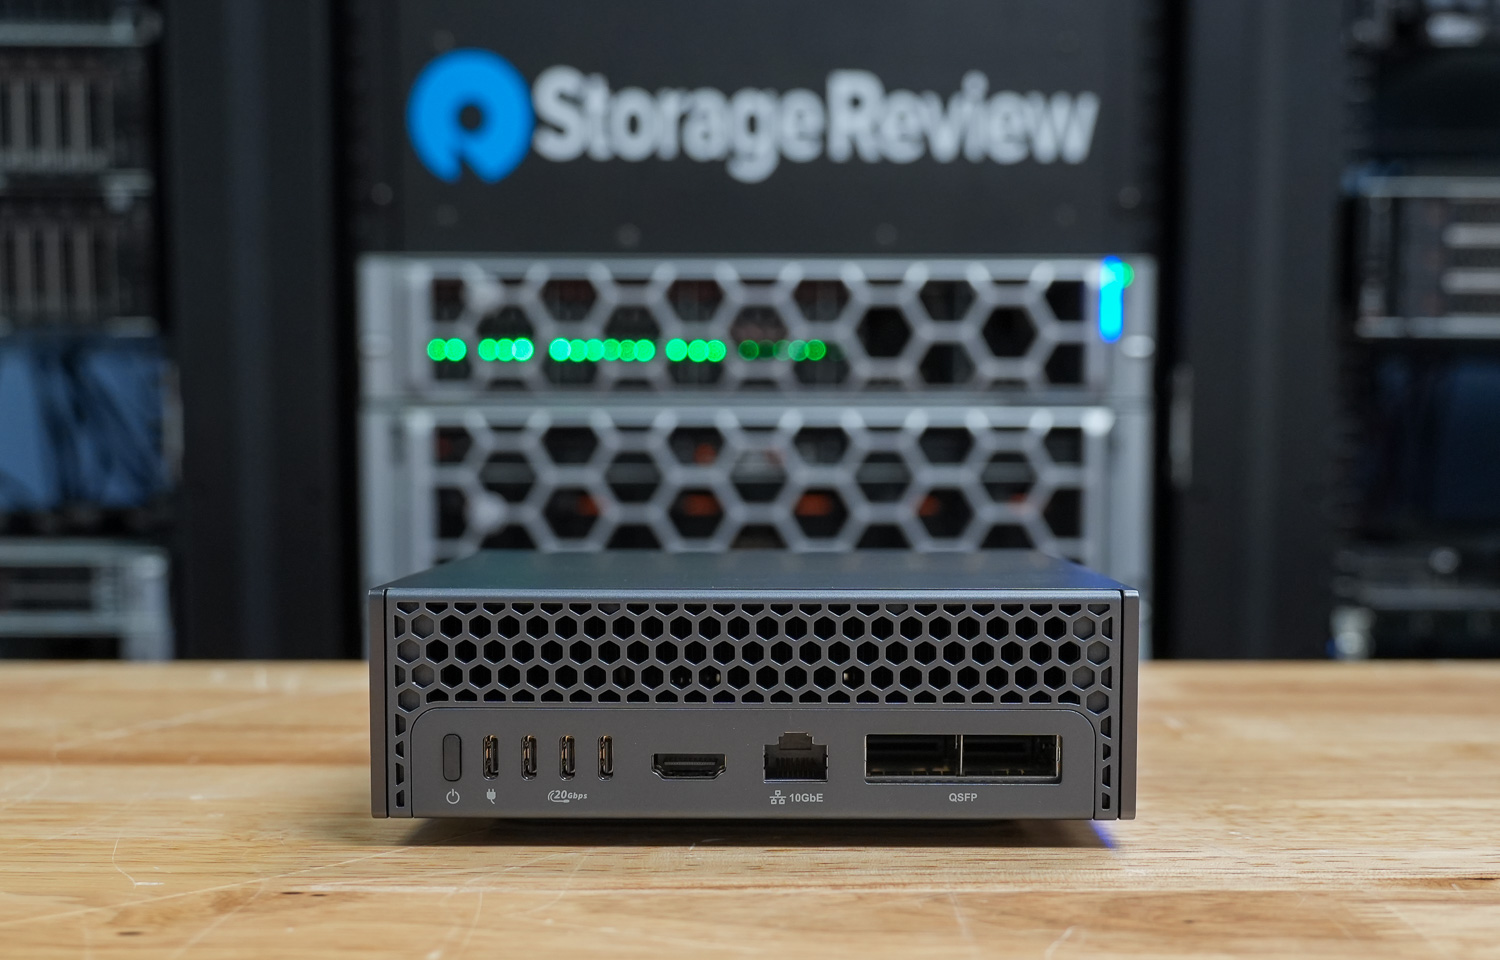
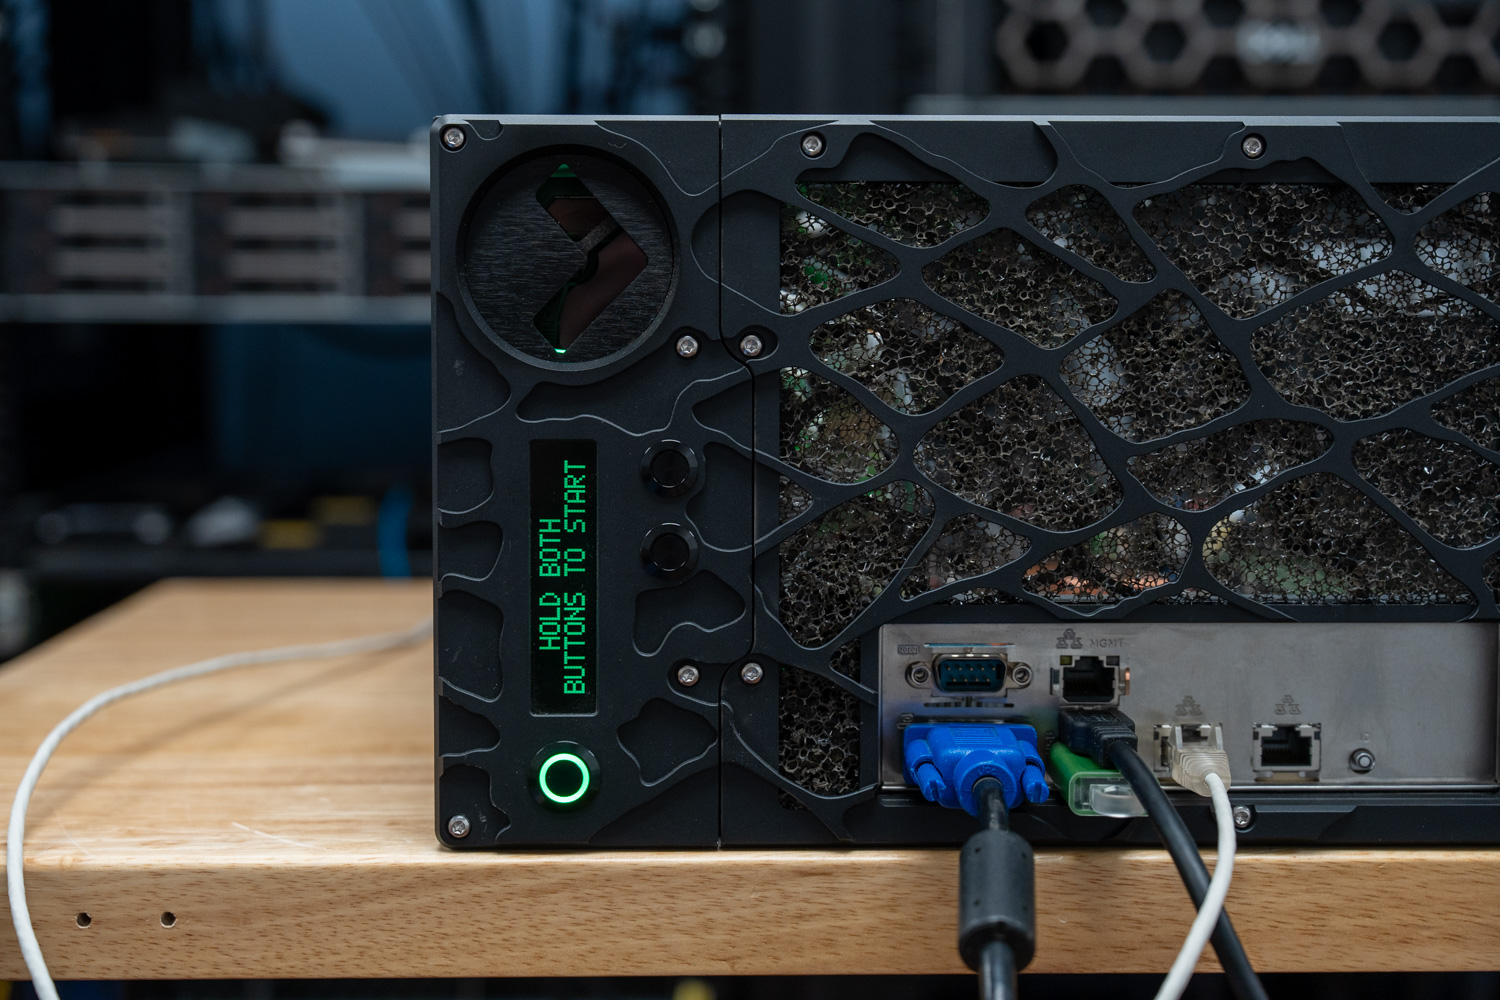
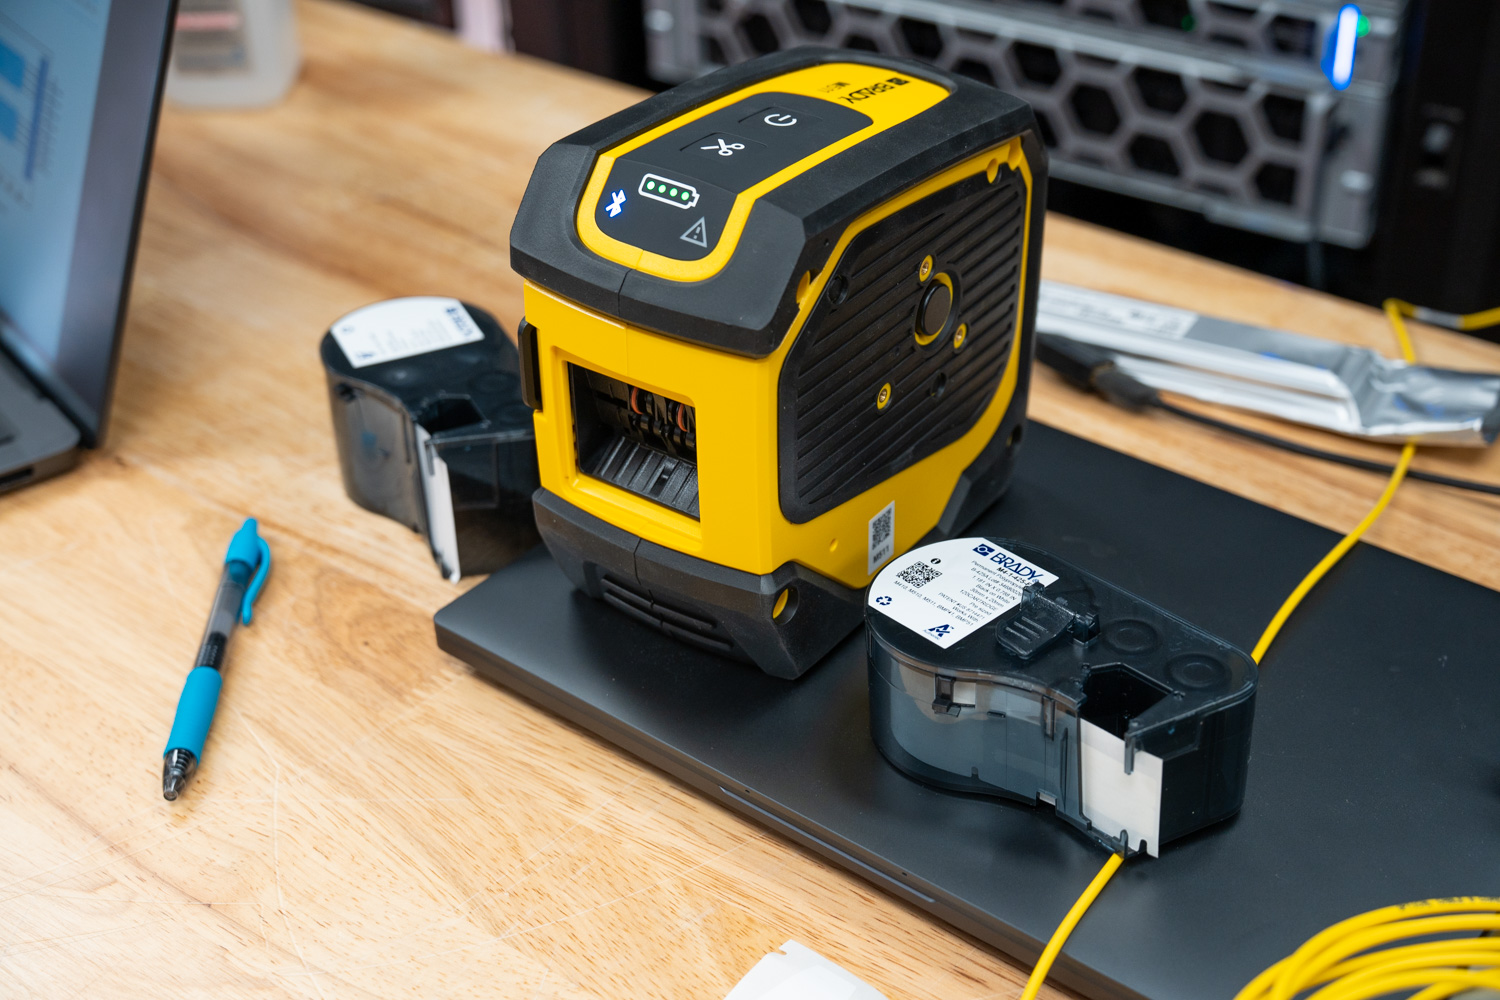
Initial deployment of the PowerProtect One appliance is quick and guided. In our run, the system can be up and usable in under 10 minutes once the configuration is applied. The initial setup focuses on getting core services online rather than walking users through a long provisioning process.
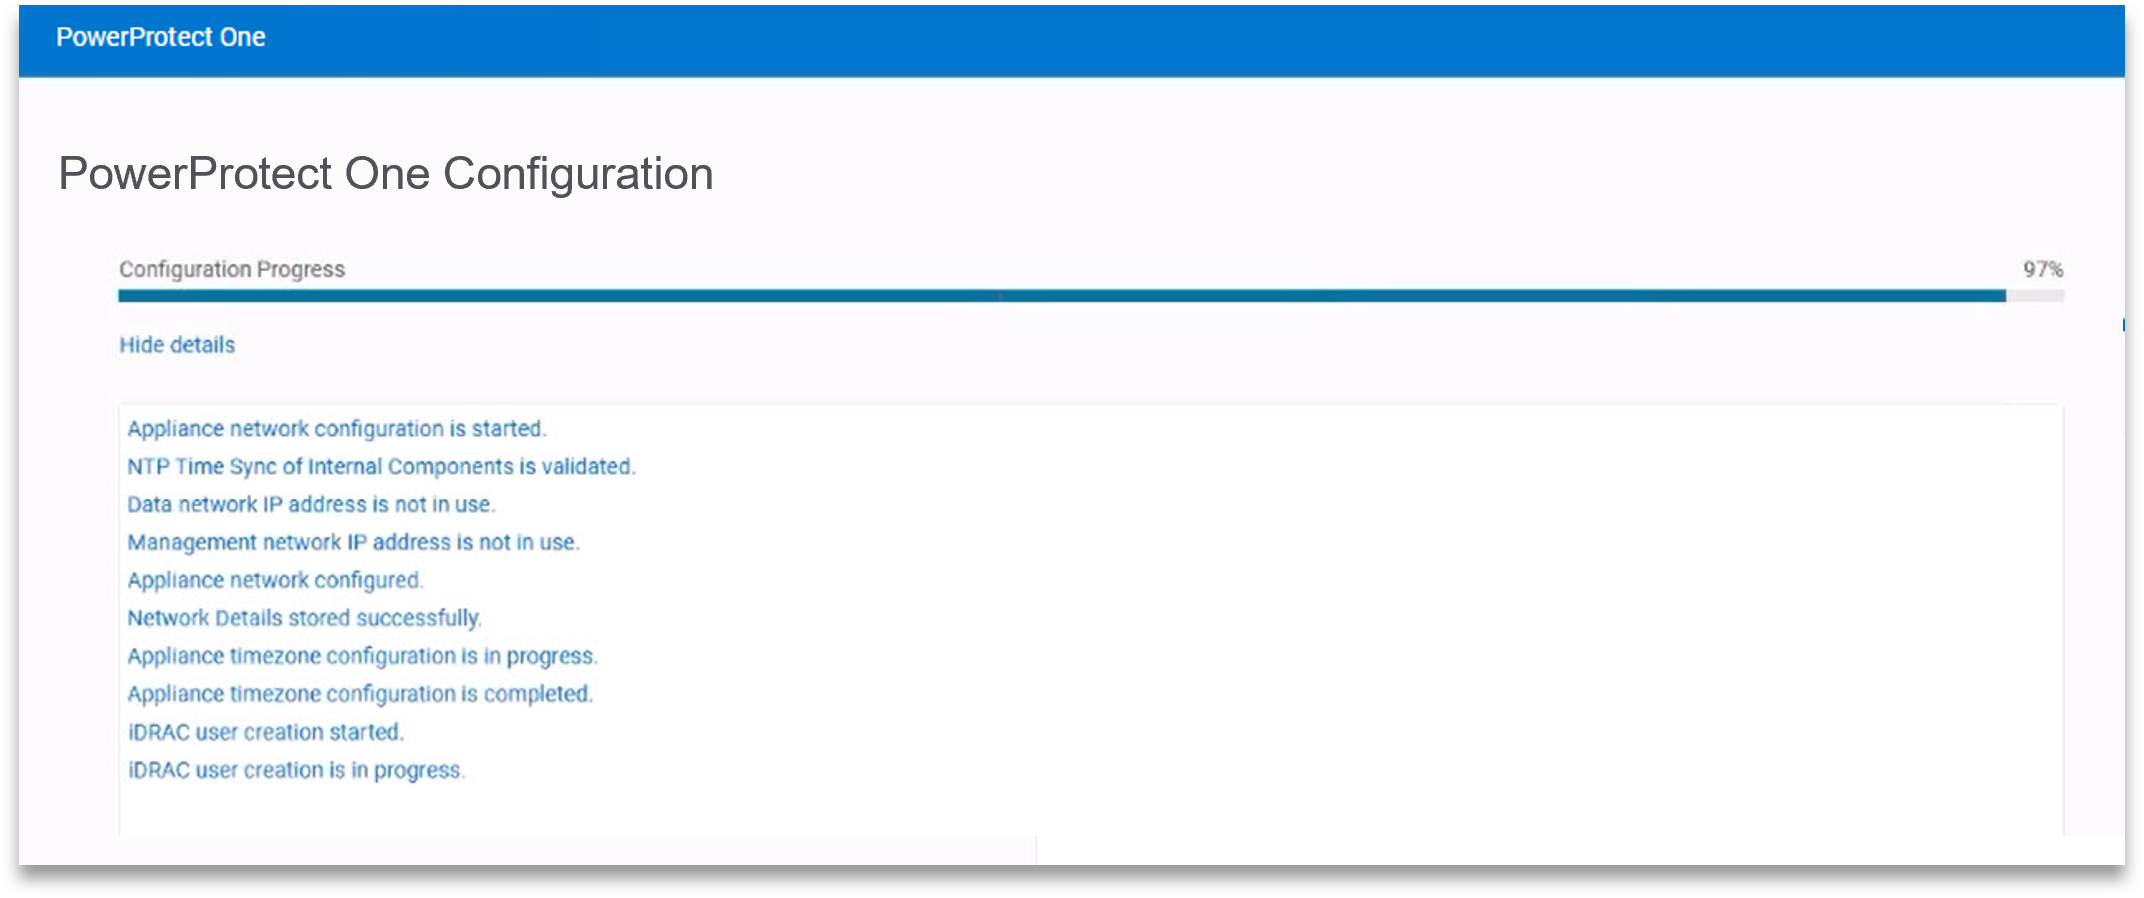
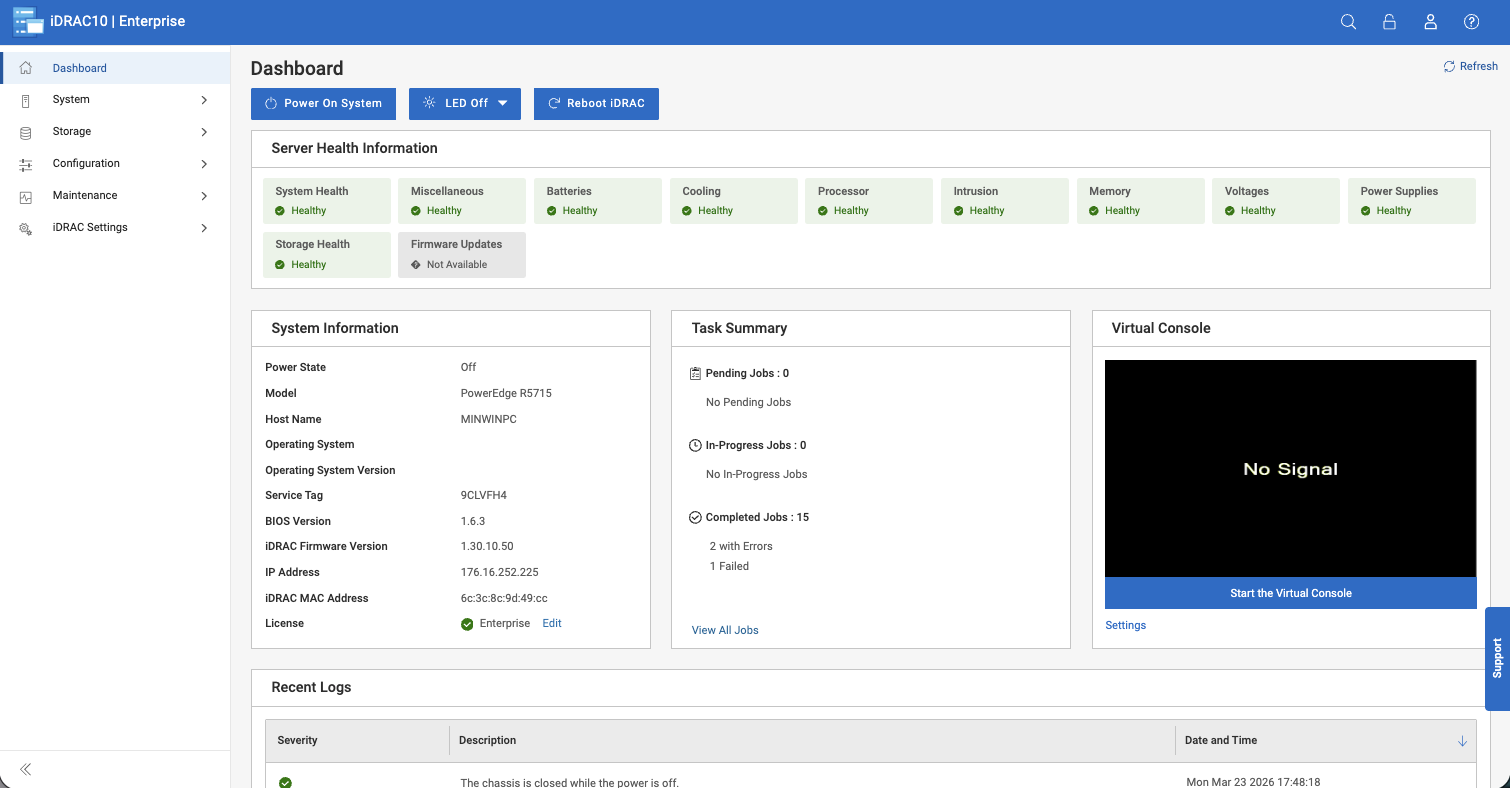
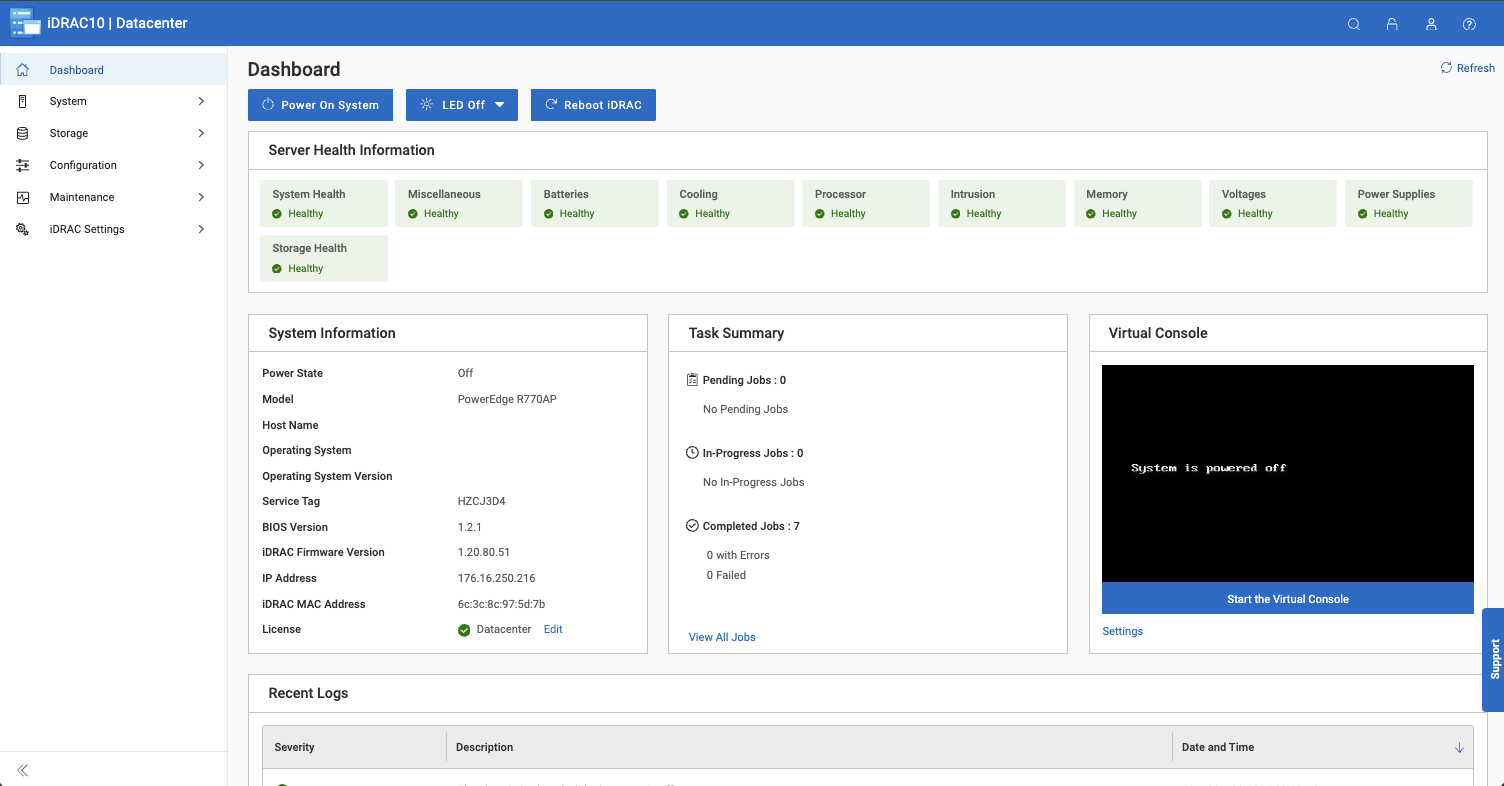
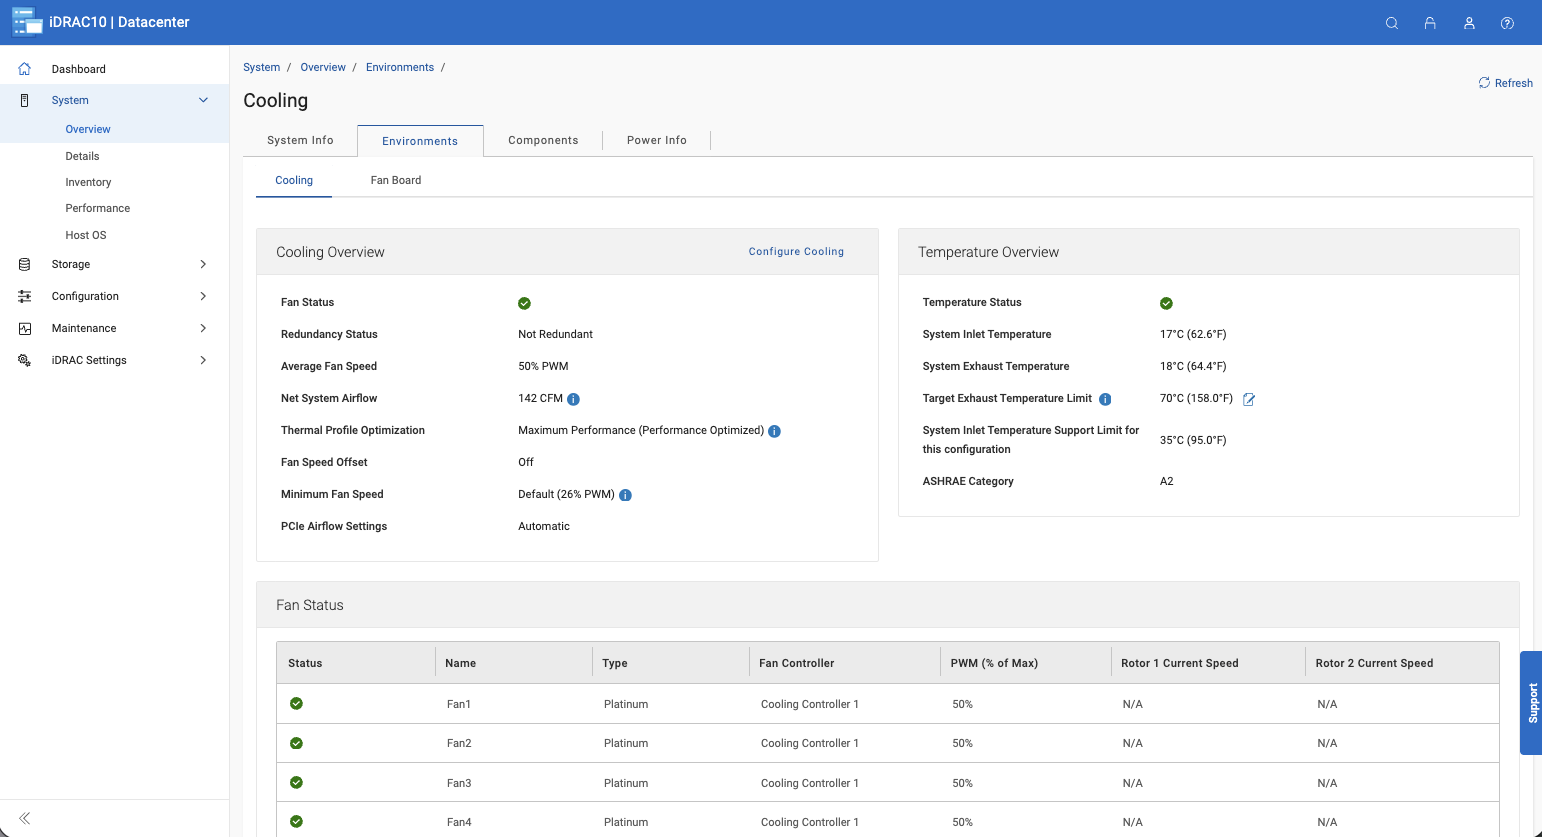
Early configuration includes host networking, time settings, and iDRAC access for the underlying hardware. Dell includes a read-only iDRAC account, which we found useful in practice. It provides visibility into hardware health and alerts without introducing the risk of accidental changes or shutdowns, something that becomes more important in environments that manage a fleet of Dell systems.
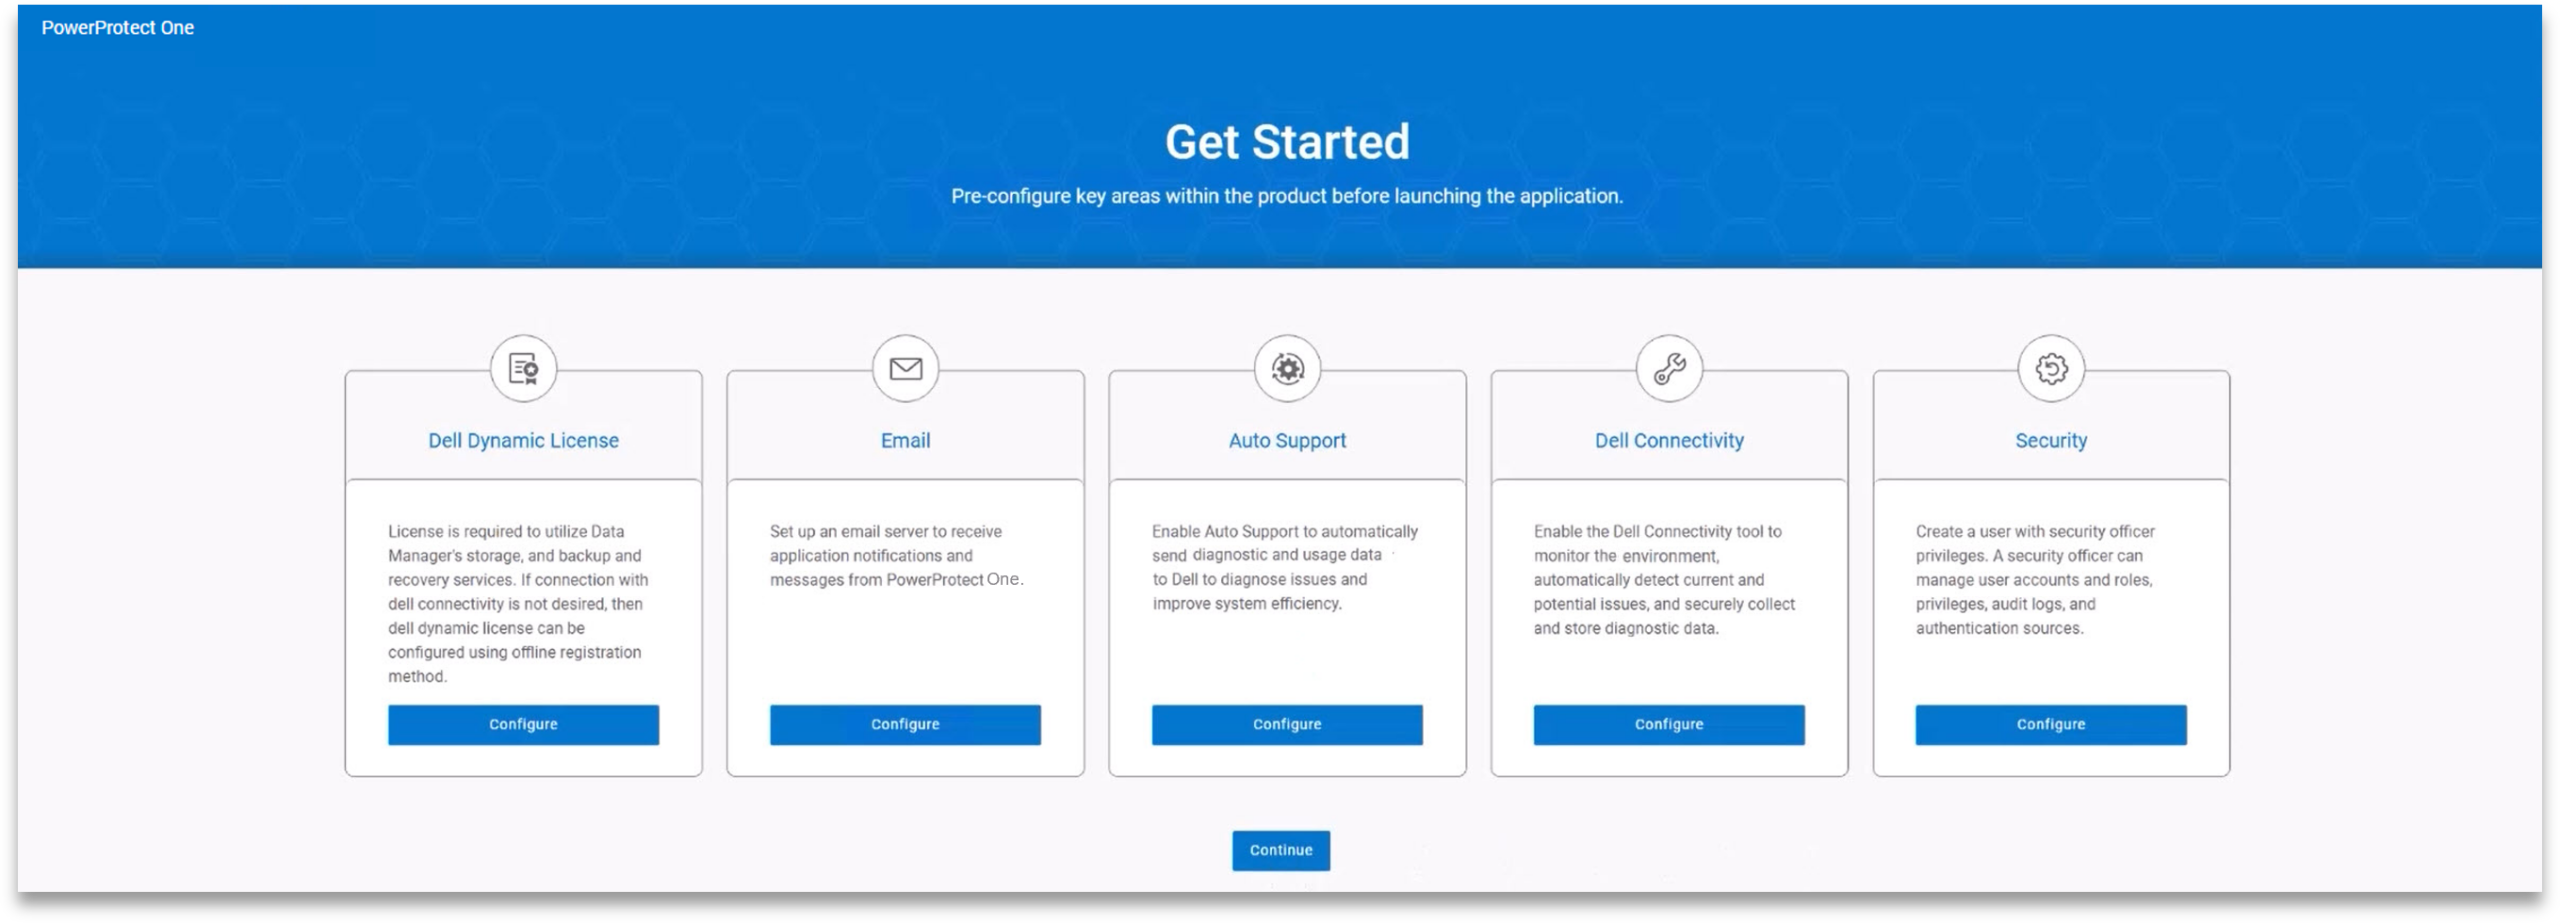
On first login, the platform presents the user with a “Get Started” workflow. This walks through email notifications, AutoSupport, security settings, and licensing. While these can all be configured later, having them front-loaded at the start helps users avoid critical omissions and quickly get the appliance into a production-ready state.
Day 2: Operations
Unified Dashboard
Day-to-day operations are centered around what Dell calls a Unified Dashboard. From here, PowerProtect One can manage numerous registered systems, giving administrators visibility into and control over all connected systems across the entire environment.
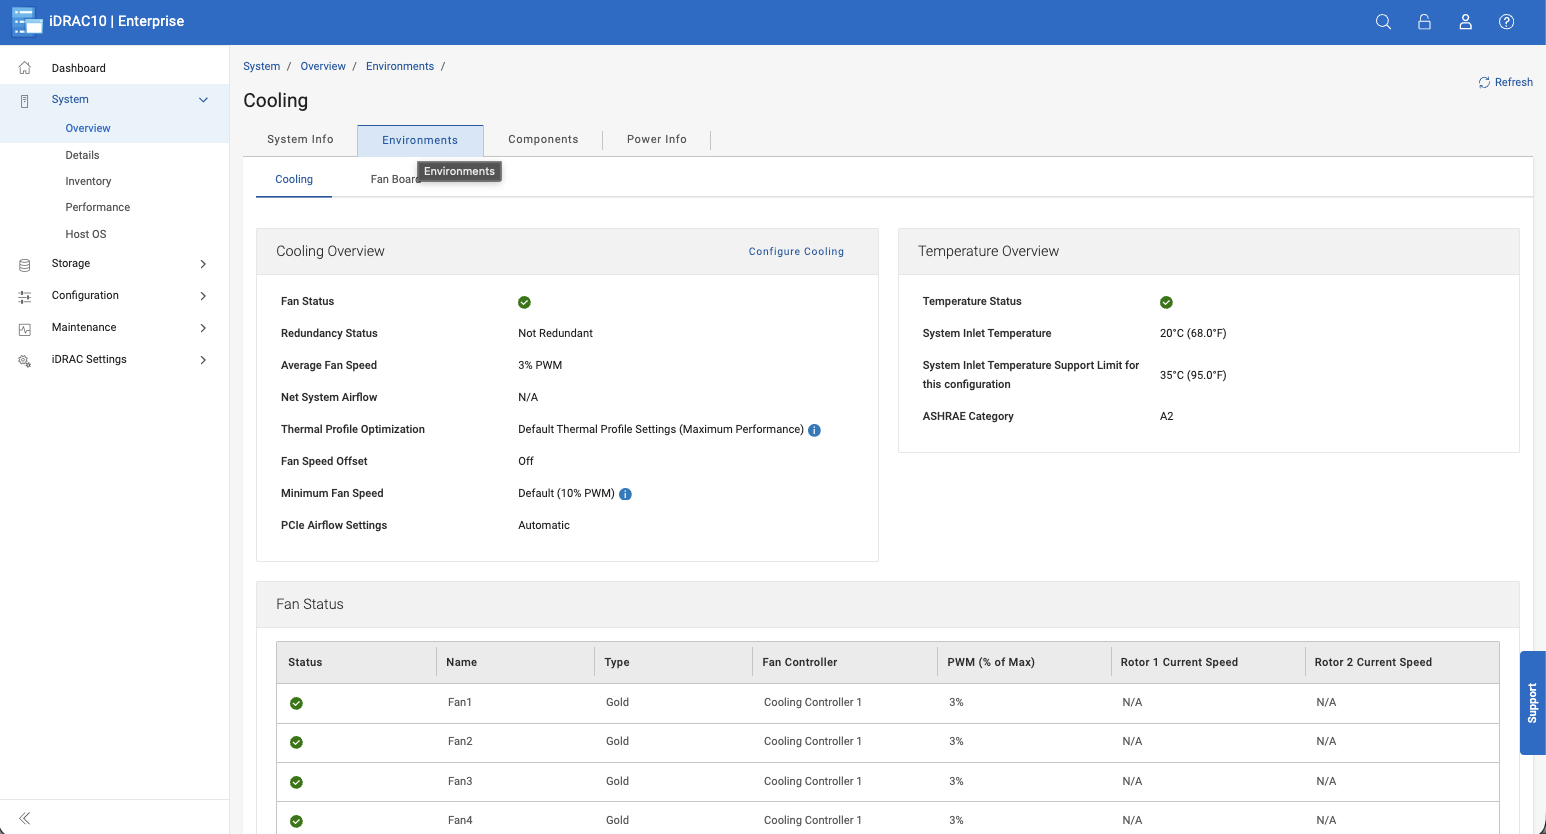
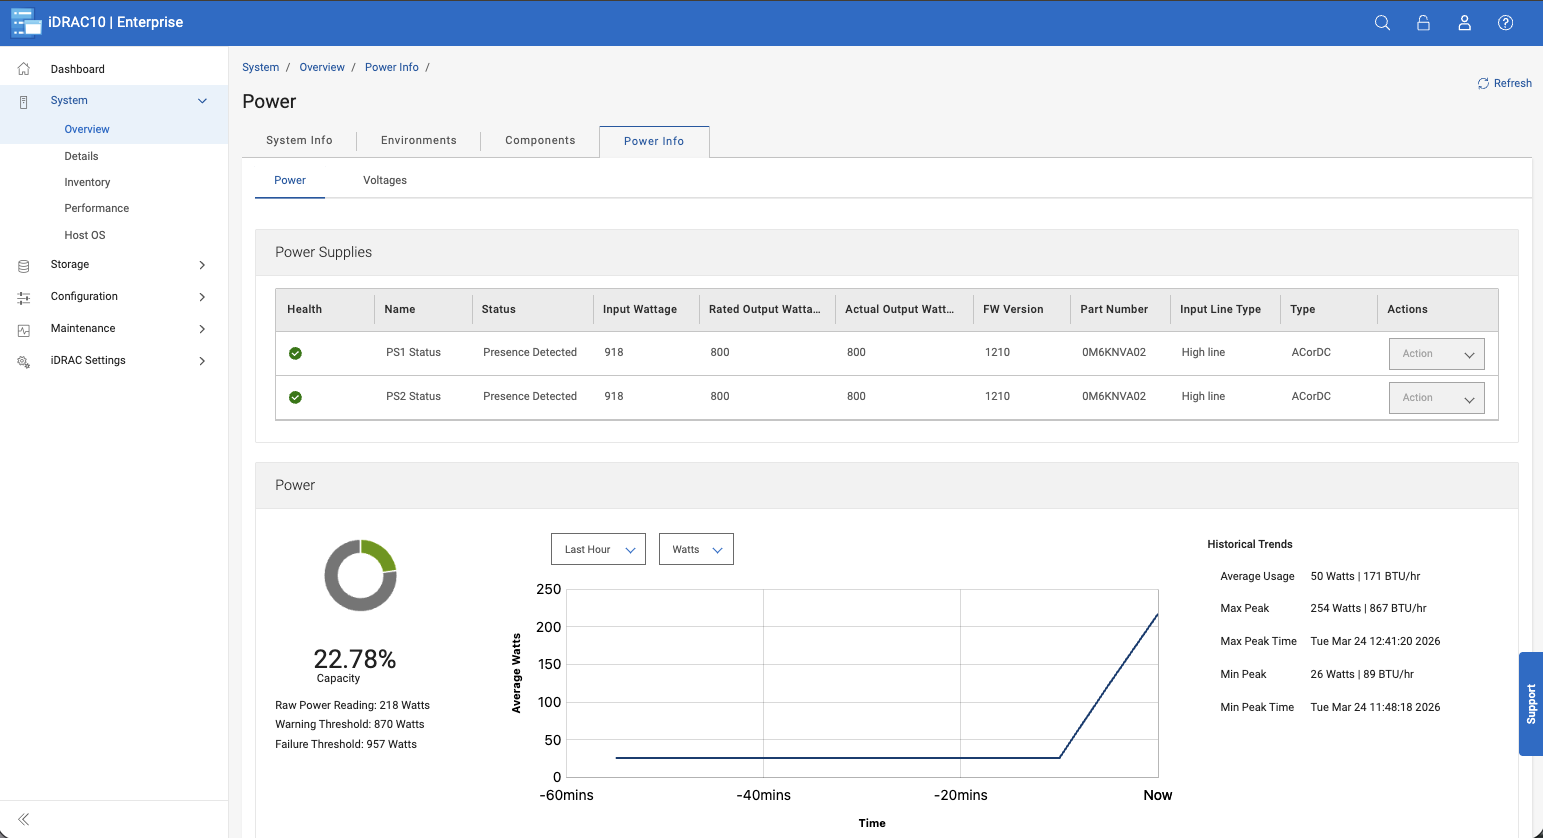
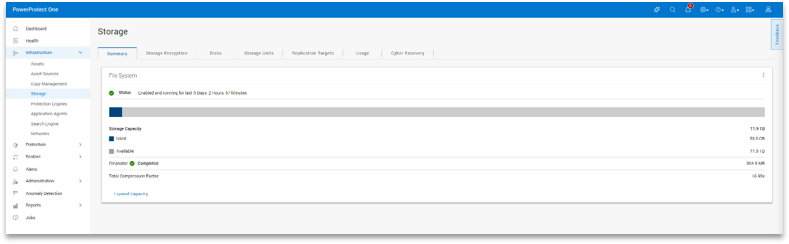
In practice, the dashboard surfaces the most important system information you’re likely to check first. Job activity is clearly displayed across all systems, including running, completed, and failed backups. System health is broken down into services, protection, storage, and security, which makes it easier to spot issues without digging through multiple menus.
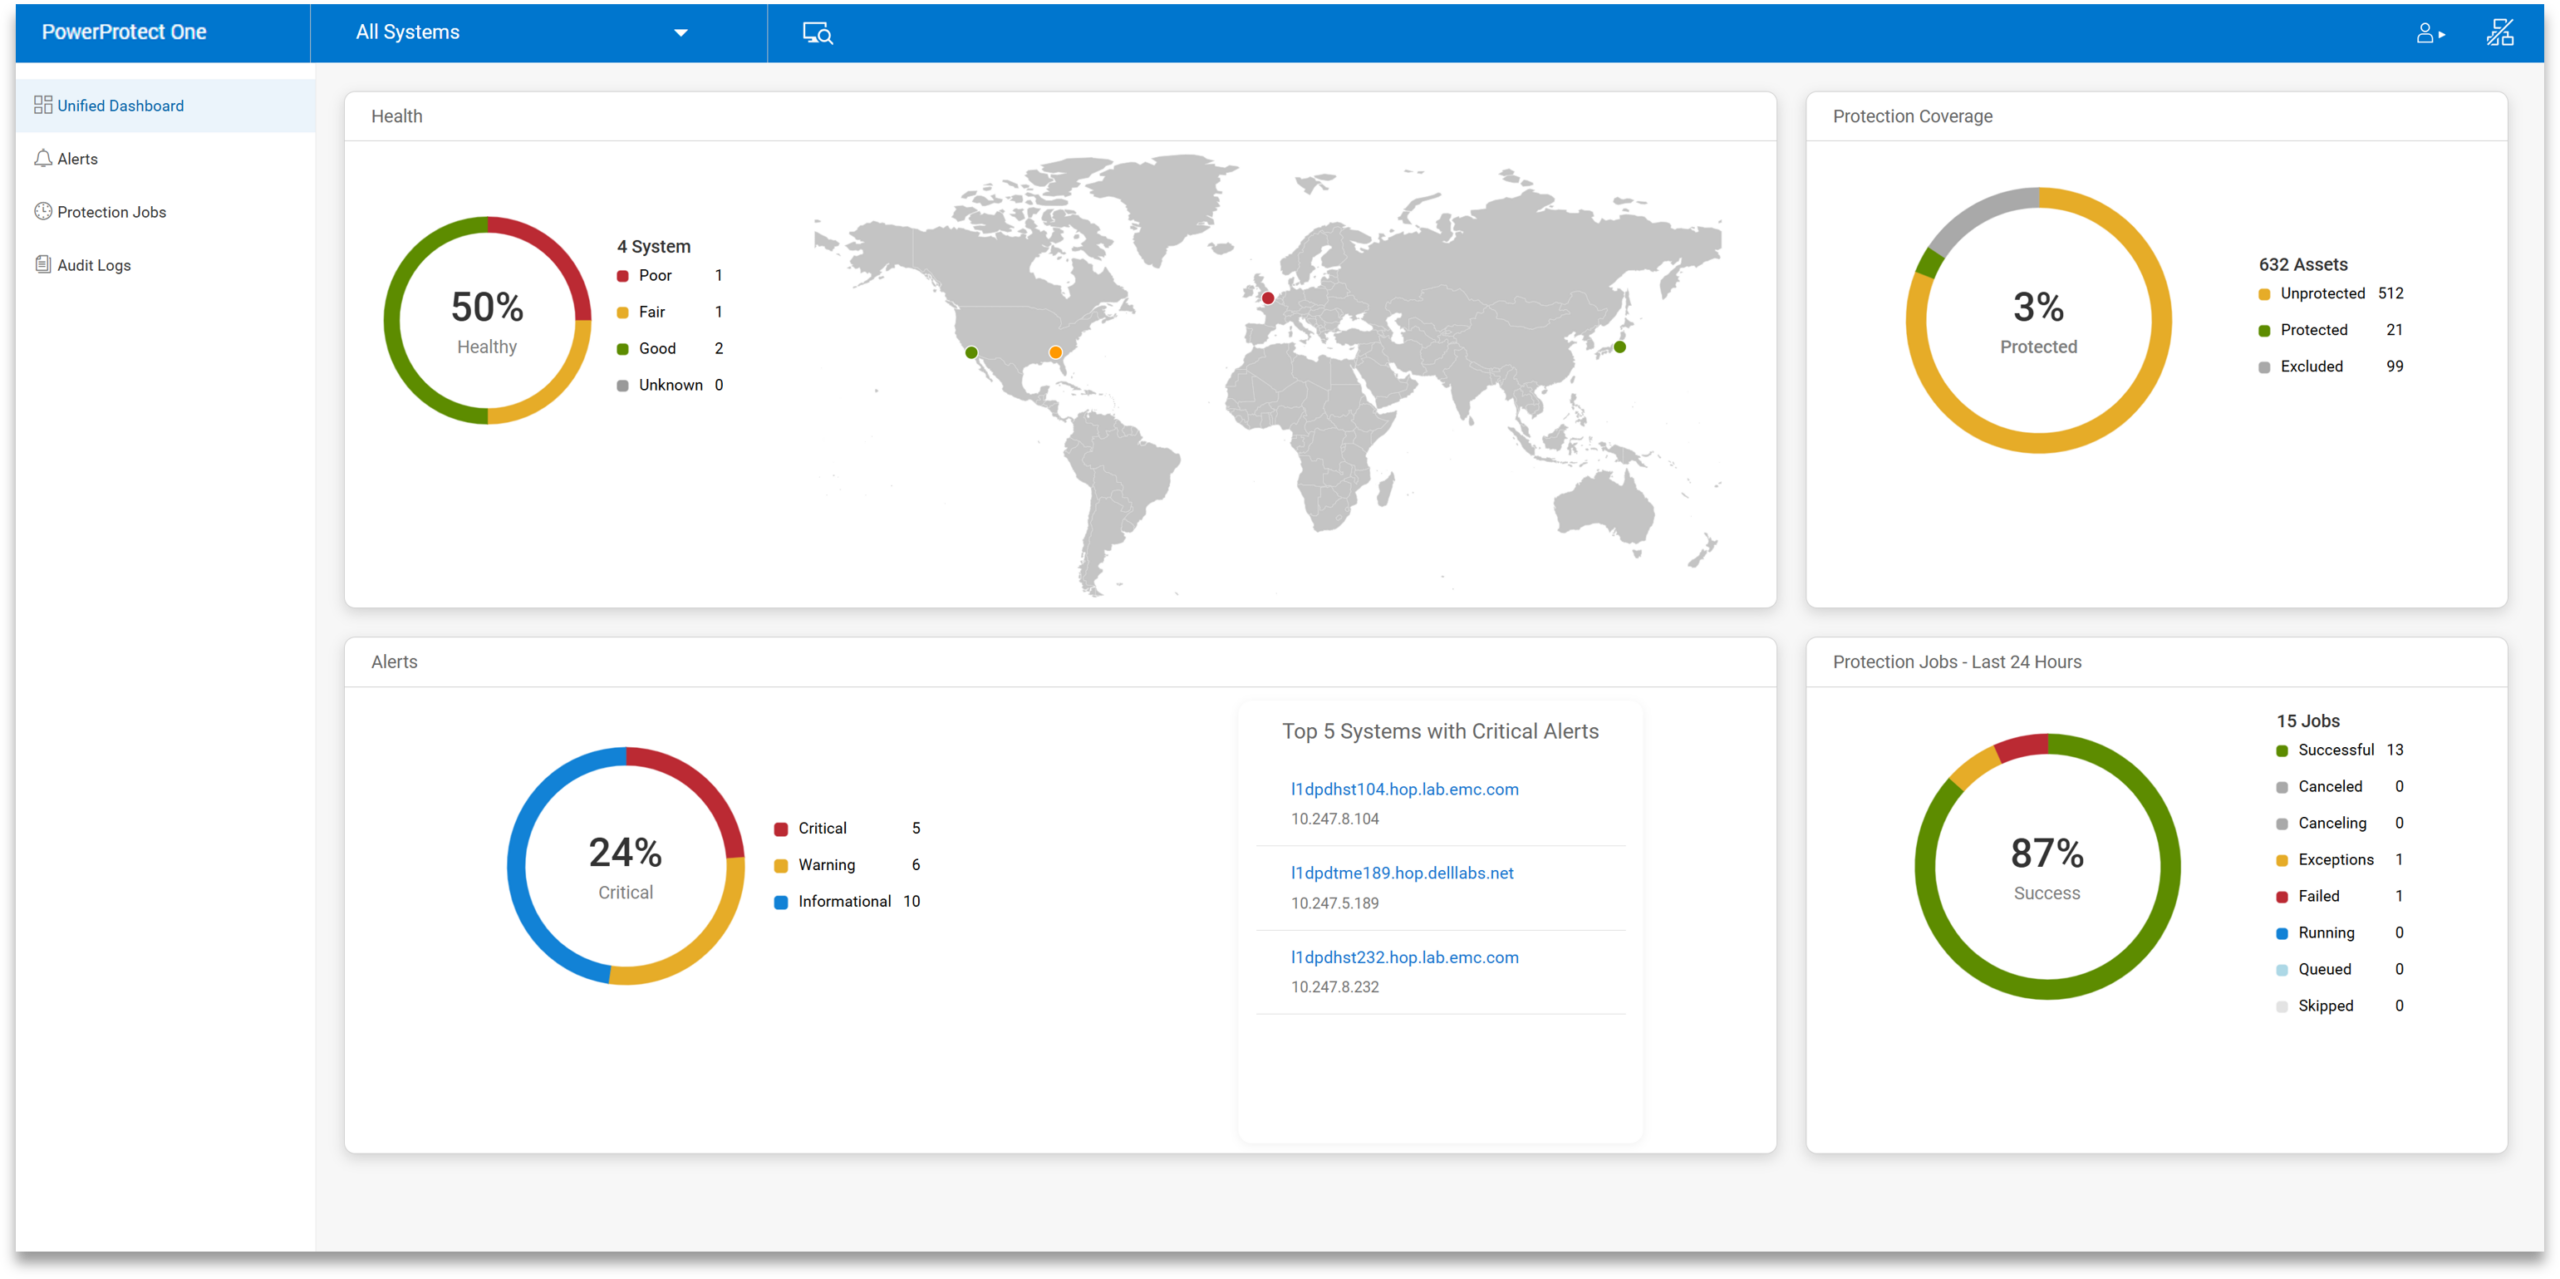
Capacity is also easy to track, with active tier usage and available space presented up front. The dashboard also shows total protected assets, recent anomalies, and data reduction efficiency, which provide rich context on how the systems in an environment behave day to day.
Navigation uses a nested tree layout on the left side. In use, this keeps things predictable. When drilling into a specific system or alert, it takes only a few clicks to switch between views without losing your place.
Storage Unit Creation
Storage in PowerProtect One is built around storage units, which serve as the primary containers for backup data under different policies. Storage units are created directly from the Infrastructure tab and incur little overhead.
Each storage unit can be configured with soft and hard quotas, as well as stream limits, to control throughput. Retention lock is available and straightforward to apply, allowing backups to remain immutable for a defined period. In our testing, this was easy to enable and didn’t add complexity to the workflow.
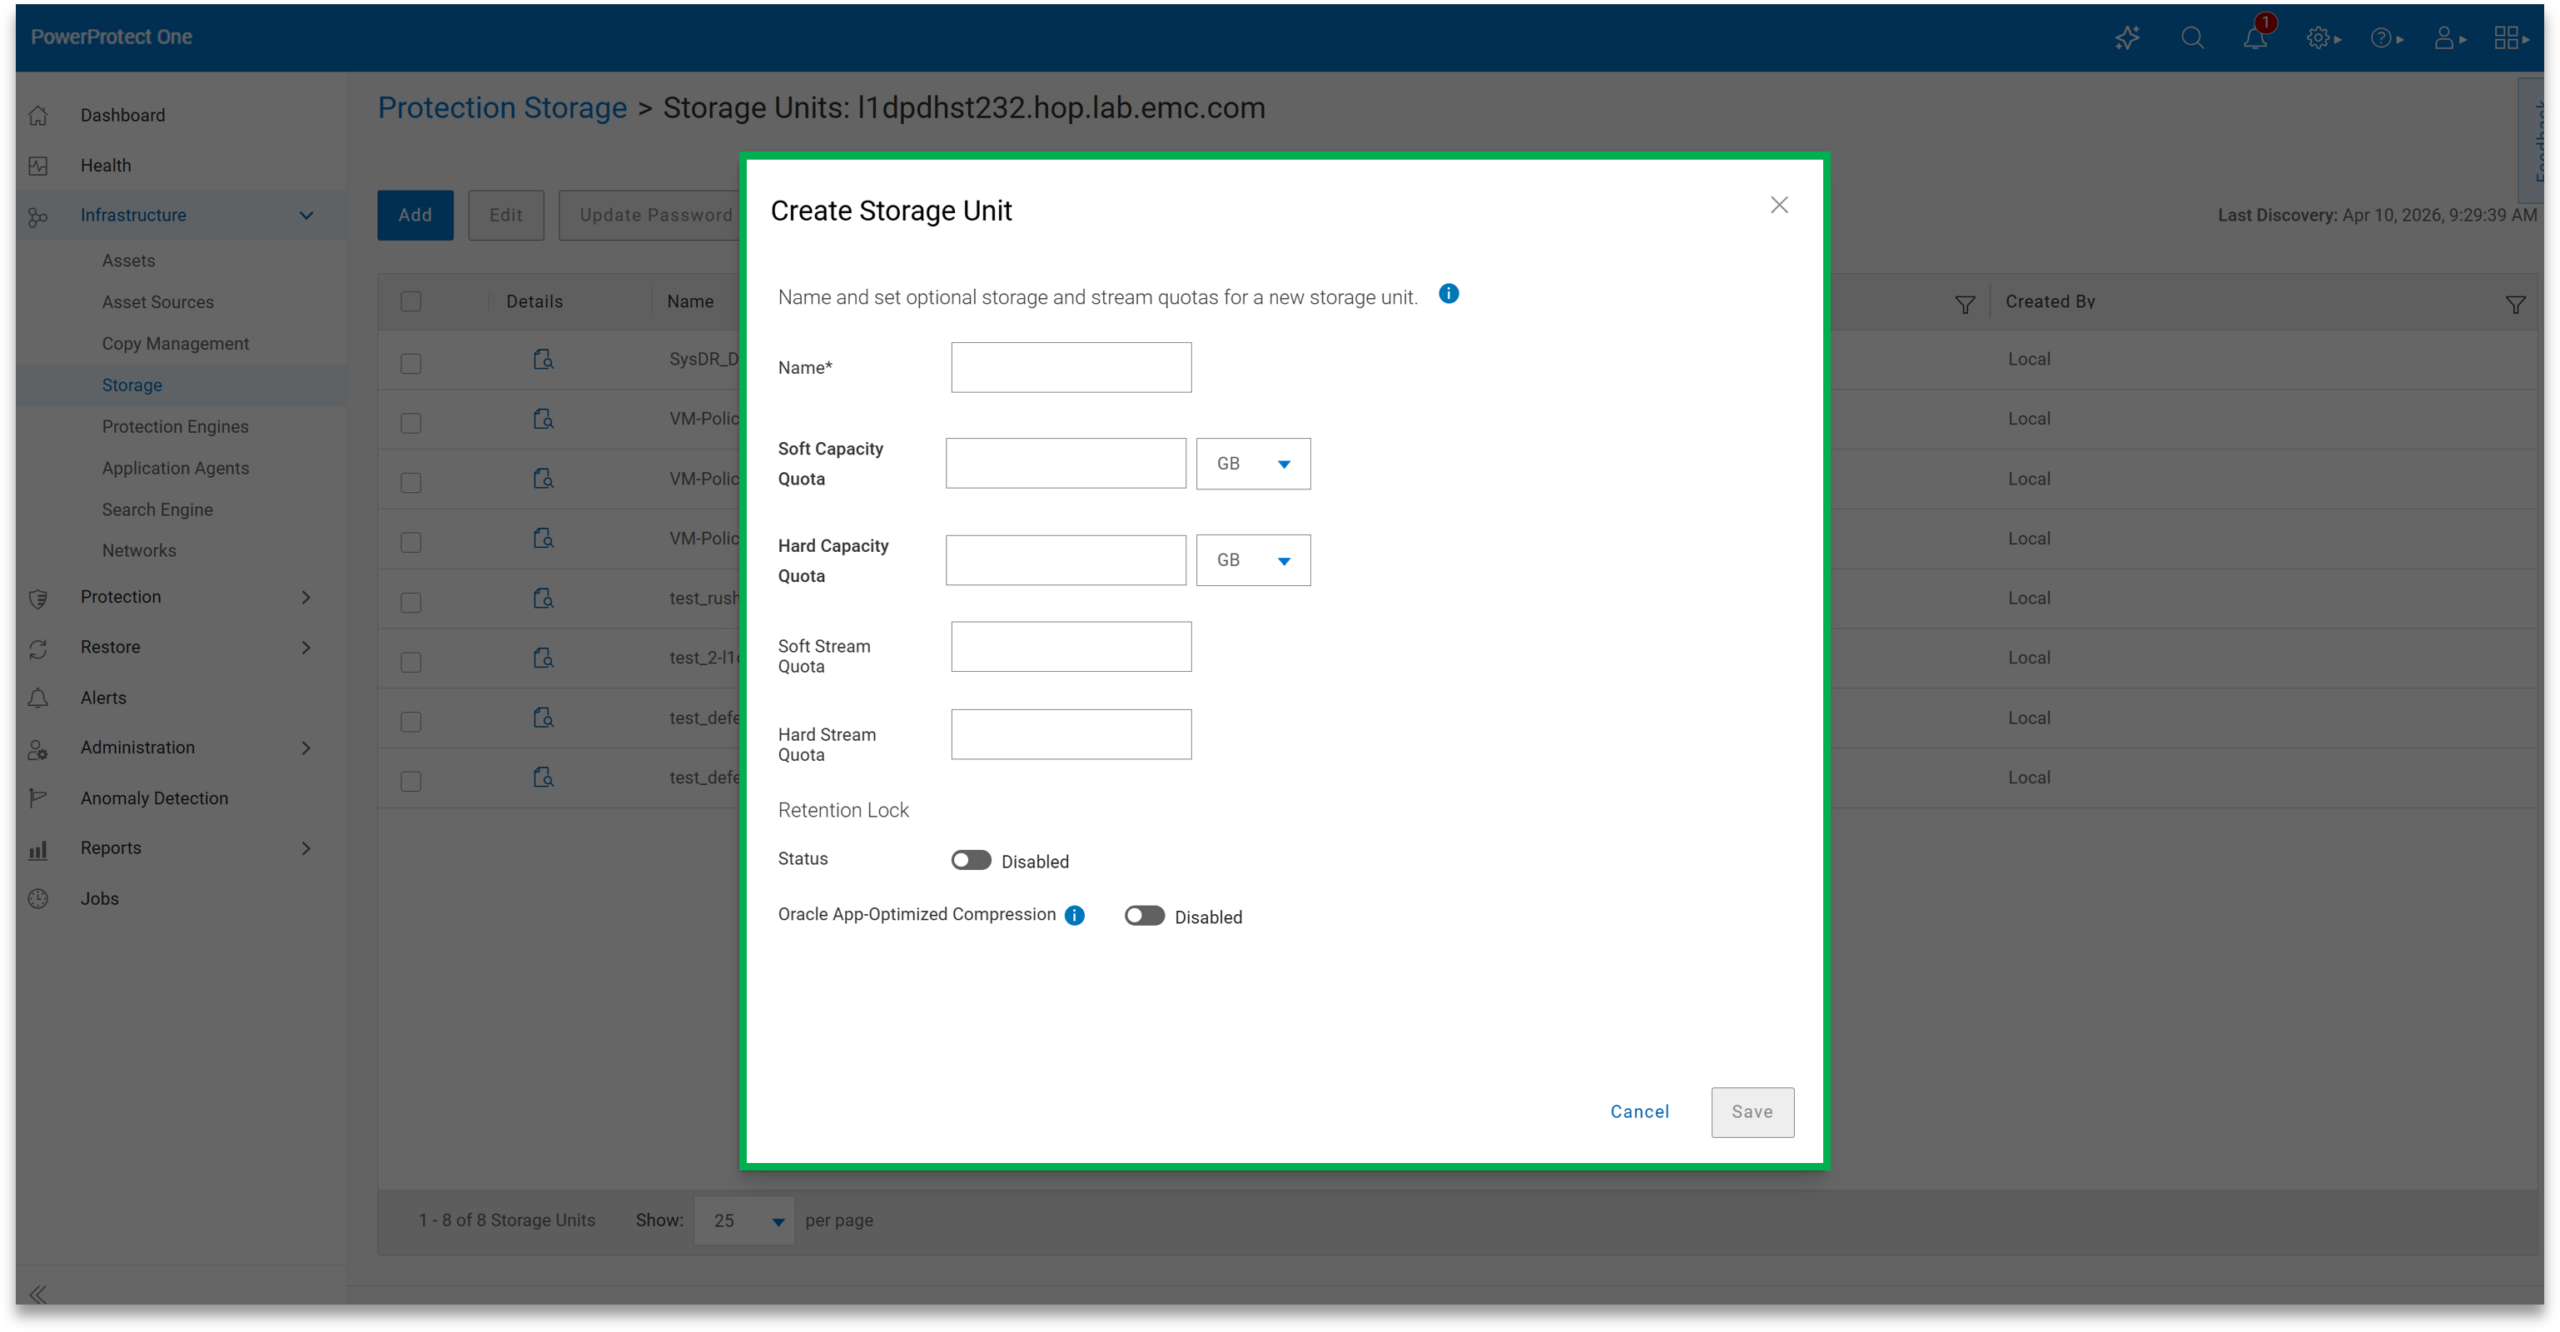
There are also workload-specific optimizations, such as tuning for Oracle environments. Storage units can be used for internal backup jobs or exposed externally via integrations such as DD Boost. PowerProtect One supports active and cloud storage tiers, allowing data to be stored locally or extended to cloud storage as needed.
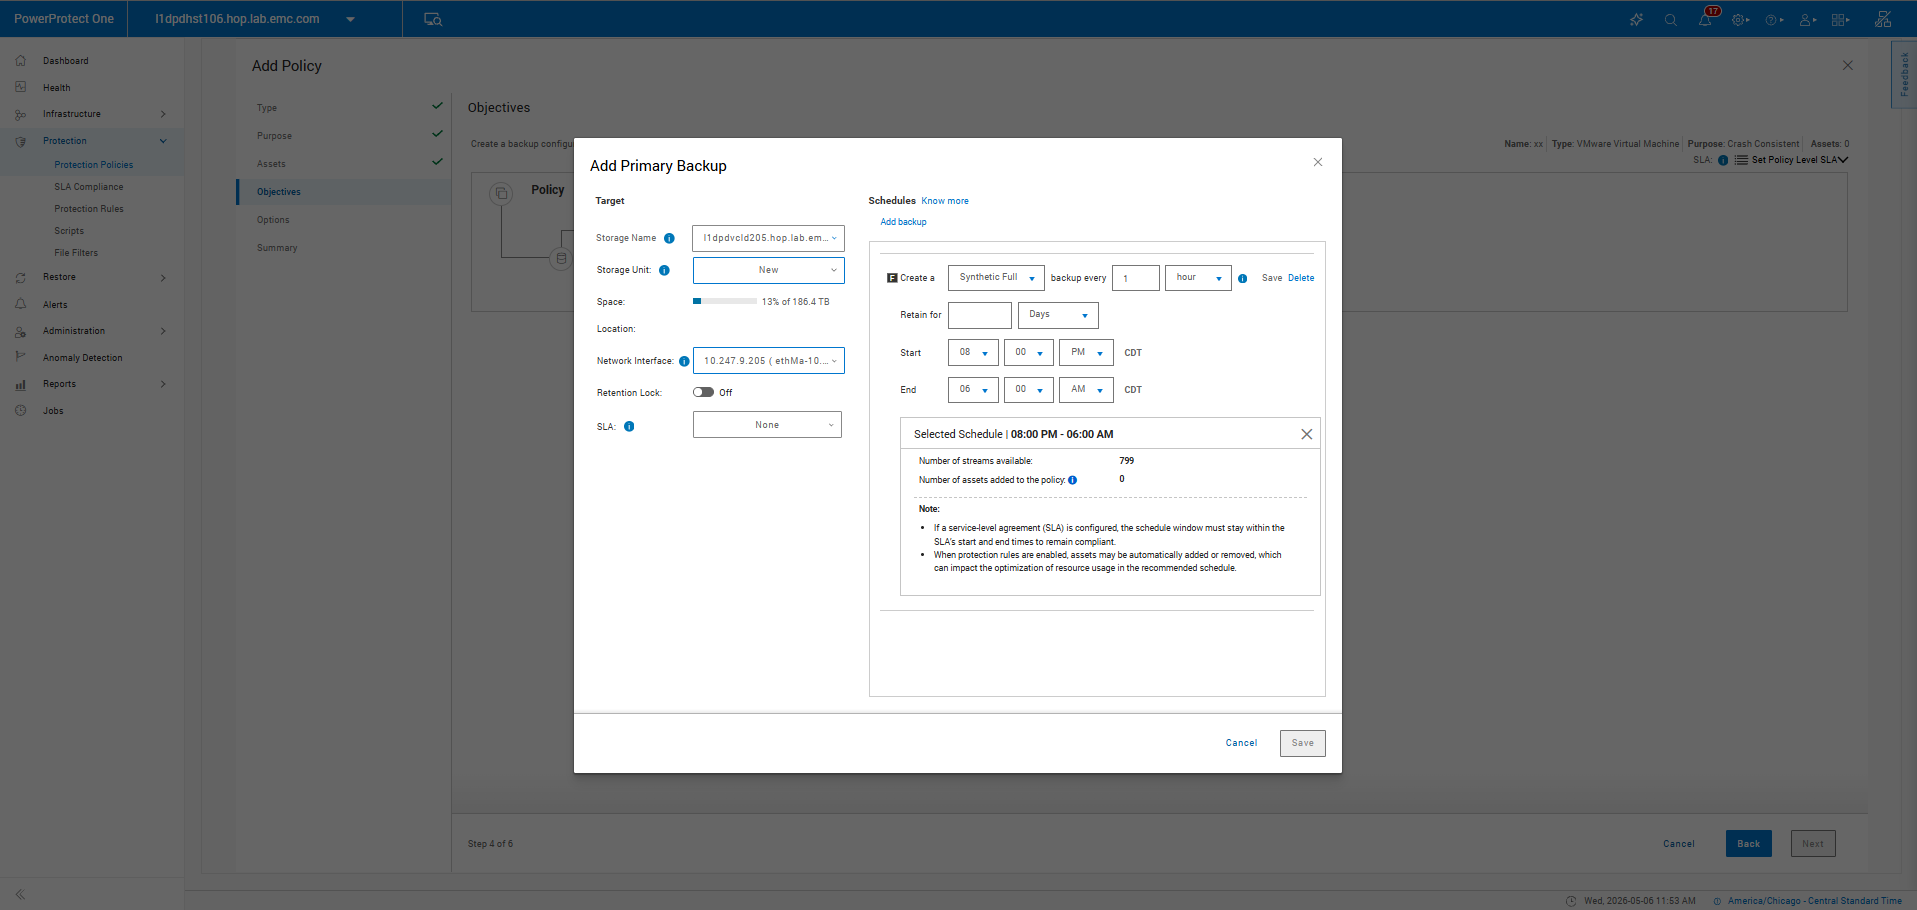
Policy Creation
Policy creation is handled under the Protection tab and follows a simple workflow. Once assets are added to the system, they can be assigned to a policy and given a defined backup objective.
By default, creating a policy also creates a new storage unit, though existing units can be selected if needed. Retention lock can be applied at this stage, ensuring that backups remain unchanged until the retention period expires.
Backup frequency and type are configurable, including synthetic full schedules and defined execution windows. Retention periods can be adjusted depending on requirements. Additional options such as replication, vaulting, cloud tiering, and archiving are available within the same policy configuration.
Once a policy is created, its progress can be monitored through the job view. In practice, this makes it easy to confirm that policies are running as expected without needing to jump between multiple sections of the interface.
Smart Scheduling
Scheduling is flexible without adding unnecessary complexity. Administrators can define when backups run, how often synthetic fulls occur, and how long data is retained, all through a straightforward, easy-to-adjust workflow.
Execution windows help avoid conflicts with production workloads, while optimization settings allow teams to favor performance or capacity depending on the use case. This flexibility also helps meet SLA requirements, in which backup jobs must be completed within specific timeframes. By tuning schedules and resource usage, administrators can better align backup operations with defined recovery objectives and business expectations.
Overall, the controls strike a balance between flexibility and simplicity, making it easy to adapt schedules without introducing unnecessary overhead.
Anomaly Detection
Anomaly Detection is built into the platform, adding an extra layer of visibility beyond standard job monitoring. When enabled, the system analyzes backup data for unusual patterns that could indicate corruption, misconfiguration, or potential ransomware activity.
Results are presented in a dedicated view where administrators can review flagged events, generate reports, and take action. This includes marking events as safe or isolating suspicious data. The system also allows for custom anomaly rules, helping reduce false positives and align more closely with the specific behavior of each environment.
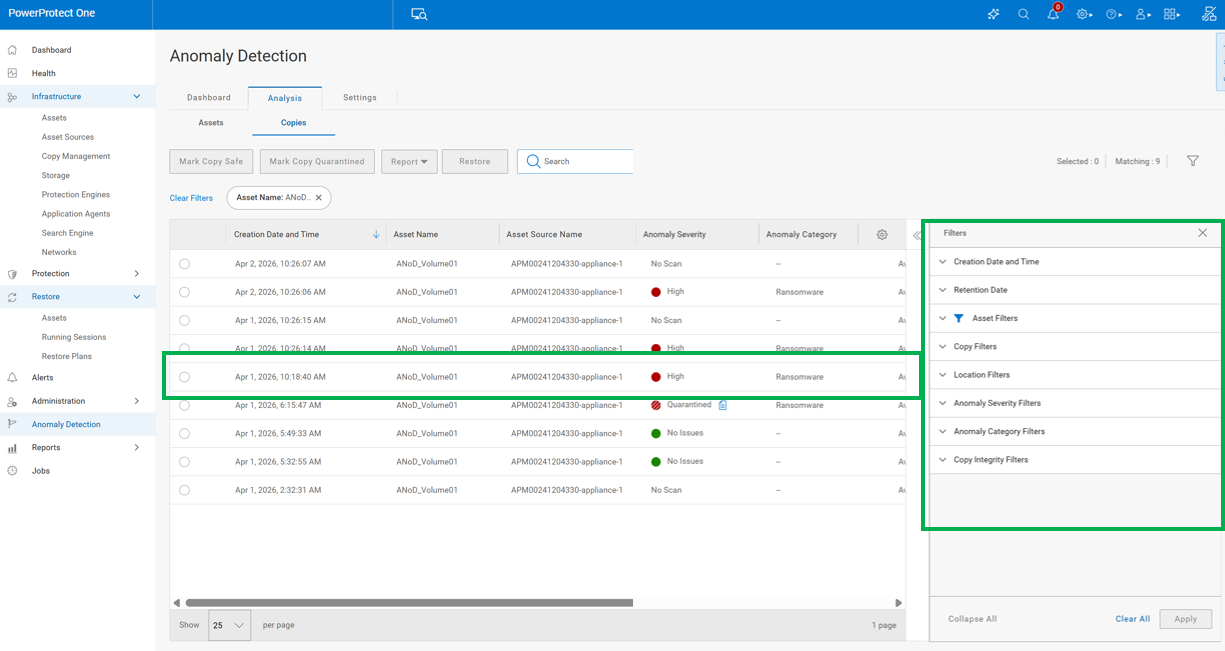
For organizations, this moves backup from a passive safety net to a more active part of the security and operations strategy. Instead of only confirming that jobs completed successfully, teams gain insight into whether the data itself looks consistent and trustworthy. This can help catch issues earlier, reduce recovery risk, and provide additional confidence that backups will be usable when needed.
It’s particularly valuable in larger environments where manually validating backup integrity across systems isn’t practical. By surfacing potential issues proactively, Anomaly Detection helps reduce time to identify problems and supports faster, more informed decision-making when something looks off.
AI Assistant
PowerProtect One includes an AI Assistant that allows administrators to query the system using natural language. It connects to a customer-provided LLM and pulls real-time operational data.
Rather than replacing the interface, it acts as a shortcut into it. Queries like “show me failed backups” or “what systems are unprotected” return relevant results without requiring navigation through multiple menus. Beyond surfacing information, the assistant can guide users directly to the appropriate areas of the interface to take action, whether that’s reviewing a failed job, adjusting a policy, or creating a new configuration.
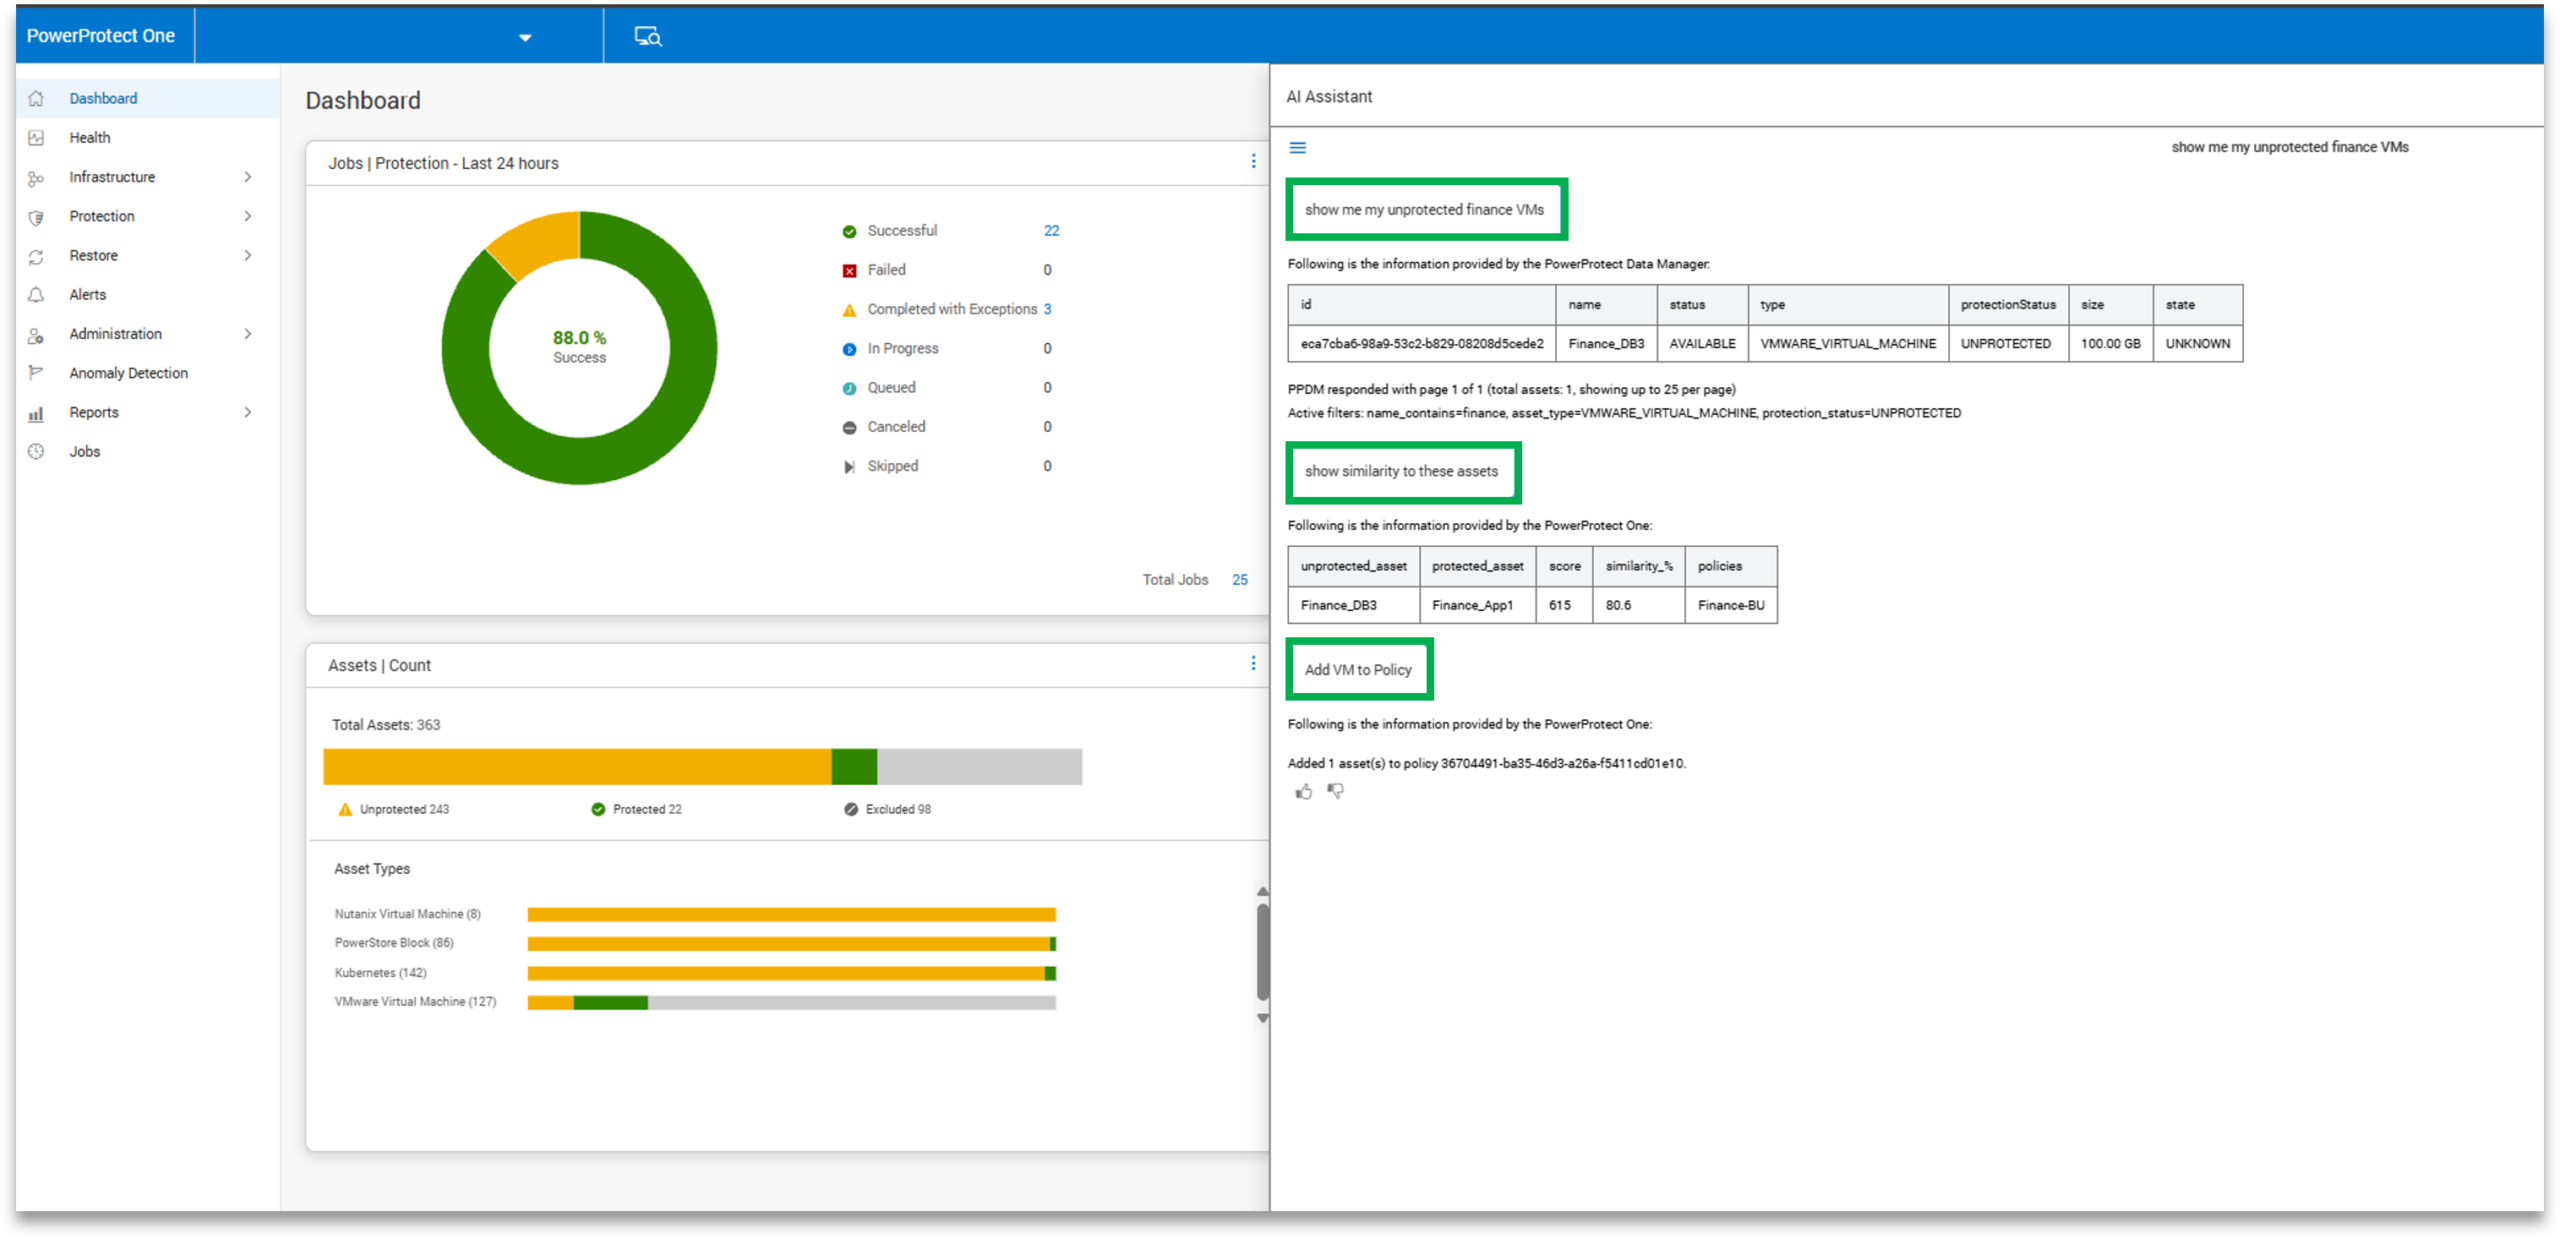
This becomes especially valuable in environments with multiple systems or large-scale deployments. Instead of manually drilling into each system to gather status or job data, administrators can query across the environment in a single step. It also lowers the barrier for generalists or teams without deep storage expertise, allowing them to interact with the platform more intuitively and reduce time spent searching for information.
Setup is simple, requiring a base URL, API key, and model selection. Once configured, it provides an additional layer of accessibility to the platform, helping streamline routine checks, troubleshooting, and day-to-day operations.
Day 3: Management
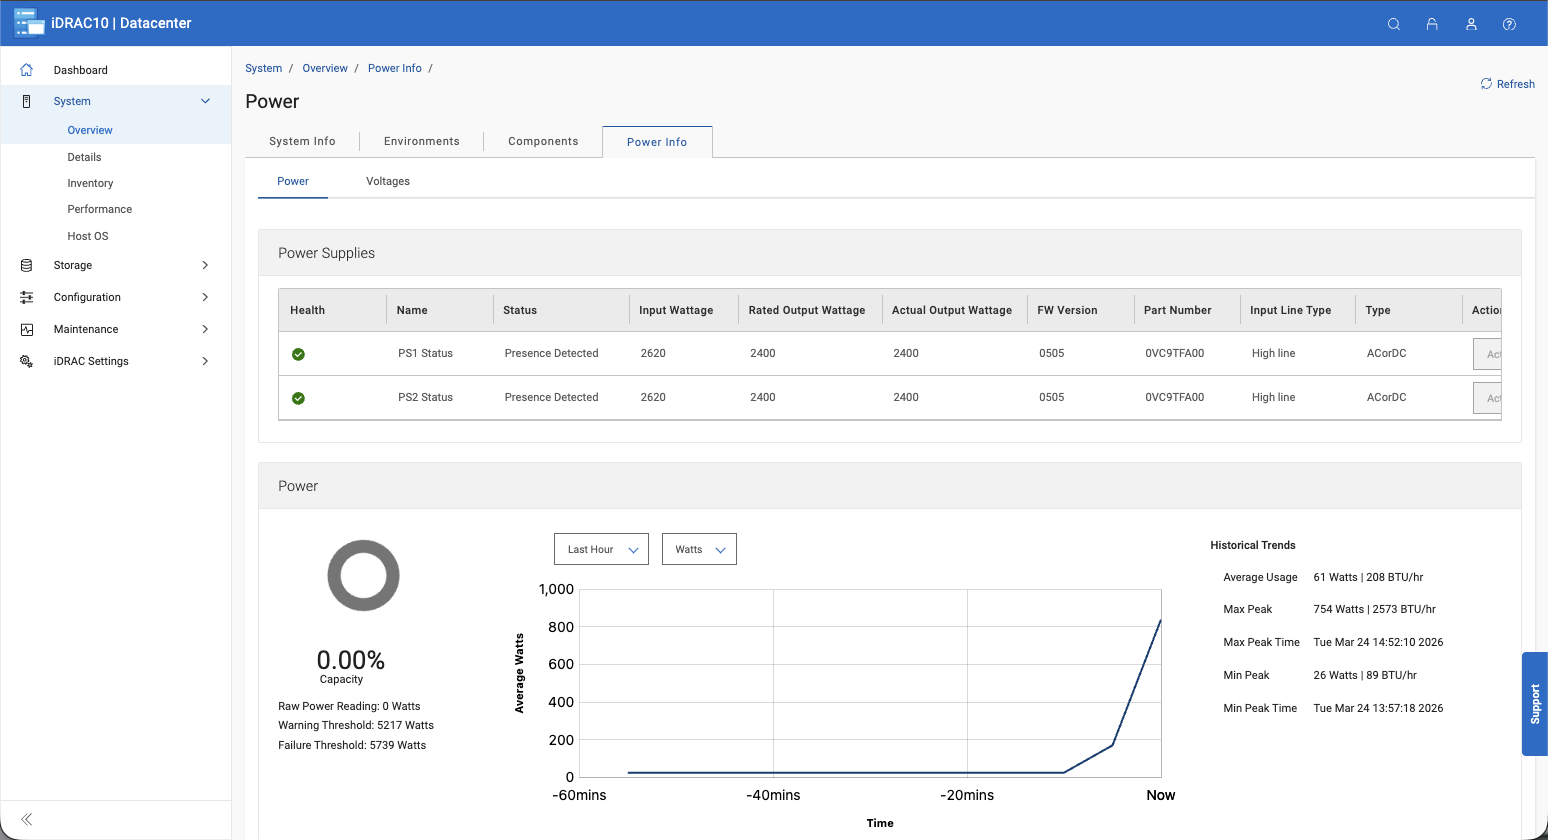
Capacity Monitoring
Capacity monitoring is always visible from the dashboard. It shows how much space is in use, how much remains, and how effective data reduction is over time.
In practice, this makes planning easier. You don’t need to dig through multiple views to understand where you stand; trends are easy to spot in the main interface.
Licensing
Out of the box, the appliance includes a temporary license that supports up to 24TB for 90 days. This provides ample room to deploy and validate the system before applying the purchased permanent license to the unit.
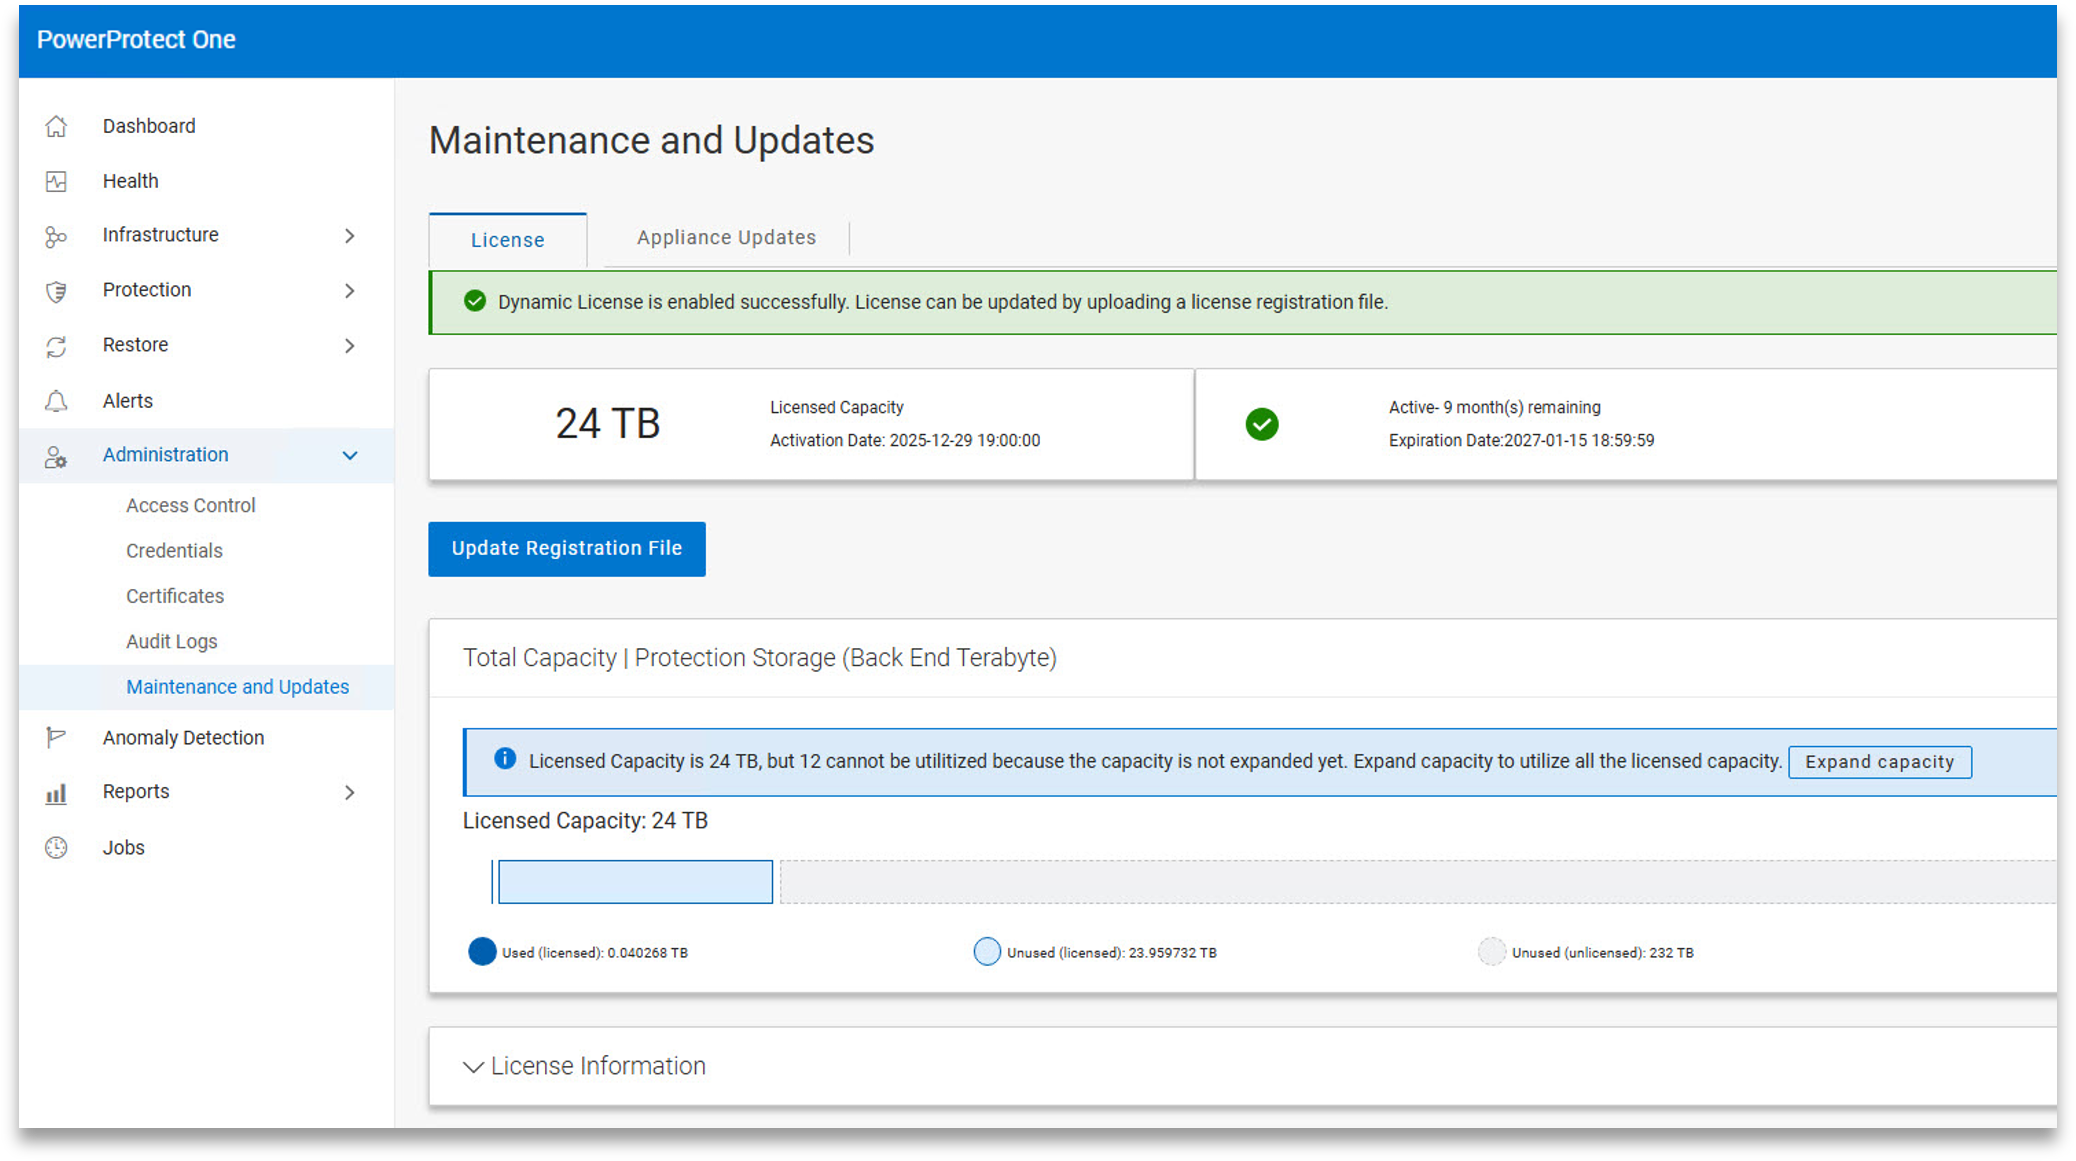
Licensing can be applied online or offline, depending on the organization’s requirements. Once installed, the system can be manually expanded to the new licensed capacity with a single click, without requiring extensive additional configuration. In testing, this process was straightforward and didn’t interrupt normal operations.
PowerProtect One Updates
Updates are handled through a simple workflow. The system can check for updates online directly from Dell or accept manually uploaded packages, and applying an update is a one-click process.
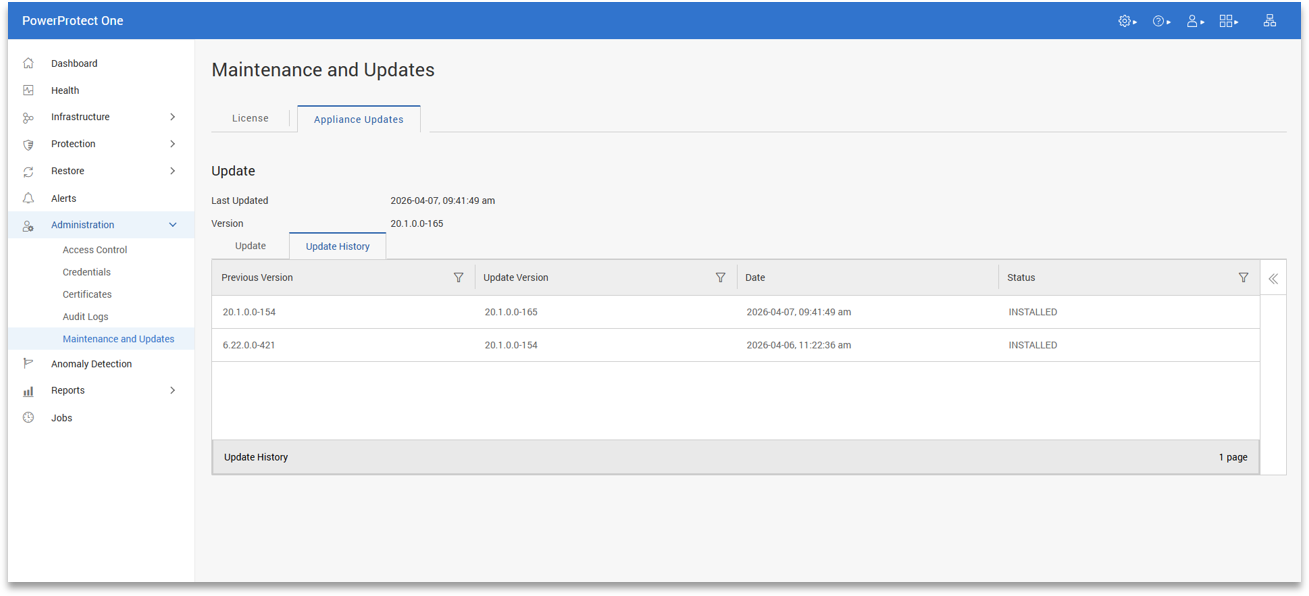
This keeps ongoing maintenance straightforward. In practice, it reduces the time and effort required to keep the system current, which is important in environments where updates often get delayed or forgotten due to complexity.
Key Takeaways
PowerProtect One represents a shift in how Dell delivers cyber resilience. The protection storage architecture, deduplication engine, broad workload catalog, and DD Boost ecosystem are all carried forward from the Data Manager and Data Domain foundation that Dell customers have been deploying for years. PowerProtect One consolidates these capabilities into a single, unified platform, tailored to address the operational challenges faced by cyber resilience teams today.
The approach matters as the long-standing balance between open ecosystems and integrated management has shaped organizational strategies for cyber resilience. PowerProtect One sets aside that tradeoff. Customers can keep the third-party backup tools their teams already know, expose PowerProtect One as a target for those tools via DD Boost, and gain unified management, AI-assisted operations, and platform-level cyber-resilience capabilities without changing the rest of the environment. The open ecosystem story is embedded in the product’s architecture.
PowerProtect One does not require organizations to rebuild their cyber resilience strategy. The backup applications, DD Boost integrations, protection storage architecture, and operational workflows that most Dell customers already rely on remain intact. What changes is the management model around them. Dell has consolidated backup software, protection storage, cyber-resilience tooling, and operational oversight into a single platform that is easier to deploy, manage, and scale.
That shift matters because backup infrastructure is now judged less by whether backups complete successfully and more by how quickly organizations can identify problems, validate recovery points, and restore clean data after an attack. PowerProtect One is designed around those operational realities. The platform keeps the flexibility of an open ecosystem while simplifying the day-to-day experience of managing protection infrastructure across increasingly large and complex environments.
Product Page – Dell PowerProtect One
This report is sponsored by Dell Technologies. All views and opinions expressed in this report are based on our unbiased view of the product(s) under consideration.
The post Dell PowerProtect One: Open, Integrated, and Intelligent Cyber Resilience appeared first on StorageReview.com.

 Polyester, Heat-shrink Polyolefin, Metalized Polyester, Nylon Cloth, Polyester, Polypropylene, Reflective Tape, Self-laminating Polyester, Self-laminating Vinyl, StainerBondz