Reading view

There are new articles available, click to refresh the page.

Antec Flux Pro Noctua Edition Review: Six G2 Fans and Walnut Trim for $399.90

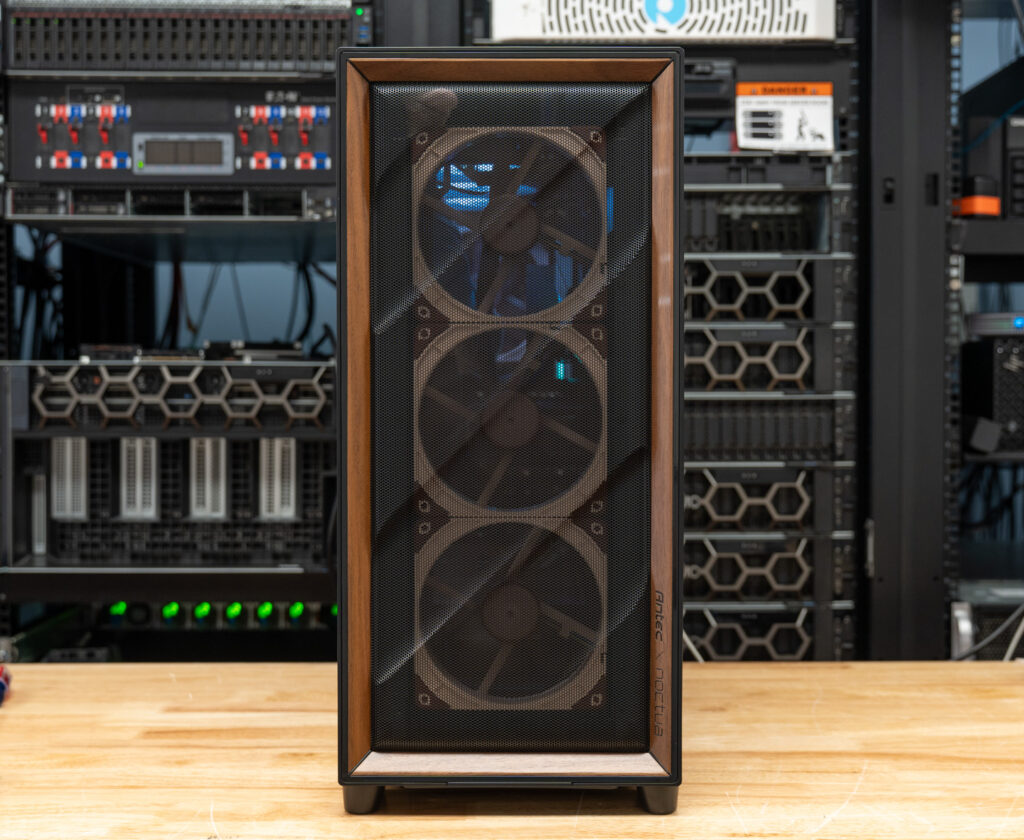
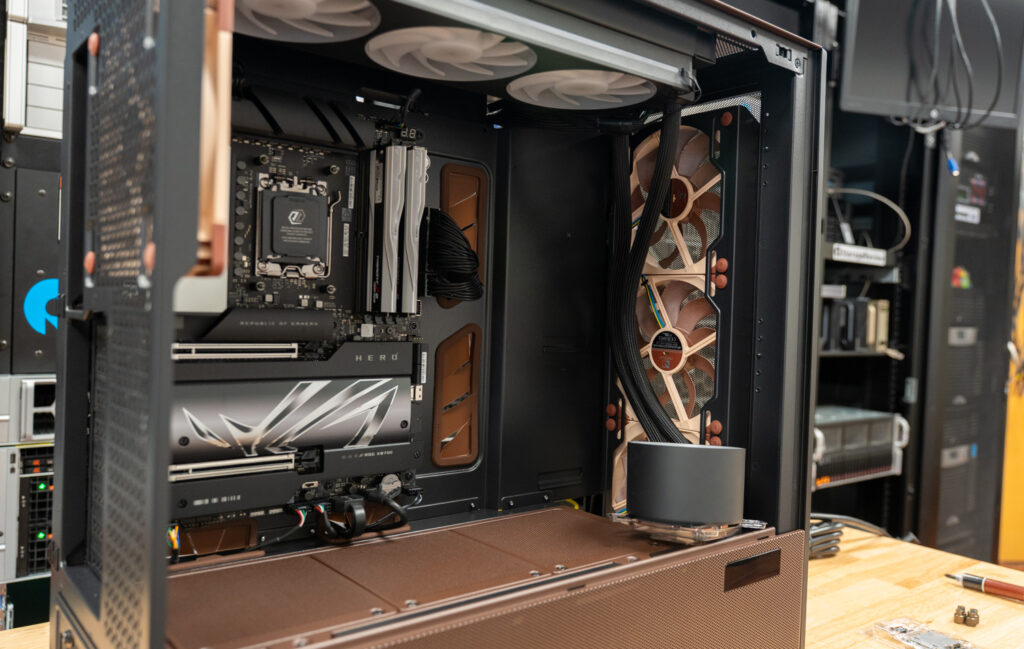
The Antec Flux Pro Noctua Edition is a premium full-tower case that takes the existing Flux Pro layout and replaces the standard fan package with six Noctua G2 PWM fans. The airflow setup includes three NF-A14x25 G2 front intake fans, two NF-A12x25 G2 lower intake fans above the PSU shroud, and one NF-A14x25 G2 rear exhaust fan. For this build, we used the full set of supplied fans in that configuration, with the NZXT AIO radiator mounted up top as the exhaust.

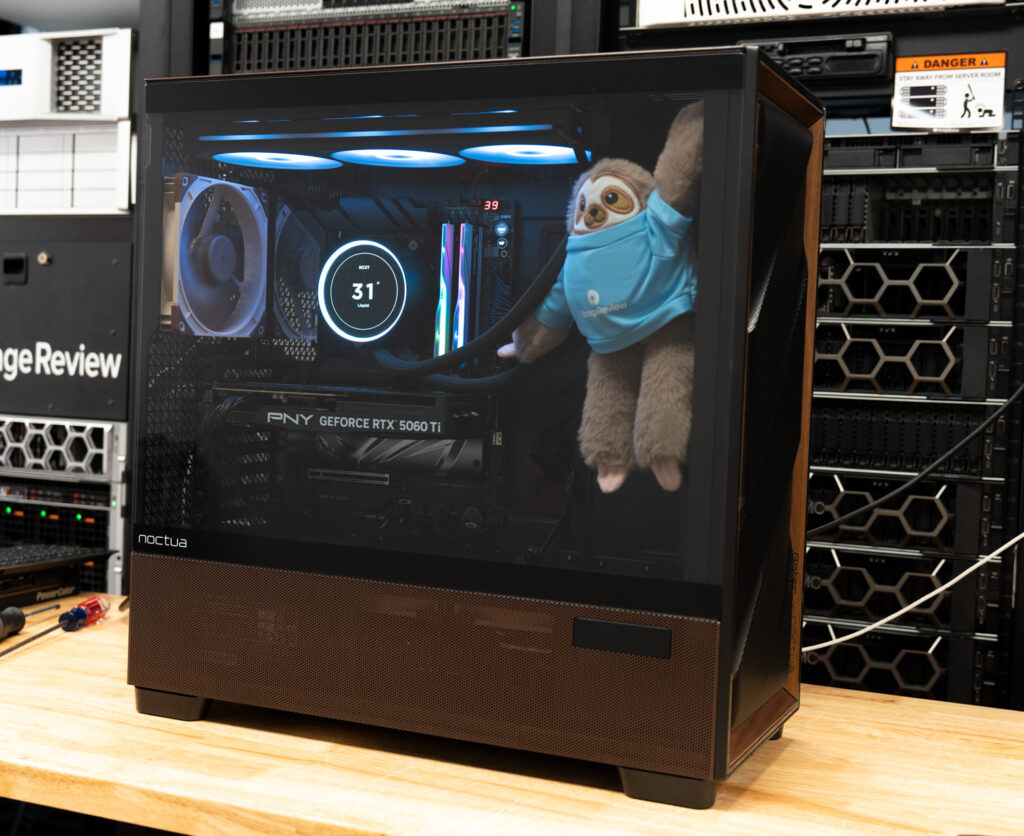
Antec Flux Pro Noctua Edition hero

While Noctua’s beige-brown color scheme can be polarizing, pairing it with walnut gives this case a warmer, more refined look than many might expect. The brown accents, silicone grommets, walnut front detail, and small Noctua logos give the chassis a more cohesive appearance than a typical branded collaboration. The walnut-accented color scheme looks fantastic, making this one of the few PC cases where the styling feels carefully considered rather than forced.

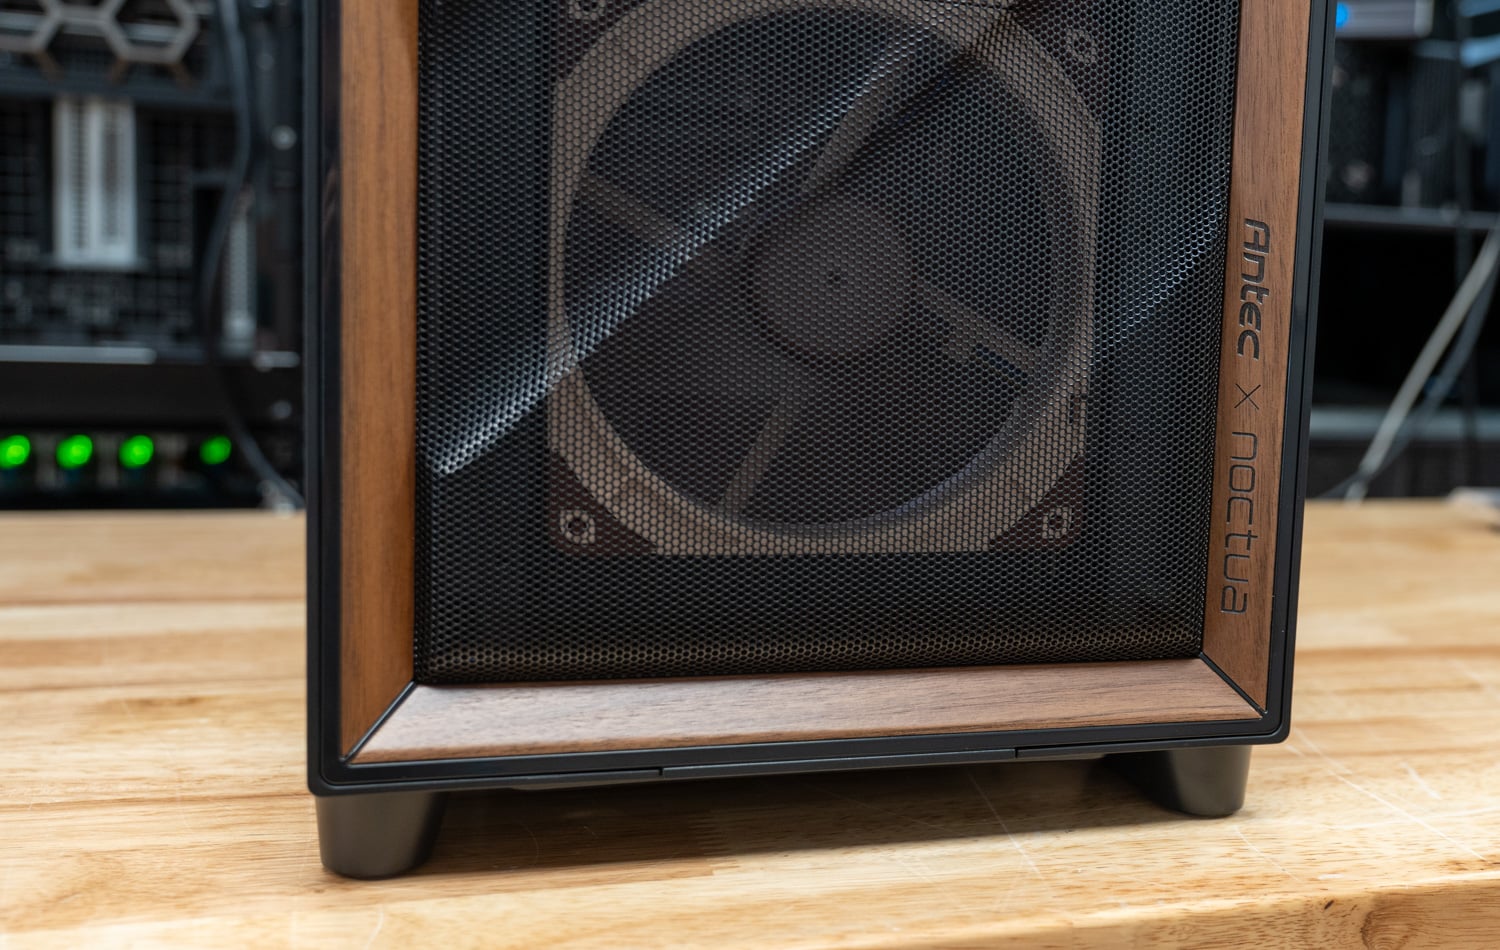
Antec Flux Pro Noctua Edition front grill

Aside from any cooler or components you add yourself, the Flux Pro Noctua Edition is very LED-neutral, so the look comes from the walnut trim, brown accents, and Noctua fans instead of a wall of RGB. It has a much calmer, more mature style that feels better suited for a creator build than a typical gaming case.

Antec also keeps the extensive ventilation layout the Flux Pro is already known for and adds Noctua’s NF-A14x25 G2 and NF-A12x25 G2 fans to reduce noise while maintaining similar airflow levels. The case is rated for up to an 8 dB(A) noise reduction compared with the standard version while keeping internal component temperatures similar, though actual results will depend on the hardware, fan curves, radiator placement, and room conditions. The adjacent fan speed offsets are also useful, as they are intended to reduce periodic humming and vibration caused by matching fan speeds.

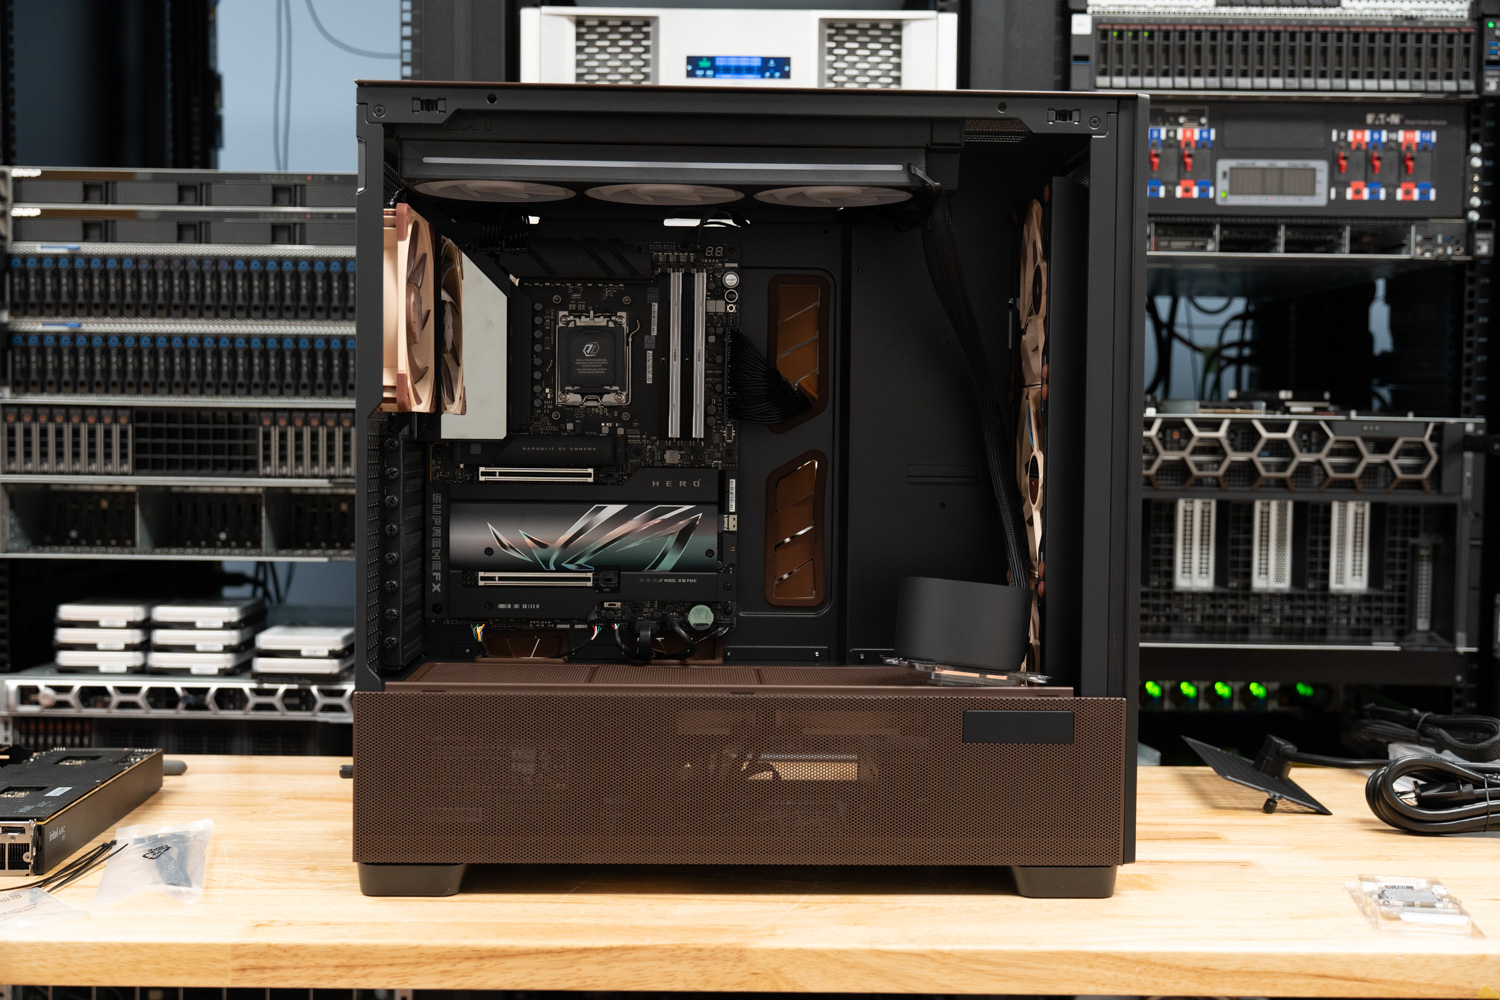
Antec Flux Pro Noctua Edition interior

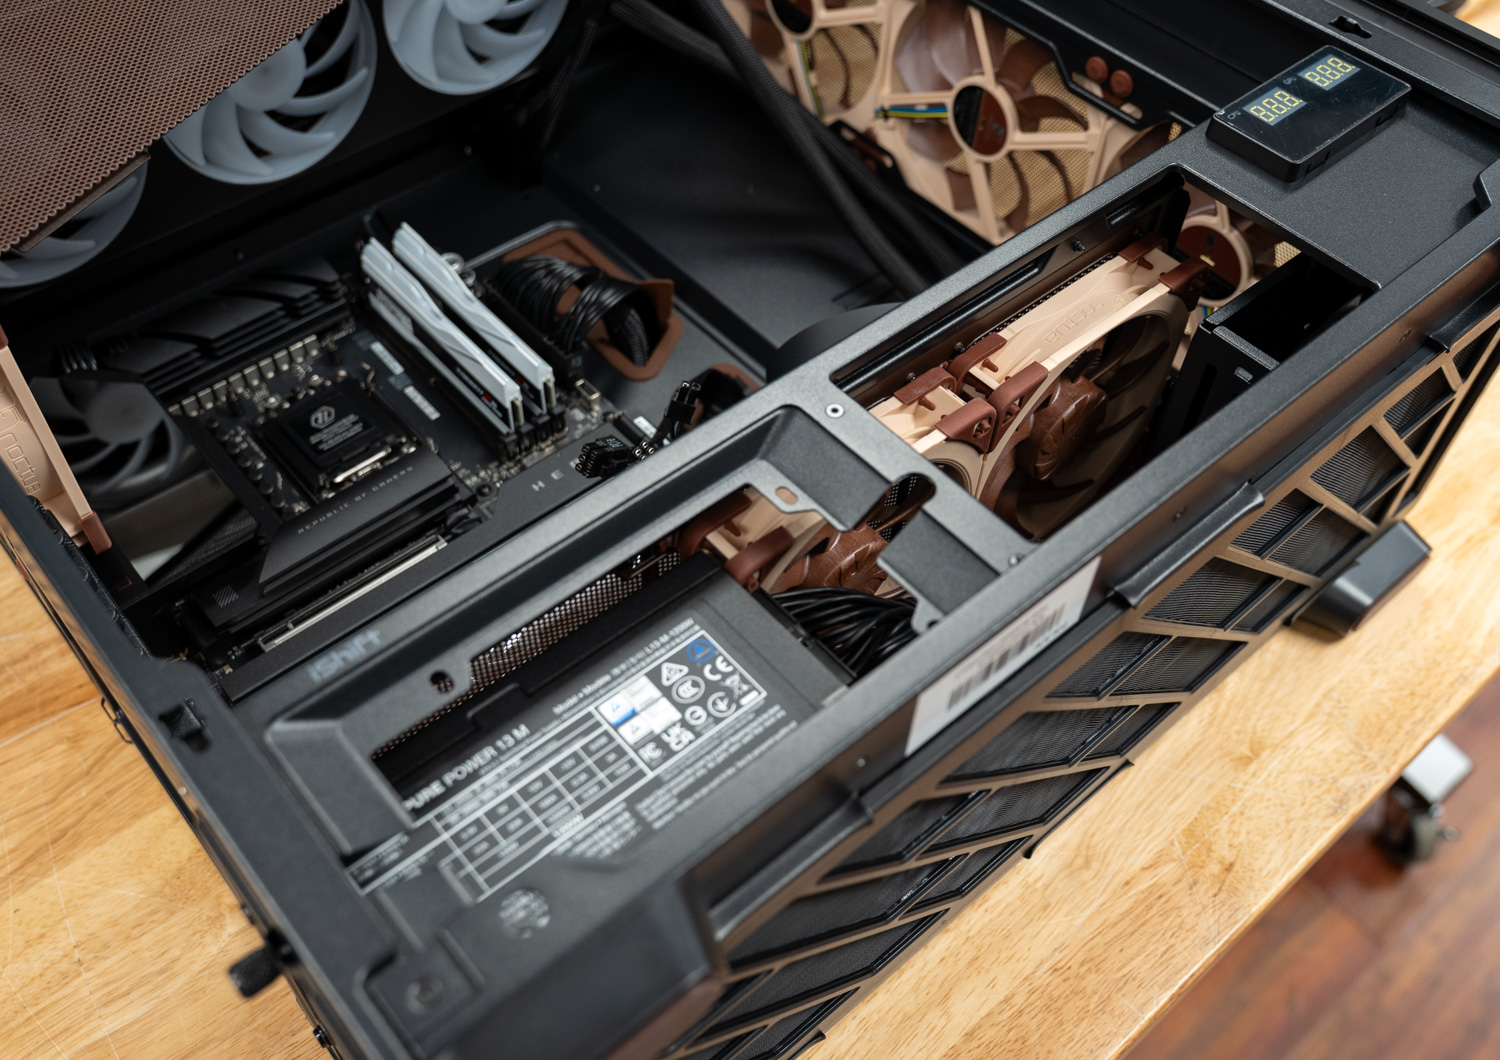
Besides the fan package, the case has several builder-friendly features that help justify its size and price. The NA-FH1 fan hub is pre-installed behind the right-side panel, and the fan cables come pre-routed, which should make setup less messy. The side and top panels are tool-free, the front and top fan brackets can be removed, and the case supports large hardware, including E-ATX motherboards, GPUs up to 455 mm, CPU coolers up to 190 mm, and 360 mm or 420 mm radiators at the front and top. There is also a small external temperature display, along with modular hard drive cages for builds that need extra 3.5-inch storage.

Antec Flux Pro Noctua Edition Ultra-Quiet PC Case Pricing and Warranty

At USD $399.90 (Amazon affiliate link), the Antec Flux Pro Noctua Edition is on the more expensive side, especially compared with the standard Flux Pro, so the value depends heavily on whether you were already planning to use Noctua’s higher-end fans and hub. The included fan package helps offset the overall cost, but it is still a premium chassis, not a budget-focused option. The case, supplied fans, and NA-FH1 fan hub are covered by a 6-year manufacturer’s warranty, with Noctua listing an MTTF rating of more than 150,000 hours for the included fans.

Antec Flux Pro Noctua Edition Ultra-Quiet PC Case Specifications

Specification Value
Physical Specifications
Dimensions 245x545x530 mm
Weight (with fans) 13.75 kg
Color Black, Brown
Compatibility
Motherboard form factors Mini-ITX, µATX, ATX, E-ATX
Max. CPU cooler height 190 mm
Max. PSU length without HDD 470 mm
Max. video card (GPU) length 455 mm
Cooling
Fan configuration 3x NF-A14x25 G2 PWM (front intake)
2x NF-A12x25 G2 PWM (PSU shroud intake)
1x NF-A14x25 G2 PWM (rear exhaust)
Supported radiator sizes Front: 120/​140/​240/​280/​360/​420 mm
Top: 120/​140/​240/​280/​360/​420 mm
Rear: 120/​140 mm
Bottom: 120/​240 mm
PSU cover: 120/​240/​360 mm
General
Warranty 6 years

Antec Flux Pro Noctua Edition Ultra-Quiet PC Case Design and Internals

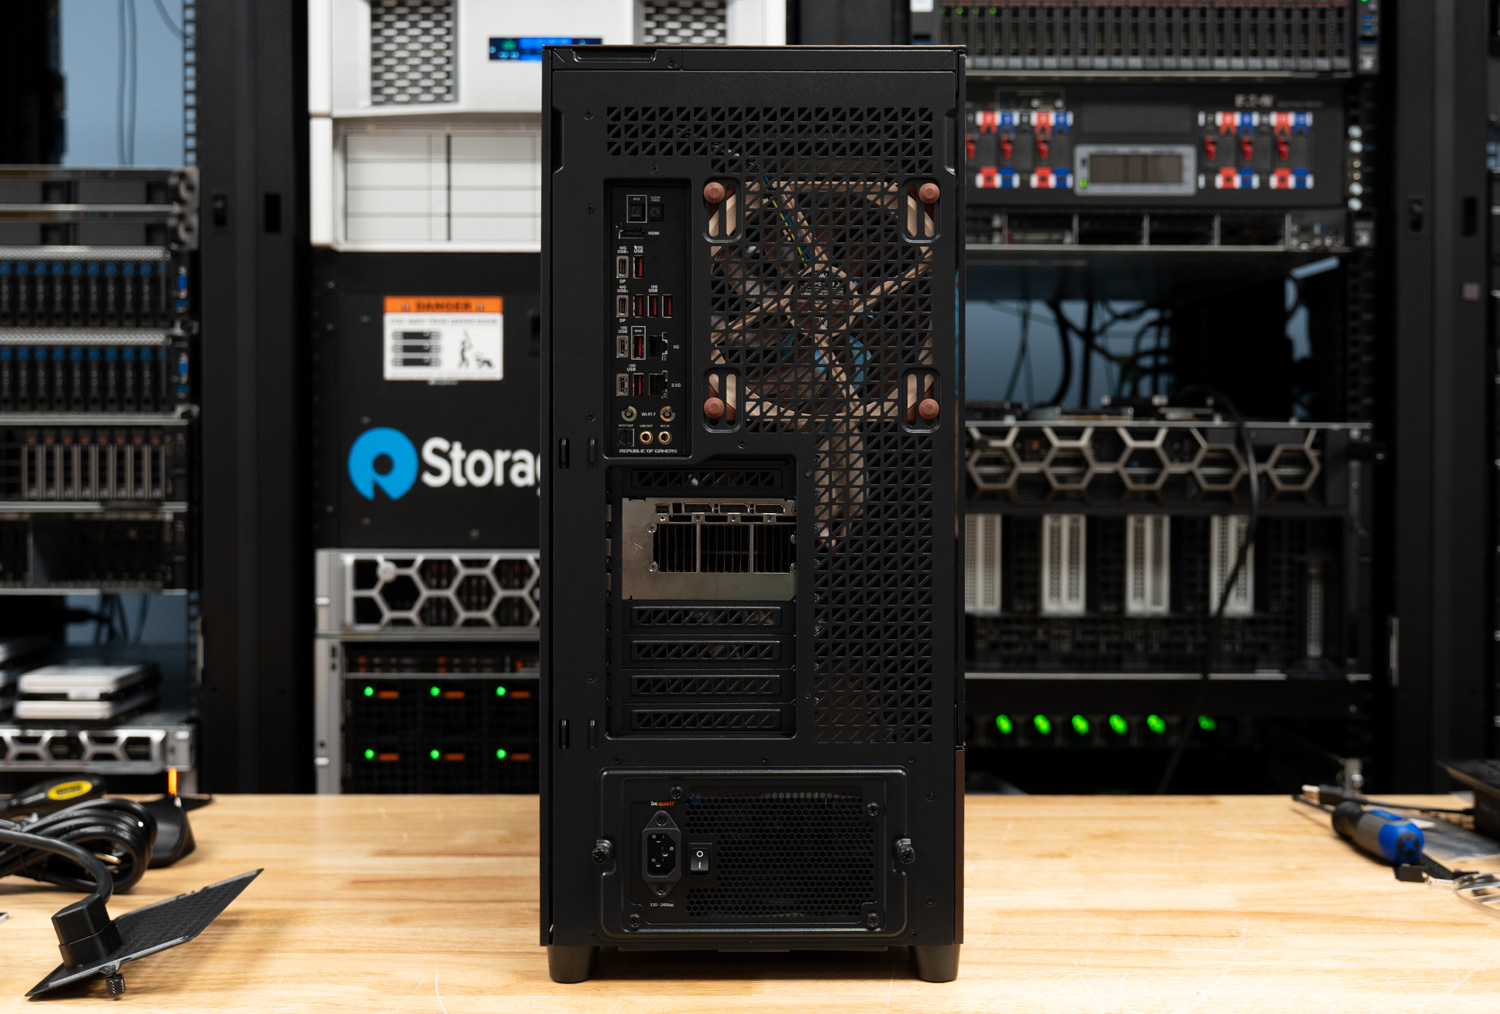
The Flux Pro is a full-tower chassis made from steel, plastic, tempered glass, and FSC-certified walnut wood accents. It measures 245 mm wide, 545 mm tall, and 530 mm deep, with a listed weight of 13.75 kg with the fans installed. It is a big case, and you notice that right away when lifting it or moving it around during the build. The 4 mm tempered glass side panel has a solid, secure fit, while the steel mesh panels have a sturdy feel that matches the chassis’s size and weight.

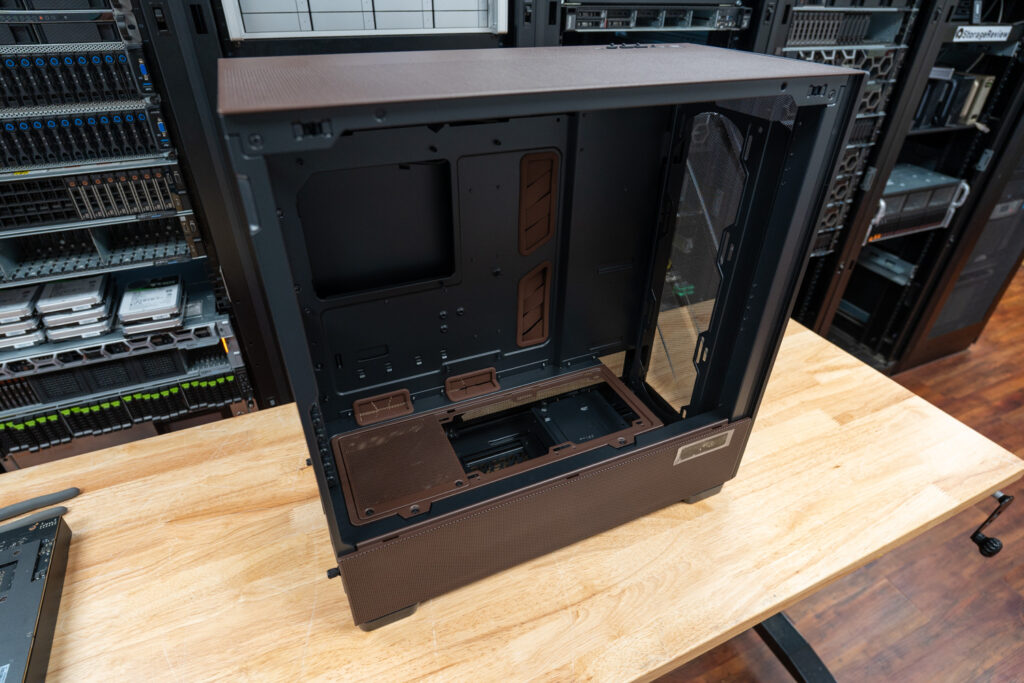
Antec Flux Pro Noctua internals

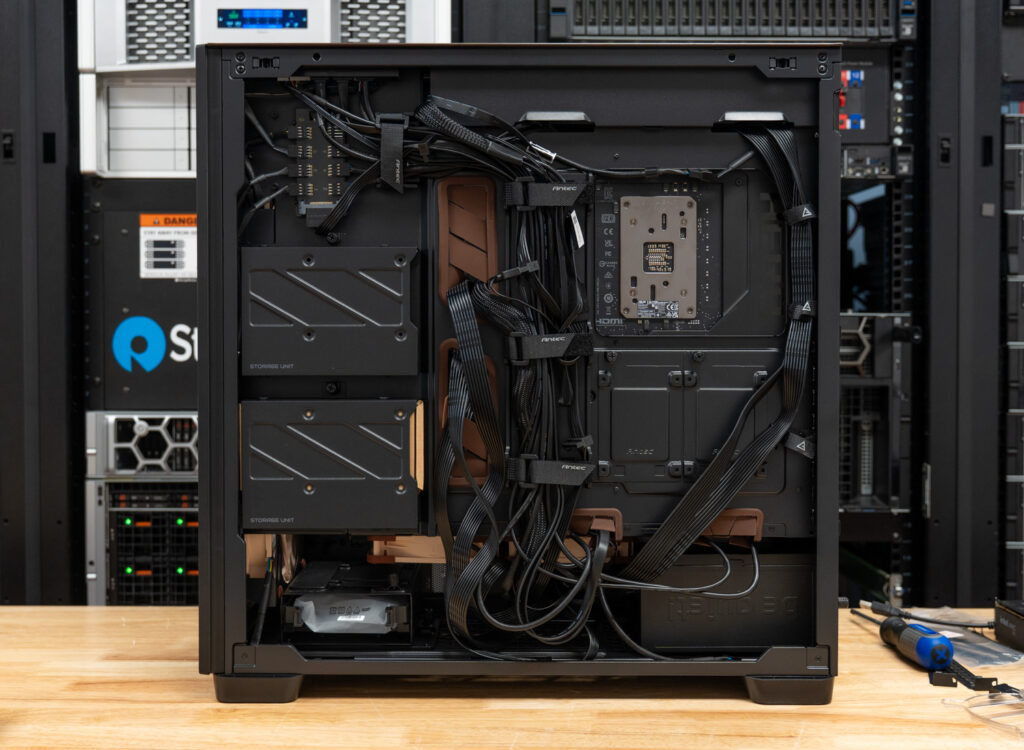
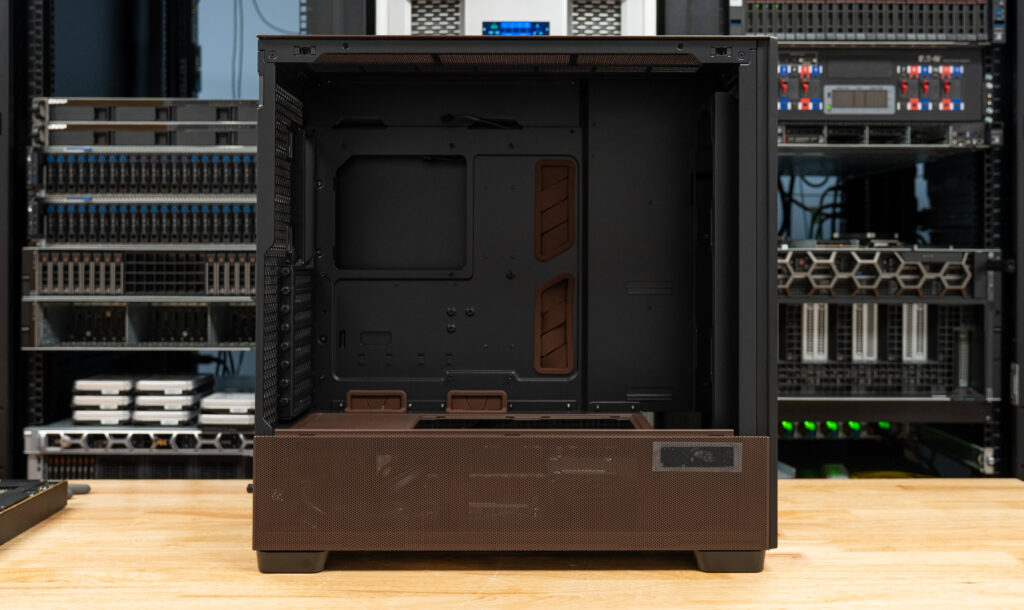
With the case empty, the Flux Pro shows how open the main chamber is before any hardware goes in. We liked that there is a lot of uninterrupted space around the motherboard tray, top radiator area, front intake section, and lower fan area, which should make the build process much easier when working with larger cooling hardware or a longer graphics card. The brown grommets also help break up the black interior while giving the cable pass-throughs a neater look. In addition, the wide routing cutouts made it simple to bring cables into the main chamber.


The top I/O area includes two USB 3.0 ports, one USB-C 10 Gbps port, a headphone and mic combo jack, and power and reset controls.

The front mesh panel attaches magnetically, so it comes off easily for cleaning, and the bottom dust filter should help keep the lower intake area from collecting too much buildup over time. Antec uses actual FSC-certified walnut for the trim, which really gives the case a more premium feel compared to the usual plastic or metal. The darker walnut tone works surprisingly well with Noctua’s beige and brown fans, giving the case a cozy, warmer look.

Antec Flux Pro Noctua Edition front panel

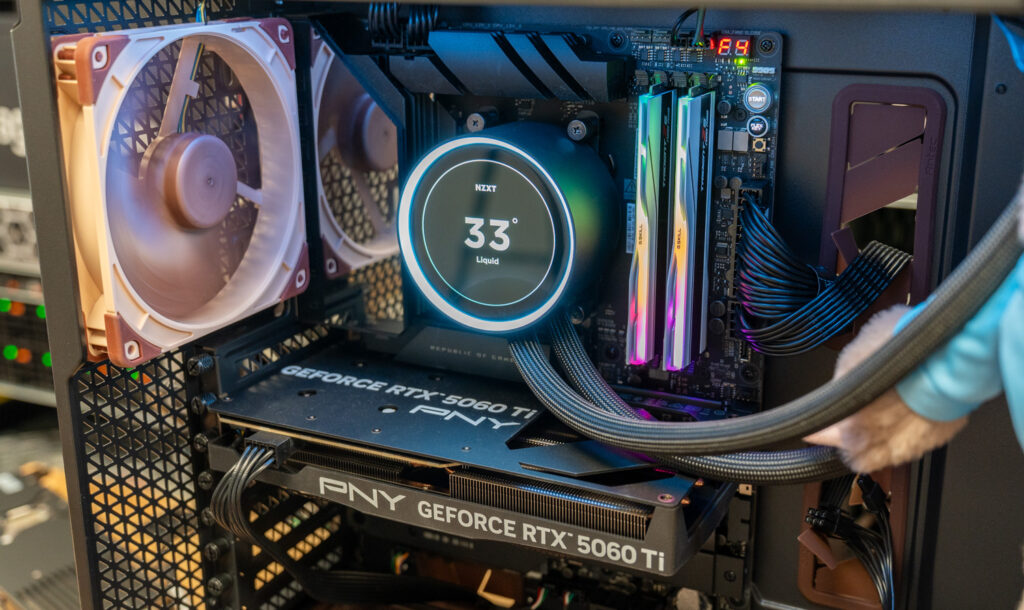
Once the system is fully assembled, the Flux Pro still leaves ample space around the main hardware. To show how spacious the interior is, we installed the motherboard, all six Noctua fans, an NZXT AIO, and a larger graphics card, which in this build was an RTX 5060 Ti. Even with that hardware in place, the system still looks open and organized. The rear chamber and pre-routed fan cables also make it fairly simple to hide most of the wiring, which helps keep the main component side tidy once everything is connected.

The NZXT Kraken AIO from the image below is not included with the case, but it helps illustrate how the Flux Pro looks with a full cooling setup installed.

The Flux Pro includes an external temperature display built into the case’s lower side panel. That readout can show CPU temperature, GPU temperature, or both through Antec’s iUnity software, giving users a quick way to check system thermals from outside the case. This can also be useful when an internal display, like the NZXT pump in this build, is facing away from you or is hard to see from your normal viewing angle.

Fan Configuration and Acoustic Engineering

The Noctua Edition includes six fans, packed separately from the case with paper inlays to help protect them during shipping. The setup uses three NF-A14x25 G2 PWM fans as front intake, two NF-A12x25 G2 PWM fans as lower intake above the PSU shroud, and one NF-A14x25 G2 PWM fan as rear exhaust. The fan set also includes different-speed variants, with PPA and PPB models used so that adjacent fans are not all spinning at the same speed.

 Antec Flux Pro Noctua Edition fansThe bundled fans use Noctua’s PPA and PPB speed-offset variants: the 140 mm fans are rated at 1475 and 1525 rpm, while the 120 mm fans run at 1750 and 1850 rpm. In this build, we used all six supplied fans, with the three 140 mm fans at the front, the two 120 mm fans as lower intake fans, and the final 140 mm fan at the rear as the exhaust. The NZXT radiator was mounted at the top as exhaust.

The offset fan speeds are meant to reduce unwanted acoustic effects, including periodic humming or vibration that can happen when several nearby fans operate at identical speeds. The three front intake fans follow a PPA-PPB-PPA layout, which matches Noctua’s recommended setup. For installation, Antec and Noctua include 36 NA-AV4 anti-vibration mounts, allowing the fans to be mounted without screws to reduce vibration transfer into the chassis. Matching NM-SFS1 fan screws are also included and are the safer option if the finished system will be shipped or moved often, since the rubber mounts trade some physical security for lower vibration.

During our testing, the Noctua fan setup was very stable, with no noticeable vibration, rattling, or low-frequency hum, while the fans moved a good amount of air through the chassis without making the system sound loud. Noise will still depend on your specific build, especially if you pair it with a more aggressive CPU cooler or run a faster fan curve, but the factory Noctua setup does a good job of maintaining high airflow without adding much noise.

Conclusion

The Antec Flux Pro Noctua Edition is best suited to a larger build where space, build quality, and low noise are high priorities. The interior gives you plenty of room for a larger graphics card, AIO cooling, multiple fans, and extra storage, while still leaving the finished system looking open and organized. The panels feel weighty and premium, access is very good, and the case gives you enough working room that the build does not feel cramped once all of your components are inside. The FSC-certified walnut trim gives the case a higher-end look that works surprisingly well with Noctua’s beige and brown color scheme.

Antec Flux Pro Noctua front panel

One thing we appreciated more as the build came together is how neutral the case looks without the usual RGB-heavy fan setup. Outside of the cooler we added for this build, the Flux Pro Noctua Edition does not rely on lighting to stand out; the Noctua fans keep the interior clean and almost calm, while the walnut trim does the visual work. It would be a great fit as a living room PC alongside mid-century furniture, especially given Noctua’s focus on low noise.

Cable management was one of the better areas of the build: The rear chamber gives you enough space to route and hide wiring, and the pre-routed fan cables help reduce some of the cleanup that usually comes with a fan-heavy case. Even with all six Noctua fans and an AIO installed, it was easy to keep most of the wiring out of sight, which keeps the main component side tidy.

The included Noctua fan package is the main difference from the standard Flux Pro, and it performed well during our testing. The fans remained stable and isolated, providing the chassis with plenty of airflow without noise. Noise can still vary depending on the CPU cooler, fan curve, and other system hardware, but the included Noctua setup provides quiet airflow out of the box. With its spacious interior, premium design, simple cable routing, and quiet factory fan setup, the Flux Pro Noctua Edition is a great fit for high-end builds where airflow and low noise are both priorities, and is great for those looking for a more mature, mellow design.

Noctua Podcast

Case at Amazon (affiliate link)

The post Antec Flux Pro Noctua Edition Review: Six G2 Fans and Walnut Trim for $399.90 appeared first on StorageReview.com.

HP ZGX Nano G1n AI Station Review: A Secure, Sustainable Desk-Side AI Node

The DGX Spark platform is familiar territory for us at this point. We’ve reviewed the Dell, ASUS, Acer, and Gigabyte takes on NVIDIA’s GB10 Grace Blackwell reference design, and the core ingredients are consistent across all of them: 1,000 TOPS of FP4 compute, 128GB of unified LPDDR5x memory, and dual 200GbE networking in a 150mm chassis. HP’s ZGX Nano G1n AI Station builds on that foundation, but the way HP has built around it sets this unit apart from the rest of the Spark field.

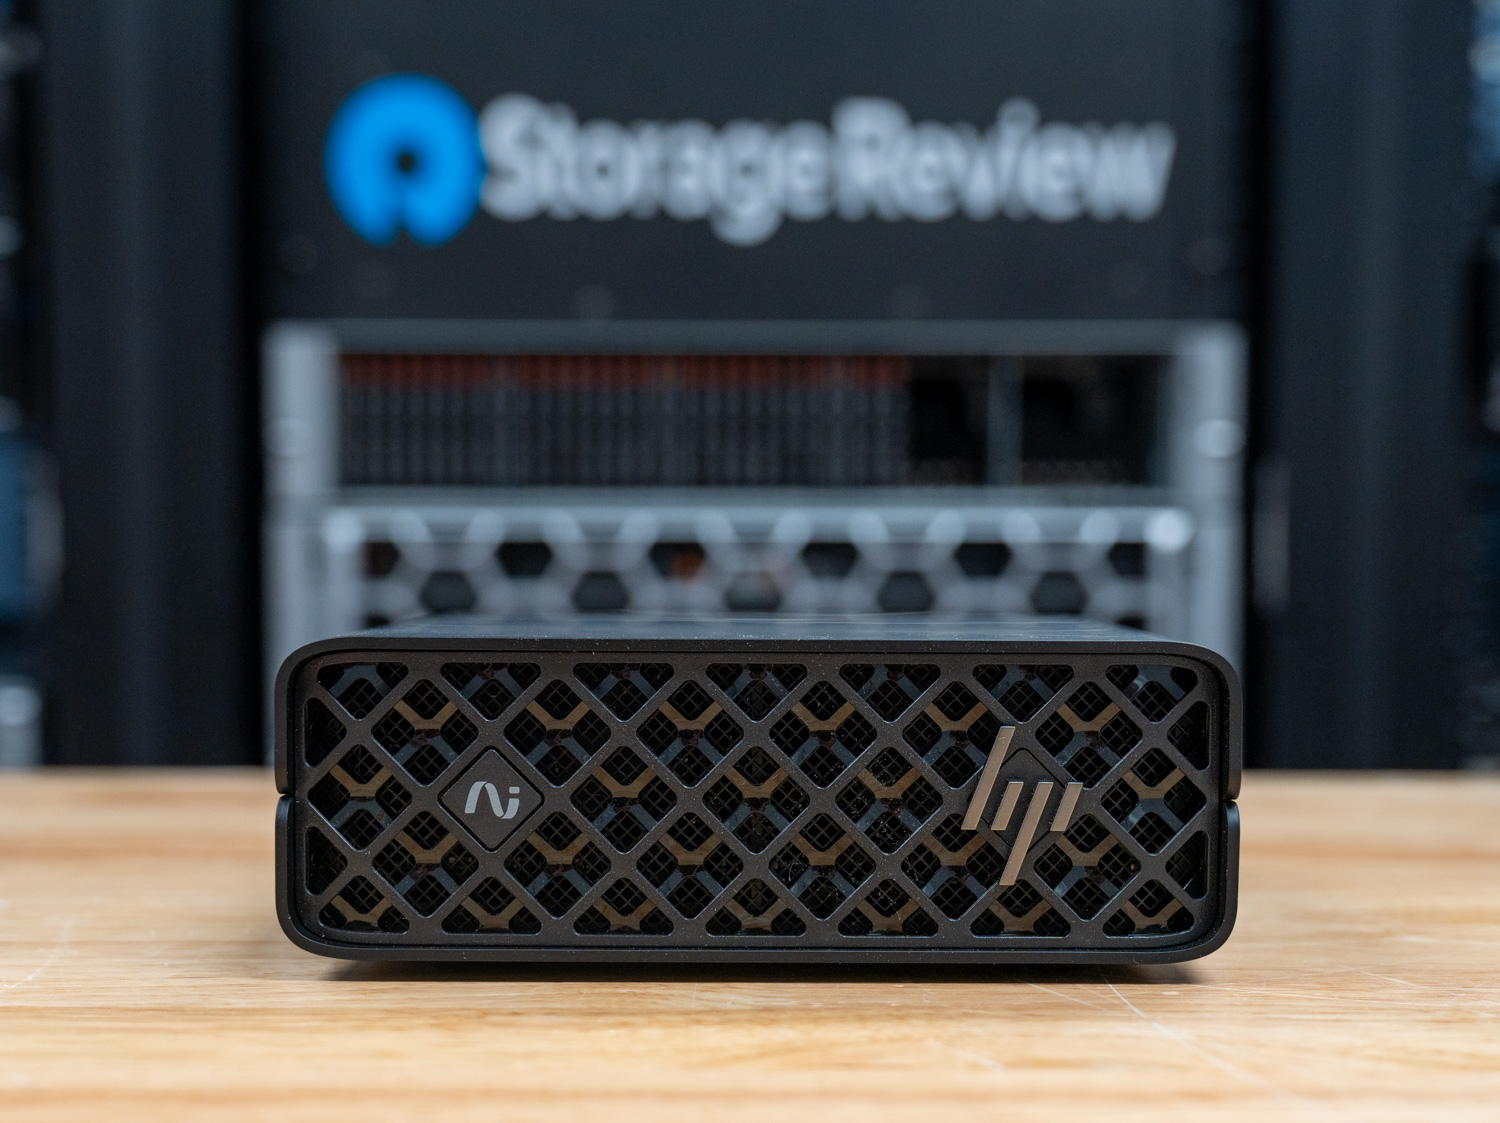
HP ZGX Nano G1n front bezel

The most visible differences are in materials and construction. HP wraps the ZGX Nano in a chassis built from up to 75% recycled aluminum and 20% recycled steel, with packaging that carries up to 93% recycled content. The internal layout splits the chassis into upper and lower halves, making it easier to access components like the SSD and coin-cell battery than on several of the Spark units we’ve tested. Thermally, HP rates the system at 22 dBA idle and 27.6 dBA under intensive workloads, quiet for a system dissipating approximately 780 BTU/hr at peak.

Security is where HP pushes furthest past the reference platform. The ZGX Nano ships with TPM 2.0 operating in FIPS 140-2 certified mode, meets Common Criteria EAL4+, and includes BIOS-level secure boot and PXE controls. Storage is factory-installed as a self-encrypting OPAL NVMe drive. Taken together, HP is positioning this unit not only as a developer desk-side AI node but also as a system that can operate within regulated environments where supply chain certifications, encryption at rest, and tamper resistance matter for procurement.

Specification HP ZGX Nano G1n AI Station
Overview
Product Name HP ZGX Nano G1n AI Station
Form Factor Mini
Operating System NVIDIA DGX OS 7 / Ubuntu 24.04
NOTE: This product does not support Microsoft Windows.
Hardware
Processor NVIDIA GB10 Grace Blackwell Superchip
Blackwell Architecture GPU
20-core Arm CPU (10x Cortex-X925 + 10x Cortex-A725)
Blackwell CUDA Cores
5th Gen Tensor Cores
4th Gen RT Cores
1x NVENC
1x NVDEC
Memory 128GB LPDDR5x, unified, 16 channels, soldered
Memory Bandwidth 273 GB/s
Storage (Internal I/O) 1x M.2 PCIe Gen5 x4
Options: 2TB or 4TB PCIe Gen4 x4 NVMe (2242, SED OPAL TLC)
Networking & I/O
Rear I/O Ports 1x USB-C power (240W)
3x USB-C 20Gbps (DisplayPort 1.4a, 30W total)
1x HDMI 2.1a
1x 10GbE RJ-45
2x QSFP 200GbE (ConnectX-7)
Network Controllers Realtek RTL8127-CG 10GbE
NVIDIA ConnectX-7 200GbE
WLAN & Bluetooth AzureWave AW-EM637
Wi-Fi 7 + Bluetooth 5.4
Performance
AI Compute Up to 1,000 TOPS (FP4)
Model Capacity Up to 200B parameters
Physical & Power
Dimensions (H x W x D) 2.01″ (no feet) / 2.1″ (with feet)
5.9″ x 5.9″
Weight Starting at 1.25kg (2.76 lbs)
Power Supply 240W USB-C external adapter, 89% efficiency, active PFC

Build and Design

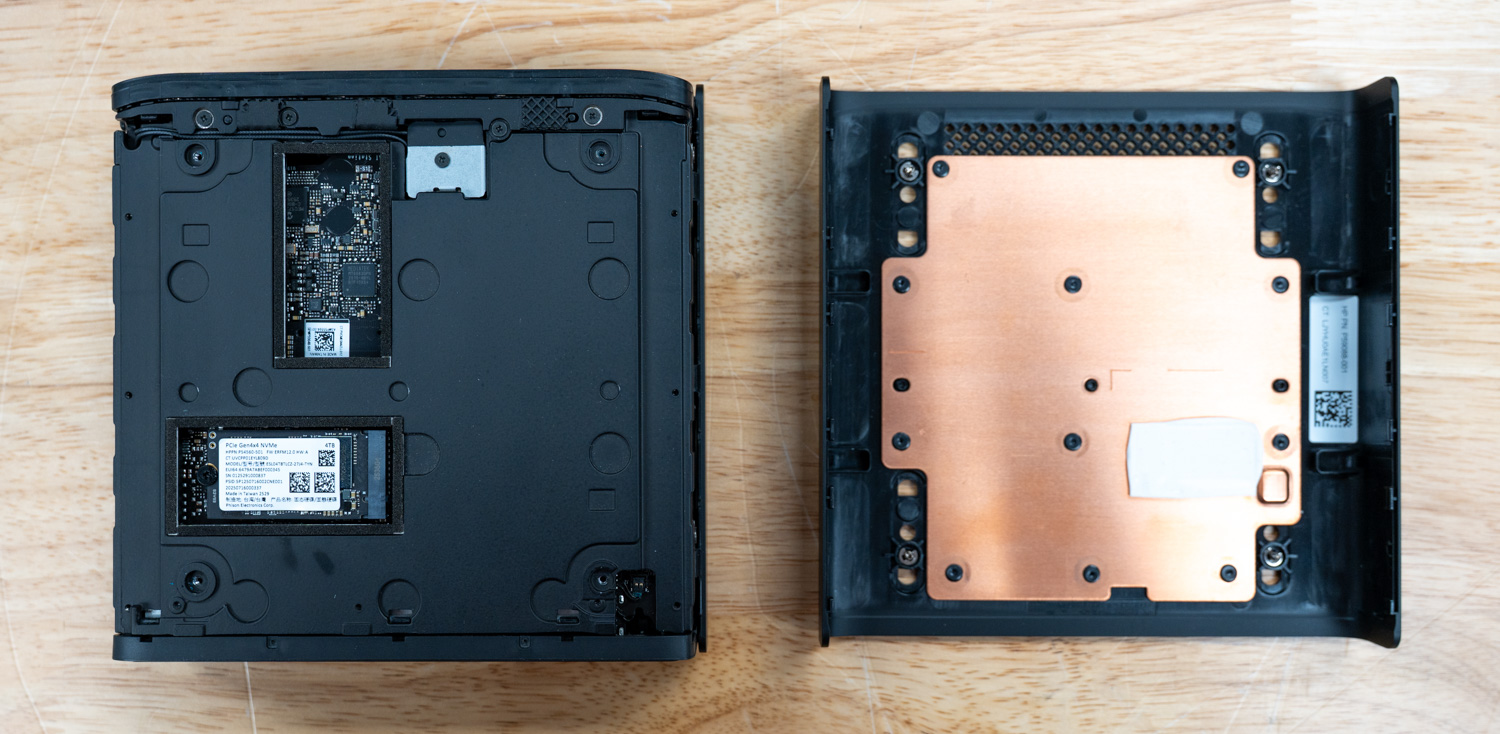
The HP ZGX Nano G1n takes a noticeably different approach to the DGX Spark design compared with the other systems we have looked at so far (see our Dell/ASUS/Acer/Gigabyte reviews). Instead of the more common build, where the internals feel tucked into a top cover, HP splits the chassis into upper and lower halves, making the internal layout easier to understand once inside. What first appears more complicated turns out to be fairly practical, with straightforward access to parts like the coin-cell battery and SSD after removing just a handful of screws. That more considered internal structure also carries over to the outer build, where HP places greater emphasis on how the system is constructed and the materials used throughout.

That said, HP wraps it in a sleek black case with a 150mm-square footprint and relies heavily on recycled materials. Specifically, the build uses up to 75% recycled aluminum, 20% recycled steel, and significant amounts of post-consumer recycled plastics. Even the packaging reflects this commitment. Corrugated materials contain up to 93% recycled content, and plastic packaging incorporates at least 30% recycled content.

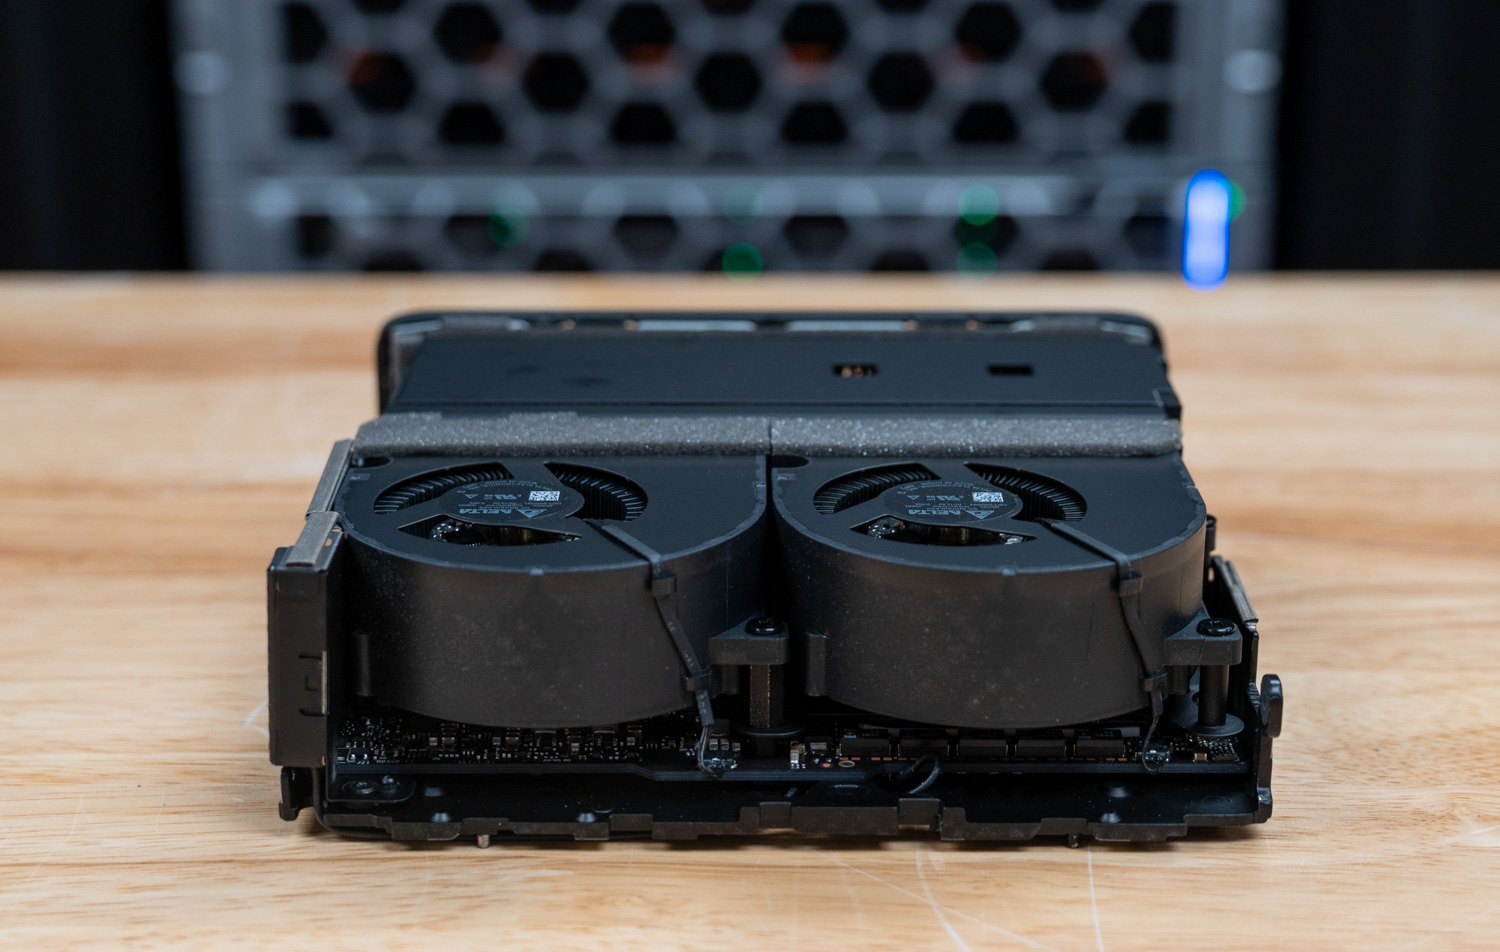
Thermally, the system relies on forced-air cooling. This is a notable engineering choice given the density of the NVIDIA GB10 Grace Blackwell Superchip. Despite its compact footprint, HP specifies a full thermal envelope. Under maximum load, the system dissipates up to approximately 780 BTU/hr, depending on configuration. Peak system power draw reaches approximately 228W. Furthermore, HP advertises relatively low noise levels, rated at 22 dBA at idle and 27.6 dBA under intensive workloads.

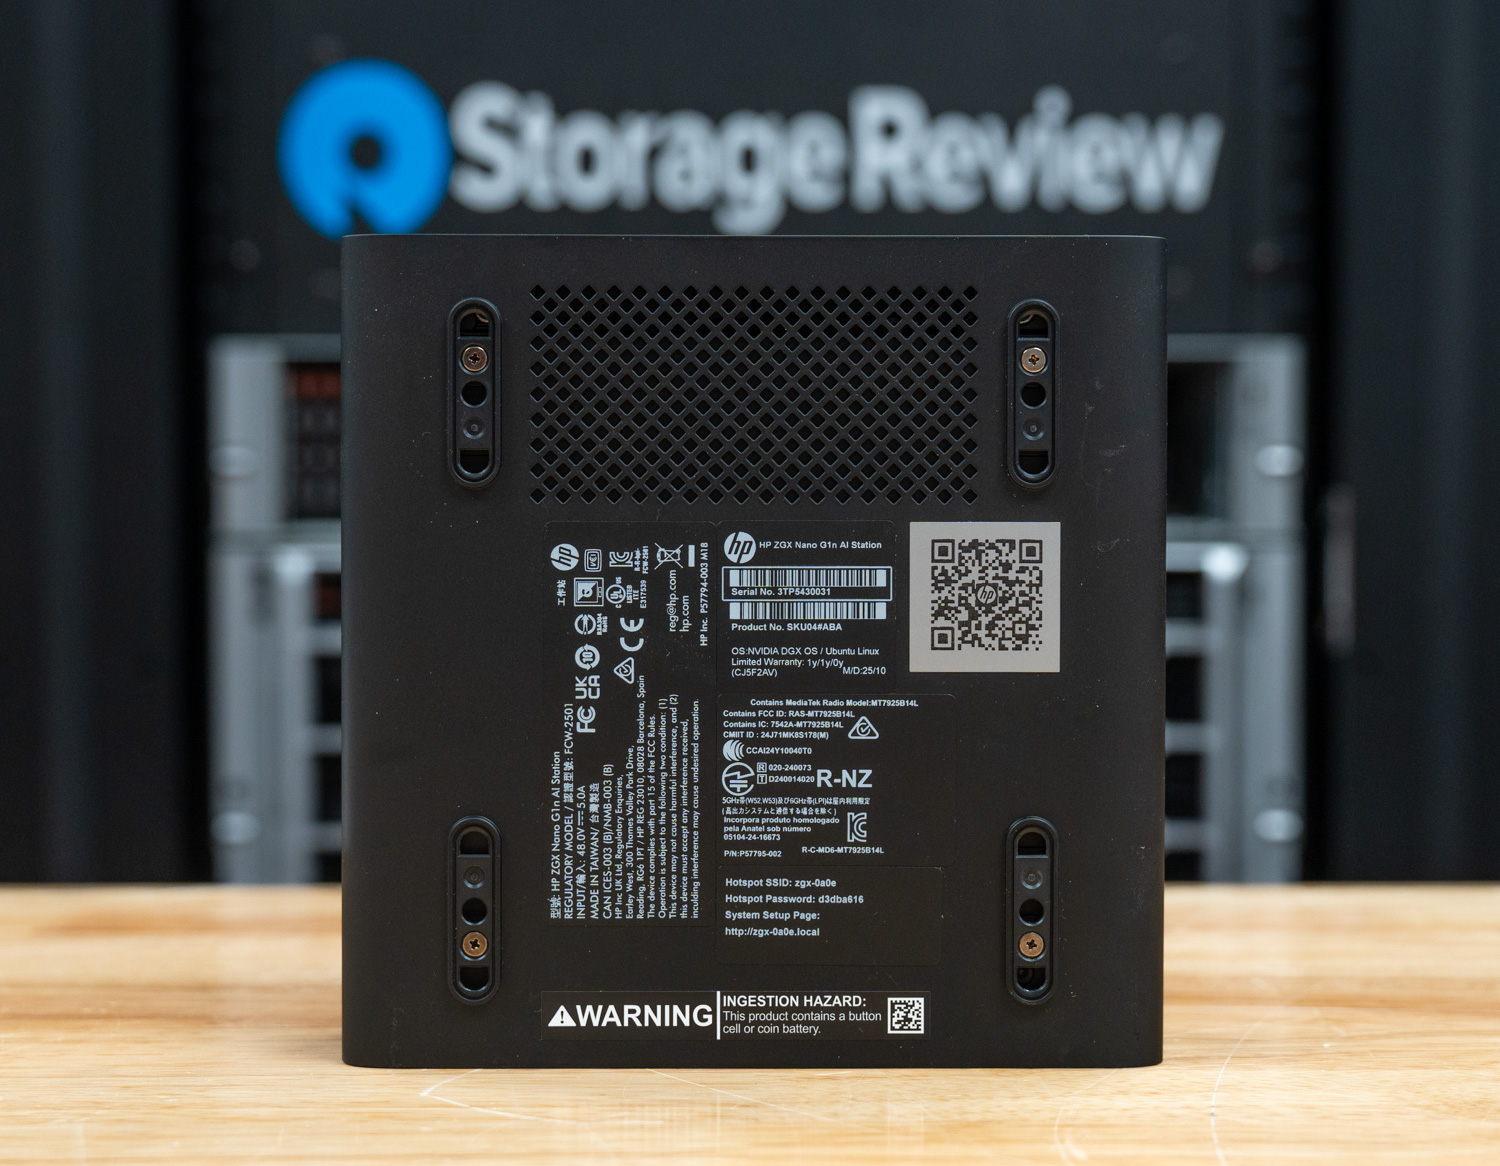
HP ZGX Nano G1n bottom

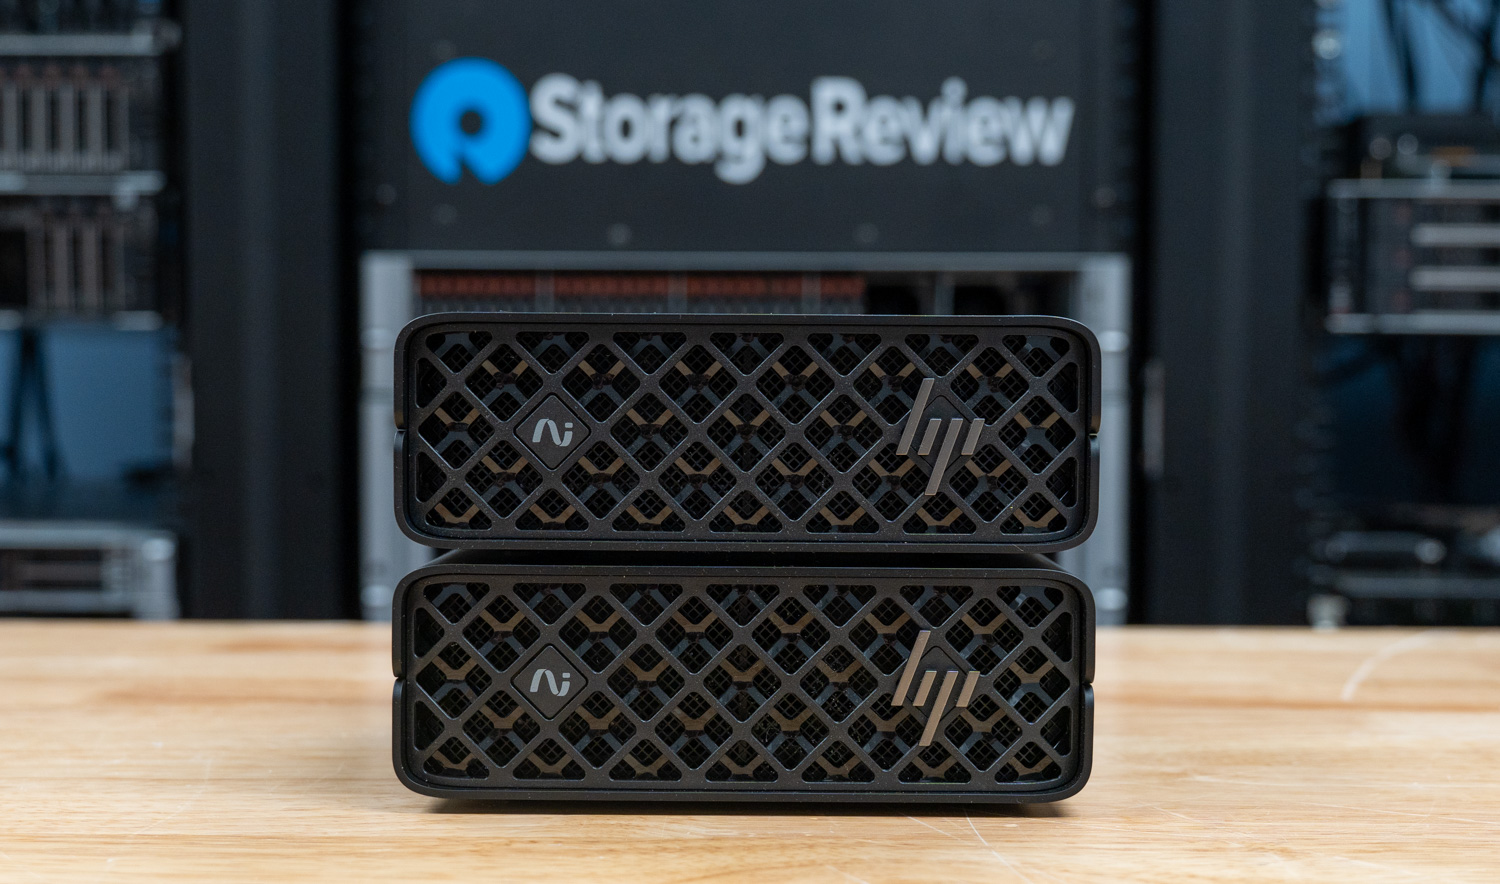
Physically, the unit measures 5.9 x 5.9 x 2.01 inches without feet, firmly placing it in ultra-compact territory. HP explicitly states that the unit is not rack-mountable, reinforcing its role as a desk-side AI node rather than traditional data center infrastructure. Serviceability is minimal by design. Users need a #1 Phillips screwdriver to access internal components, and most components, including memory, are non-user-replaceable.

HP ZGX Nano G1n internal fan section

Internally, the ZGX Nano uses NVIDIA’s reference board design, as do many other OEMs building on the DGX Spark platform. The LPDDR5x memory is soldered directly to the board and runs at up to 8533 MHz. Overall, the platform prioritizes efficiency and density over modularity.

Security and Upgradability

HP locks down the ZGX Nano G1n by design. It features an integrated TPM 2.0 module that operates in FIPS 140-2-certified mode, meets Trusted Computing Group specifications, and is Common Criteria EAL4+ certified. BIOS-level protections include secure boot controls, PXE-based remote boot capabilities, and the ability to disable boot from removable media entirely.

HP ZGX Nano G1n with bottom cover off

From a hardware standpoint, HP is explicit: this system is not upgradeable. The 128GB of LPDDR5x unified memory sits soldered directly to the board. Additionally, buyers must select storage at the time of purchase. While the single M.2 slot supports PCIe Gen5 x4 electrically, factory configurations ship with PCIe Gen4 x4 NVMe SSDs. These come in 2TB or 4TB capacities and are all self-encrypting OPAL drives.

HP notes that spare parts will remain available for up to five years after production ends. Nevertheless, this is fundamentally an appliance-style system rather than a modular workstation.

I/O and Expansion

The front of the unit is minimalist, featuring only a power button and a status LED. On the back, the system offers a dense array of high-performance connectivity options. HP delivers power via a standard NVIDIA-recommended 240W USB-C adapter and warns that third-party adapters may cause degraded performance or instability.

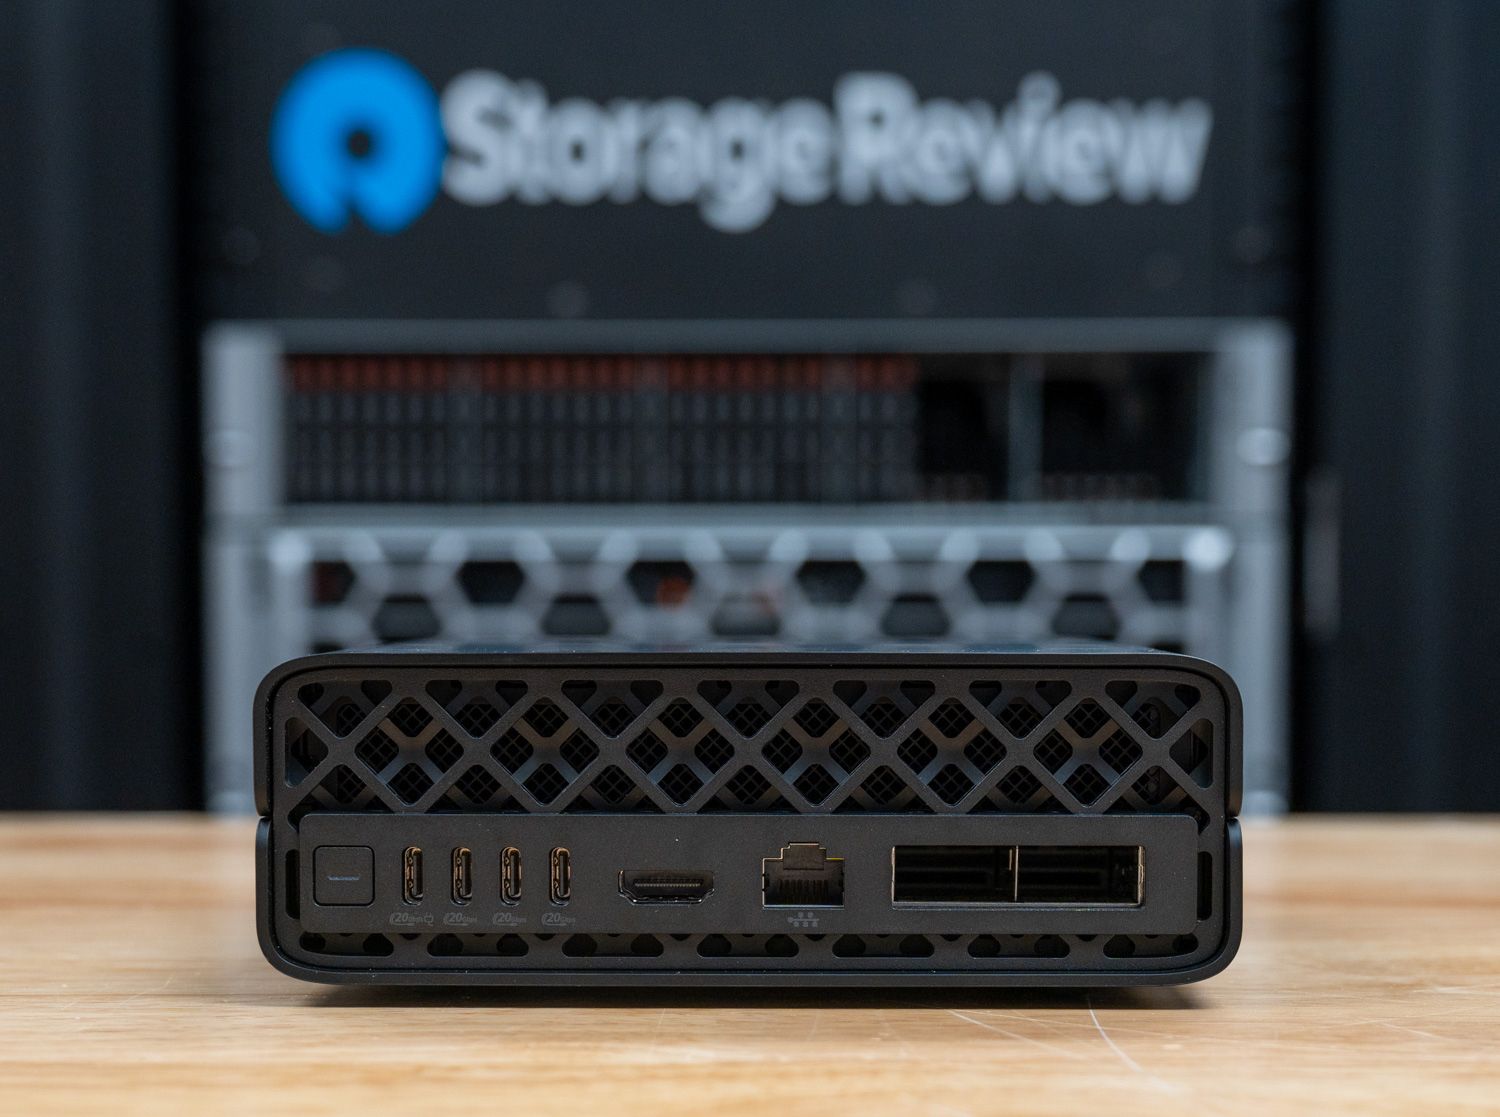
HP ZGX Nano G1n rear ports and connectivity

Three USB 3.2 Type-C ports provide USB connectivity, each operating at 20 Gbps and supporting DisplayPort 1.4a Alt Mode. A dedicated HDMI 2.1a port provides additional display output. For networking, the system includes both a Realtek RTL8127-CG 10GbE controller and an NVIDIA ConnectX-7 controller, providing dual 200GbE QSFP112 ports, each with 200 Gbps throughput.

The networking stack supports a wide range of enterprise features. These include PXE boot, Wake-on-LAN, VLAN tagging (802.1Q), time synchronization (802.1as/1588), and full-duplex operation across all supported speeds. Additionally, a Wi-Fi 7 (802.11be) 2×2 module with Bluetooth 5.4 provides wireless connectivity and supports MU-MIMO, WPA3 security, and operation across the 2.4GHz, 5GHz, and 6GHz bands.

Graphics and Audio

The integrated NVIDIA Blackwell GPU in the GB10 Superchip handles all graphics tasks. The system supports up to 8K output at 60Hz via USB-C DisplayPort 1.4a and 8K at 30Hz via HDMI 2.1a. HP recommends using direct cable connections for 8K output, as adapters or docks may cause instability or degrade signal quality.

Audio runs over HDMI, with no dedicated analog audio outputs. This aligns with the system’s positioning as a compute node rather than a traditional multimedia workstation.

Thermals Testing

CPU Temperature

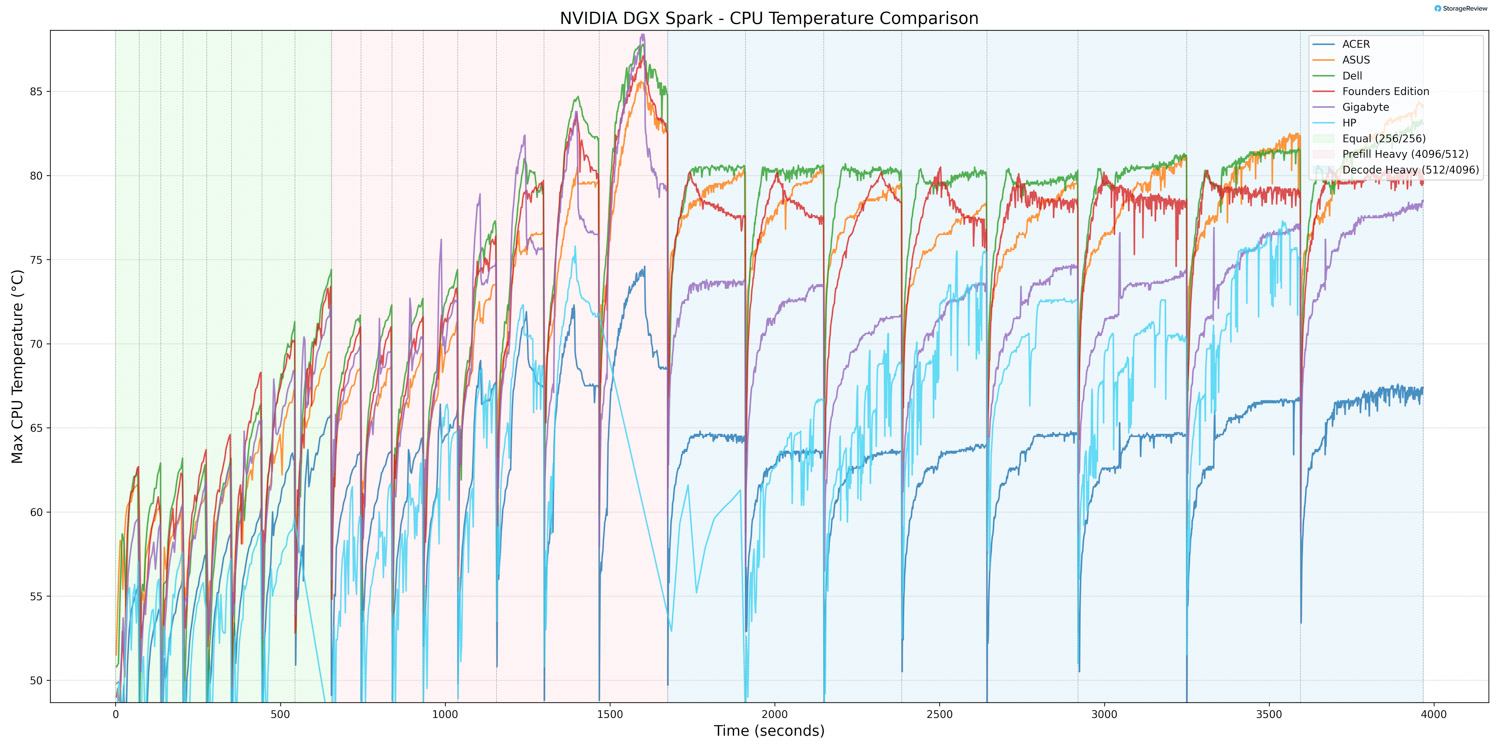
During CPU thermal testing, the HP ZGX Nano G1n reached a peak temperature of 77.3°C during the workload’s more intense bursts. This places HP below the hottest systems in the comparison stack during peak transitions, as other units climbed into the 90°C range. As the workload transitioned into Equal ISL/OSL and then Decode Heavy, CPU temperatures stabilized rather than continuing to rise sharply.

At the lower end, the CPU recorded a minimum temperature of 36.4°C during light-load conditions. This means the HP has effective heat dissipation when the system is not under heavier computational stress. Overall, the ZGX demonstrated controlled burst CPU thermal behavior with stable sustained-load performance.


GPU Temperature

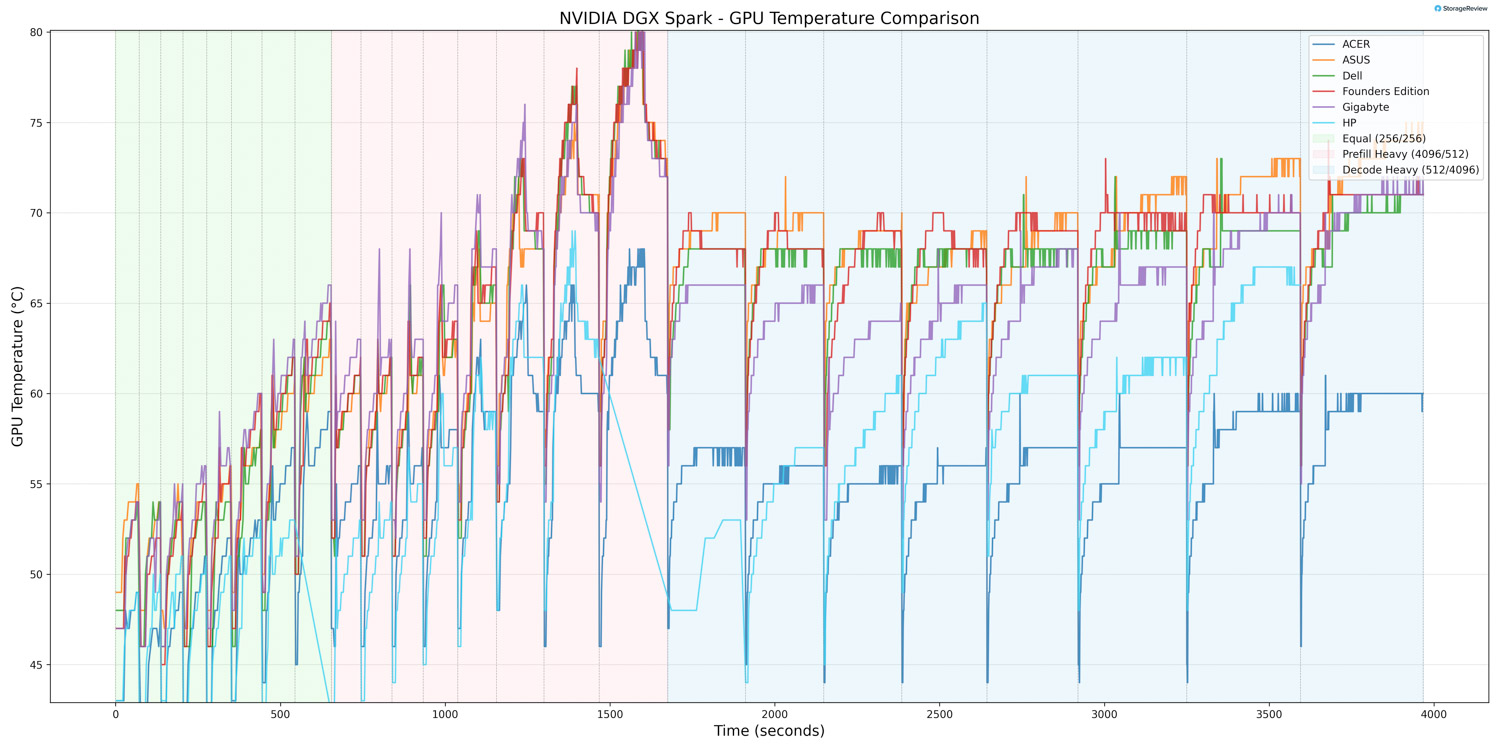
GPU thermals followed a similar pattern. During periods of heavy acceleration, the GPU reached a maximum temperature of 69°C. This positions HP on the cooler side of the comparables during peak burst conditions, with several other systems (like the Dell, ASUS, and Founders Edition) running noticeably warmer at the top end. As activity shifted into Equal ISL/OSL and Decode Heavy phases, GPU temperatures leveled off and remained stable.

The GPU recorded a minimum temperature of 34°C during lighter phases, indicating solid idle thermal capabilities.

NVMe Temperature

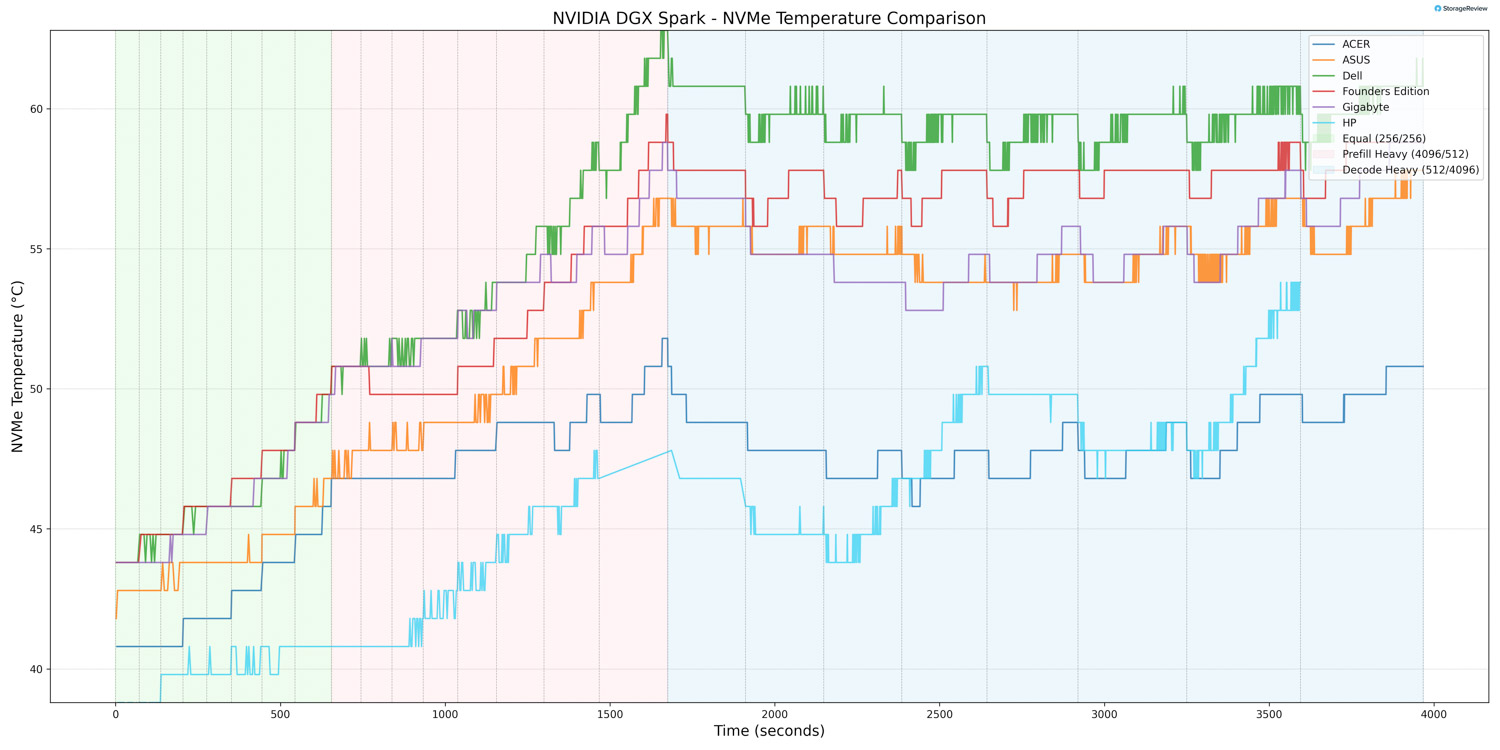
During the Equal phase, the NVMe drive reached roughly 42°C, showing only a gradual rise from its resting baseline. As the workload shifted to Prefill Heavy, the storage temperature rose noticeably, ranging from 42°C to 47°C. In Decode Heavy, the drive operated in its warmest range, 47°C to 54°C, where it peaked, yet remained noticeably below most other Spark systems.

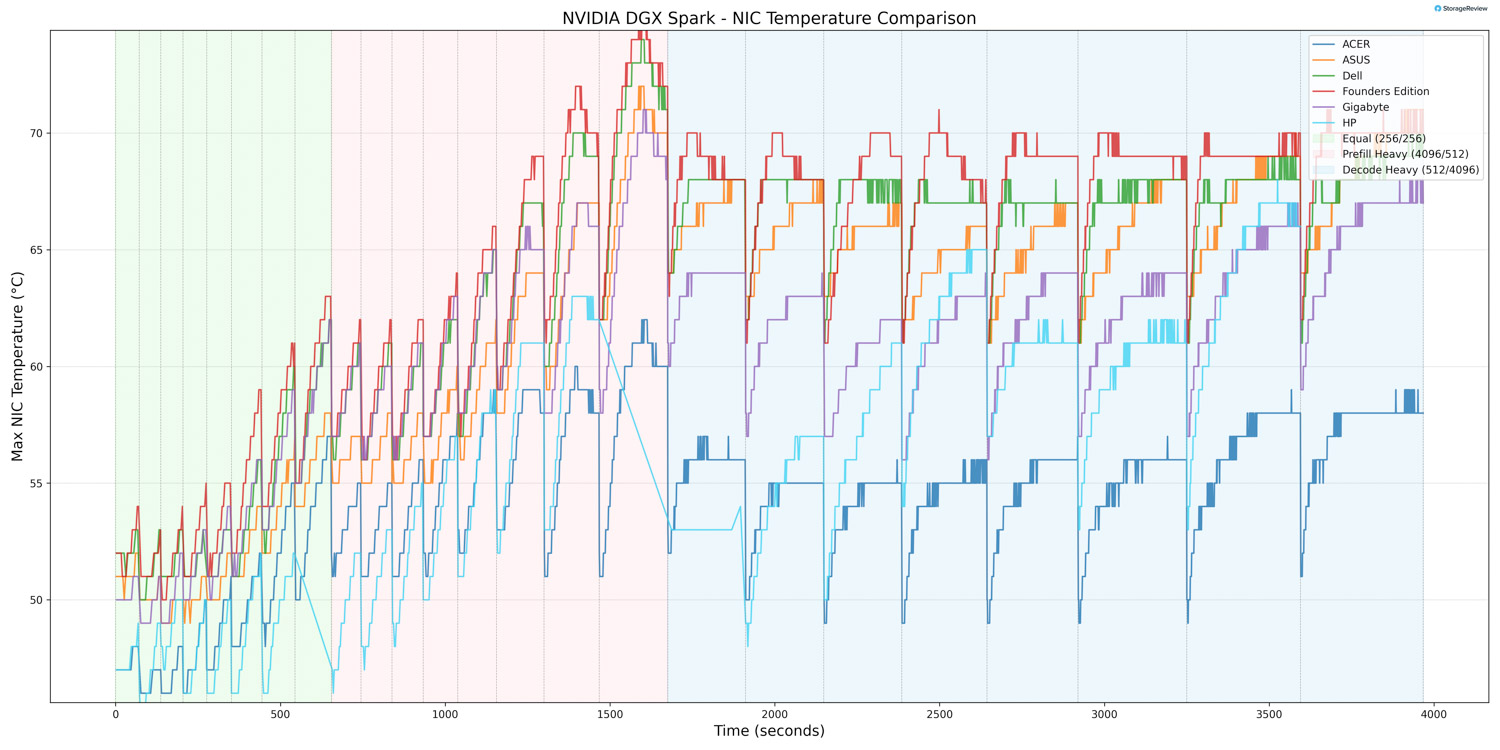
NIC Temperature

During the Equal phase, NIC temperature ranged from 39°C to 52°C, showing a steady climb, indicating moderate thermal buildup as network activity ramps up early in the run.

In Prefill Heavy, NIC thermals increased, ranging from 48°C to 64°C, because this phase places much more sustained pressure on the networking subsystem. During Decode Heavy, NIC temperature was in its warmest range, 52°C to 68°C, where the peak was reached. Nonetheless, thermal behavior remained stable throughout the test.

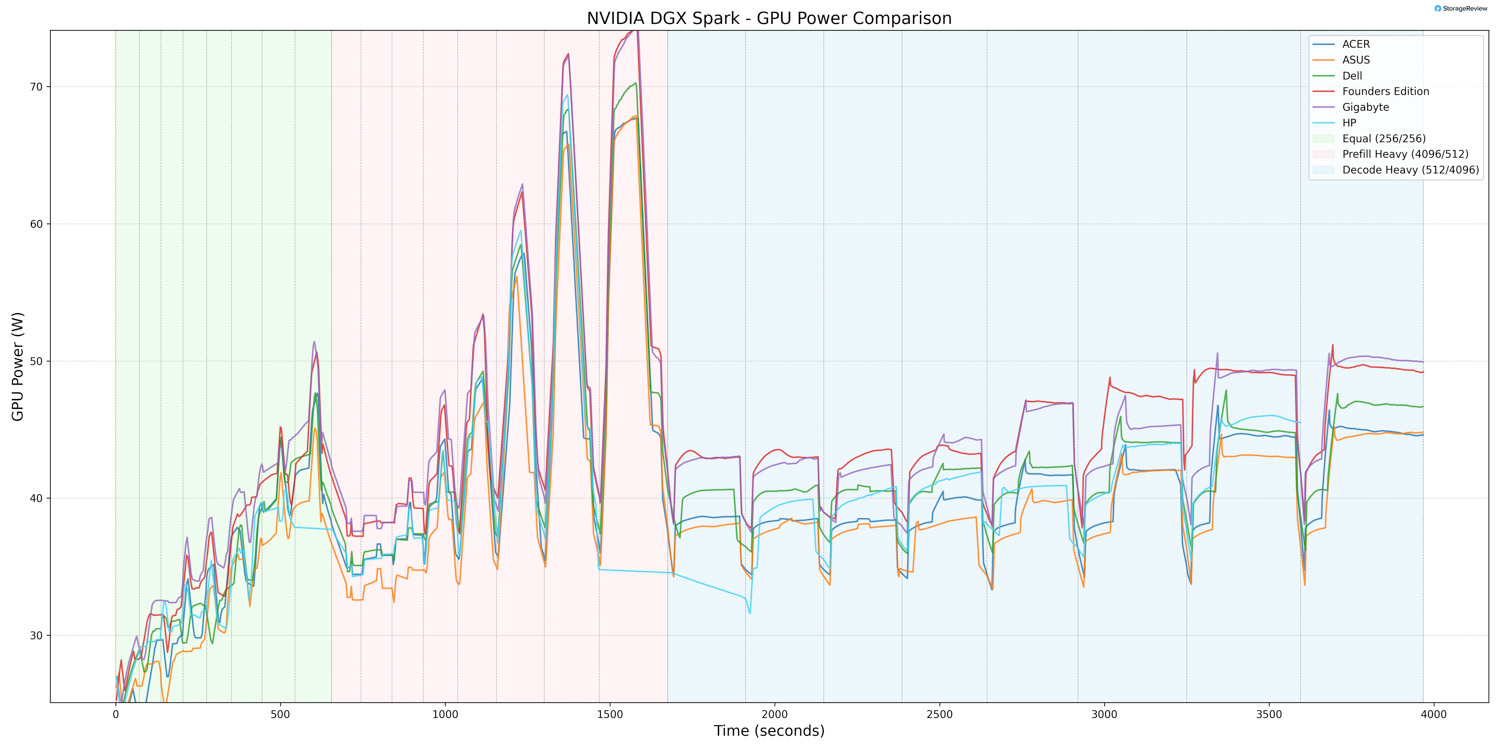
GPU Power Consumption

During the Equal phase, GPU power consumption ranged from 2.86W to just over 40W, placing the HP ZGX Nano G1n in the middle of the pack.

In Prefill Heavy, GPU power started at roughly 37W, dipped to as low as 35W, and spiked to as high as 69W, making this the most power-intensive phase of the run.

During Decode Heavy, GPU power consumption settled into a lower, more stable range of 35W to 46W, indicating that power demand eased as the workload shifted away from the more aggressive burst behavior.

Thermal Summary

Under load, the ZGX Nano G1n operates within a tightly controlled thermal envelope. Maximum system power consumption is approximately 228W, and heat dissipation is approximately 780 BTU/hr. By contrast, idle power draw remains low at approximately 36–38W, which indicates efficient power scaling when the system is not active. The forced-air cooling solution maintains stable operation within HP’s specified range of 5°C to 30°C.

HP ZGX Nano AI Performance Testing

To evaluate the HP ZGX Nano with GB10, we tested Spark units using the vLLM Online Serving benchmark, the most widely adopted high-throughput inference and serving engine for large language models. The vLLM online serving benchmark simulates real-world production workloads by sending concurrent requests to a running vLLM server and measuring key metrics, including total token throughput (tokens per second), time to first token, and time per output token, across varying load conditions.

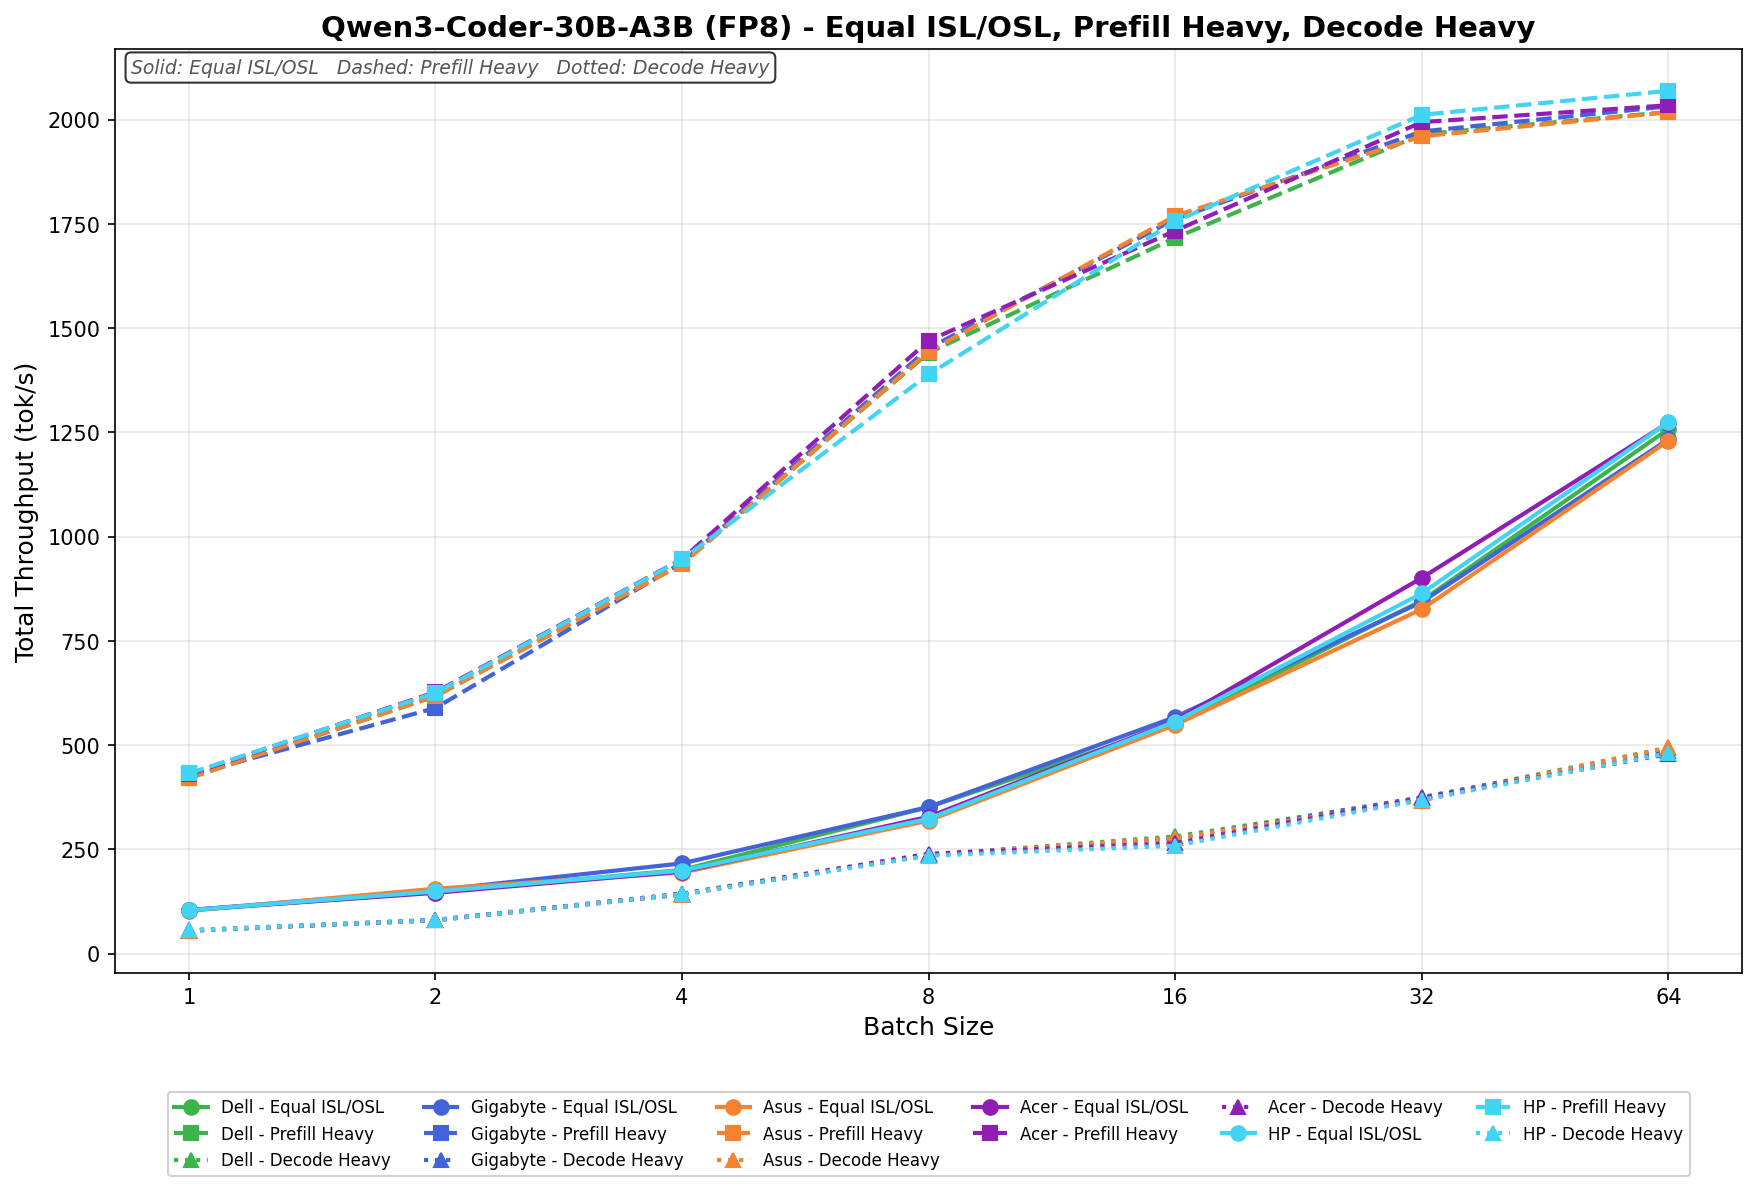
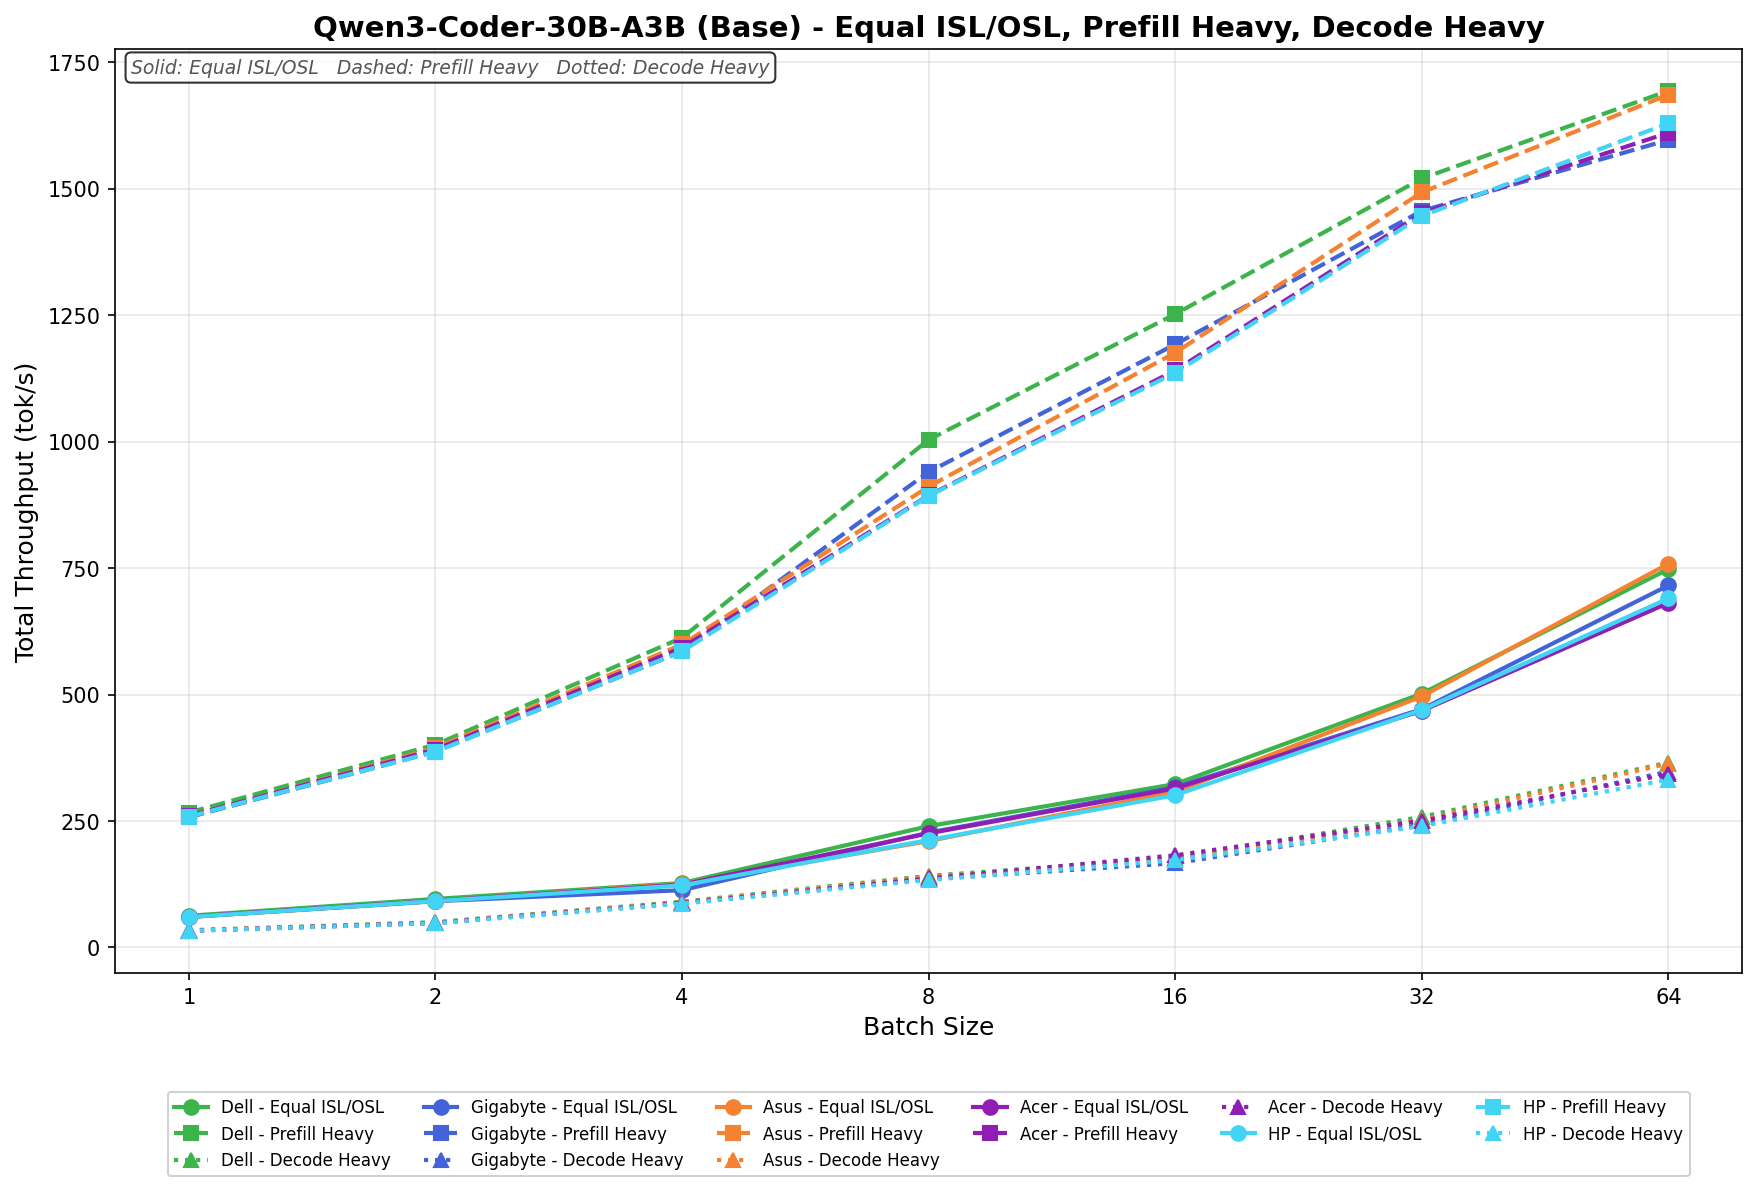
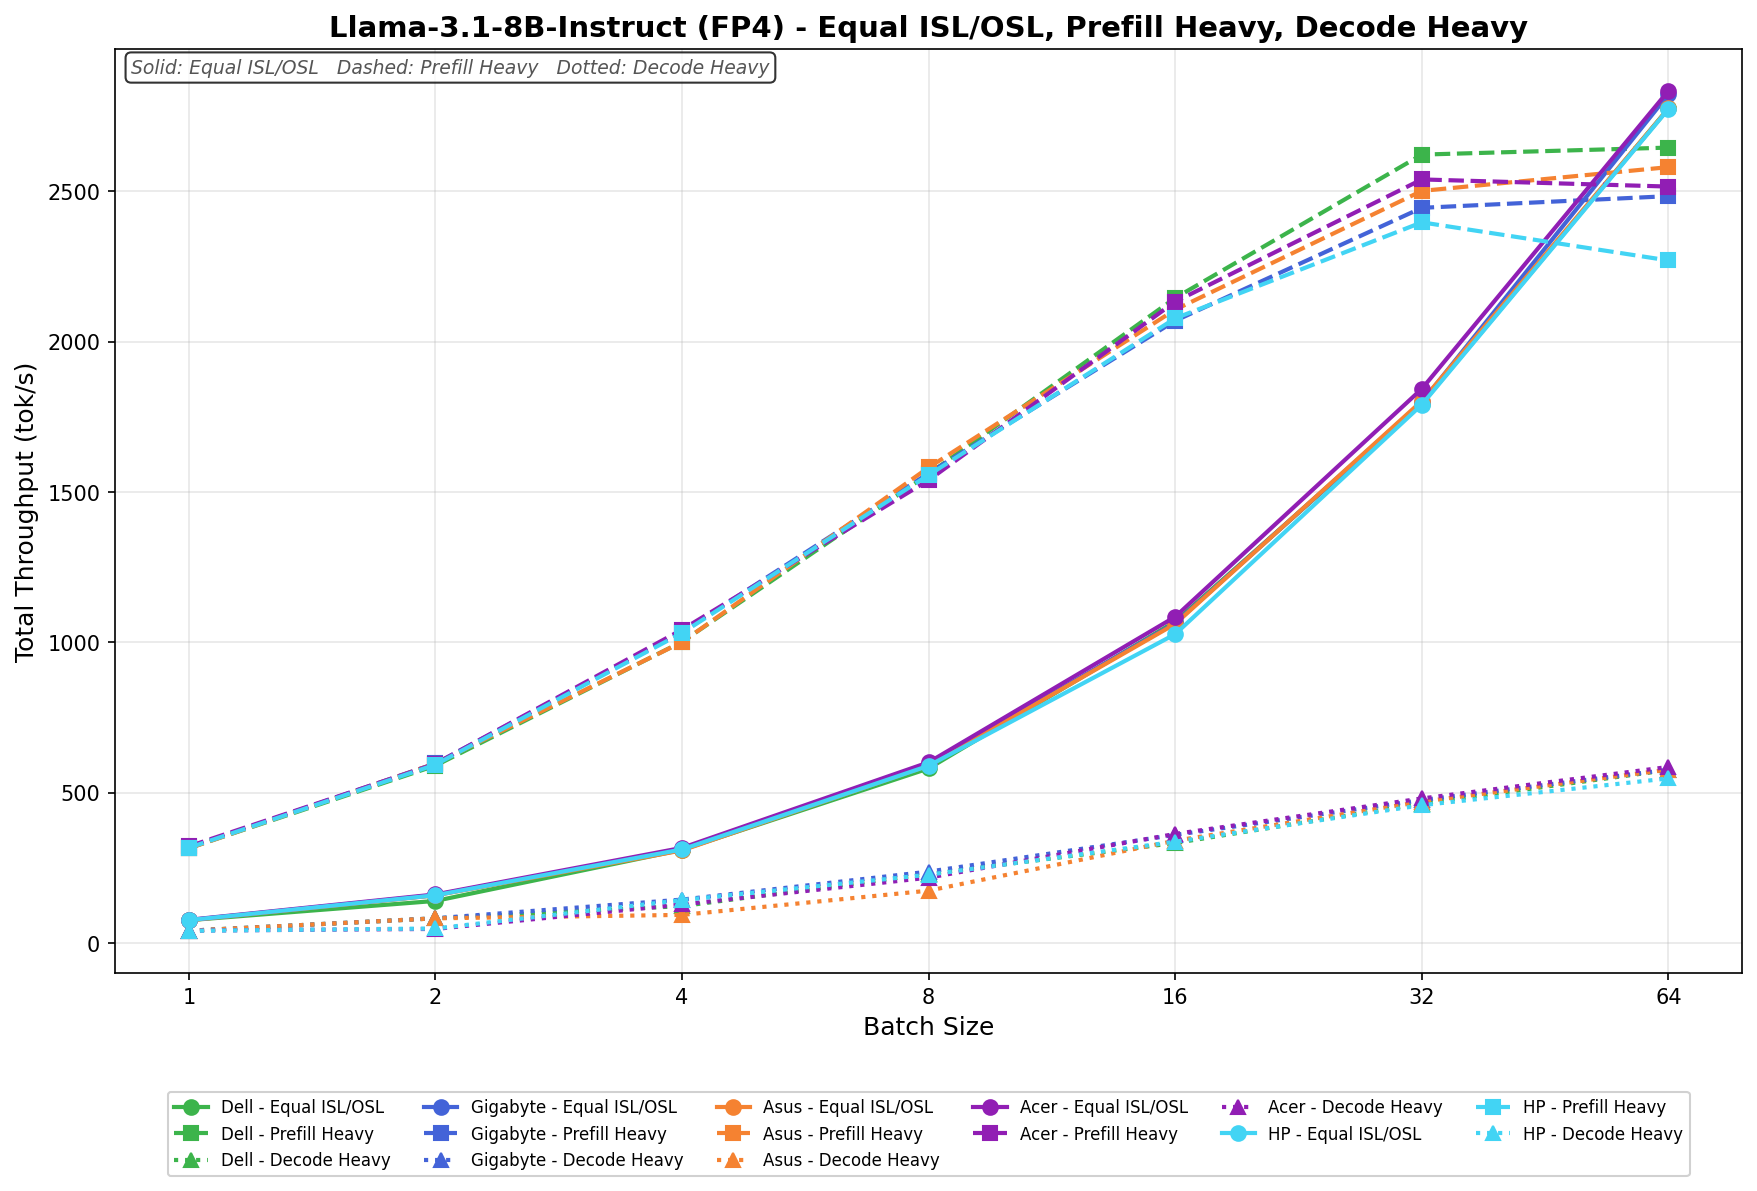
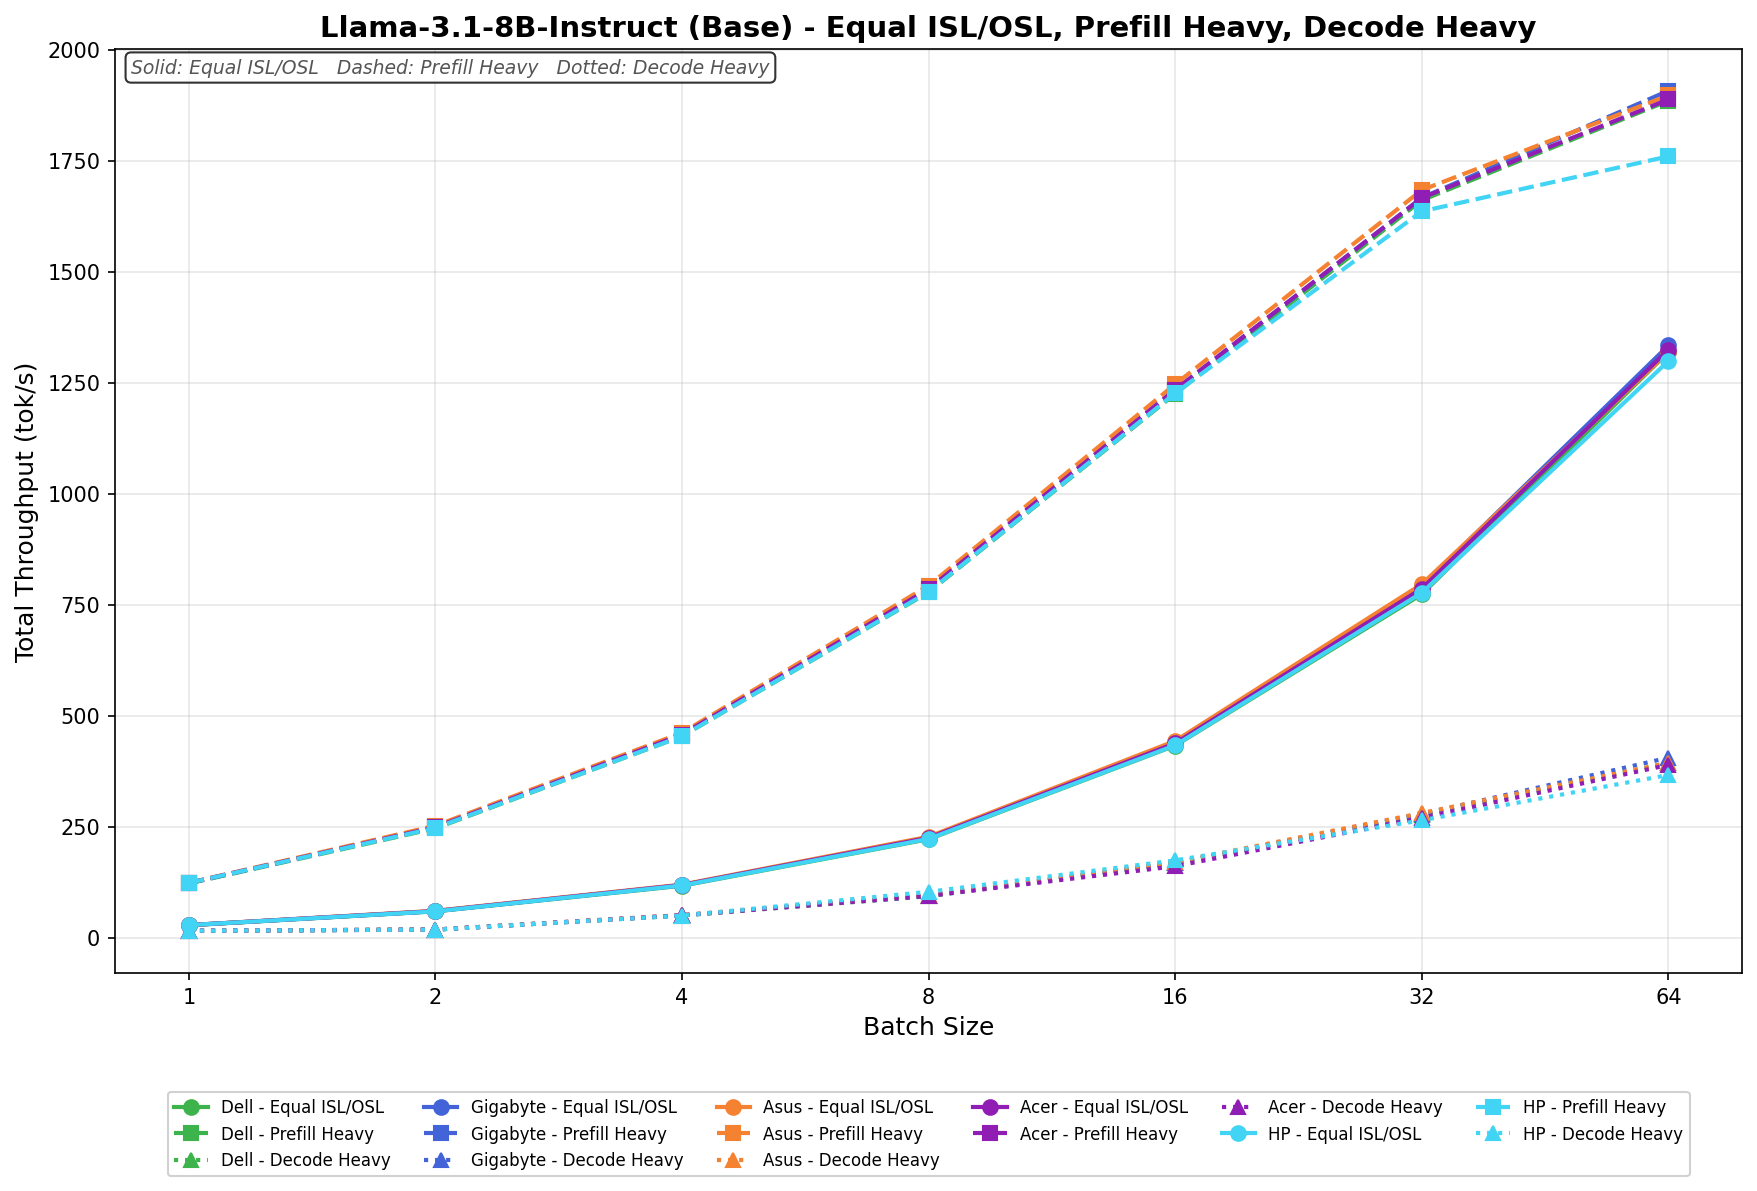
Our testing spanned a range of models, including dense architectures and micro-scaling data types, and evaluated performance across three workload scenarios: Equal ISL/OSL, Prefill Heavy, and Decode Heavy. These scenarios represent distinct real-world serving patterns, from balanced input and output loads to compute-intensive prompt processing and memory-bandwidth-bound token generation.

In addition to the HP ZGX Nano with GB10, we benchmarked other OEM systems from Dell, ASUSAcer, and Gigabyte. This allowed us to place HP’s results within the broader competitive landscape and understand where it leads, keeps pace with the pack, or trails across different models and workloads.

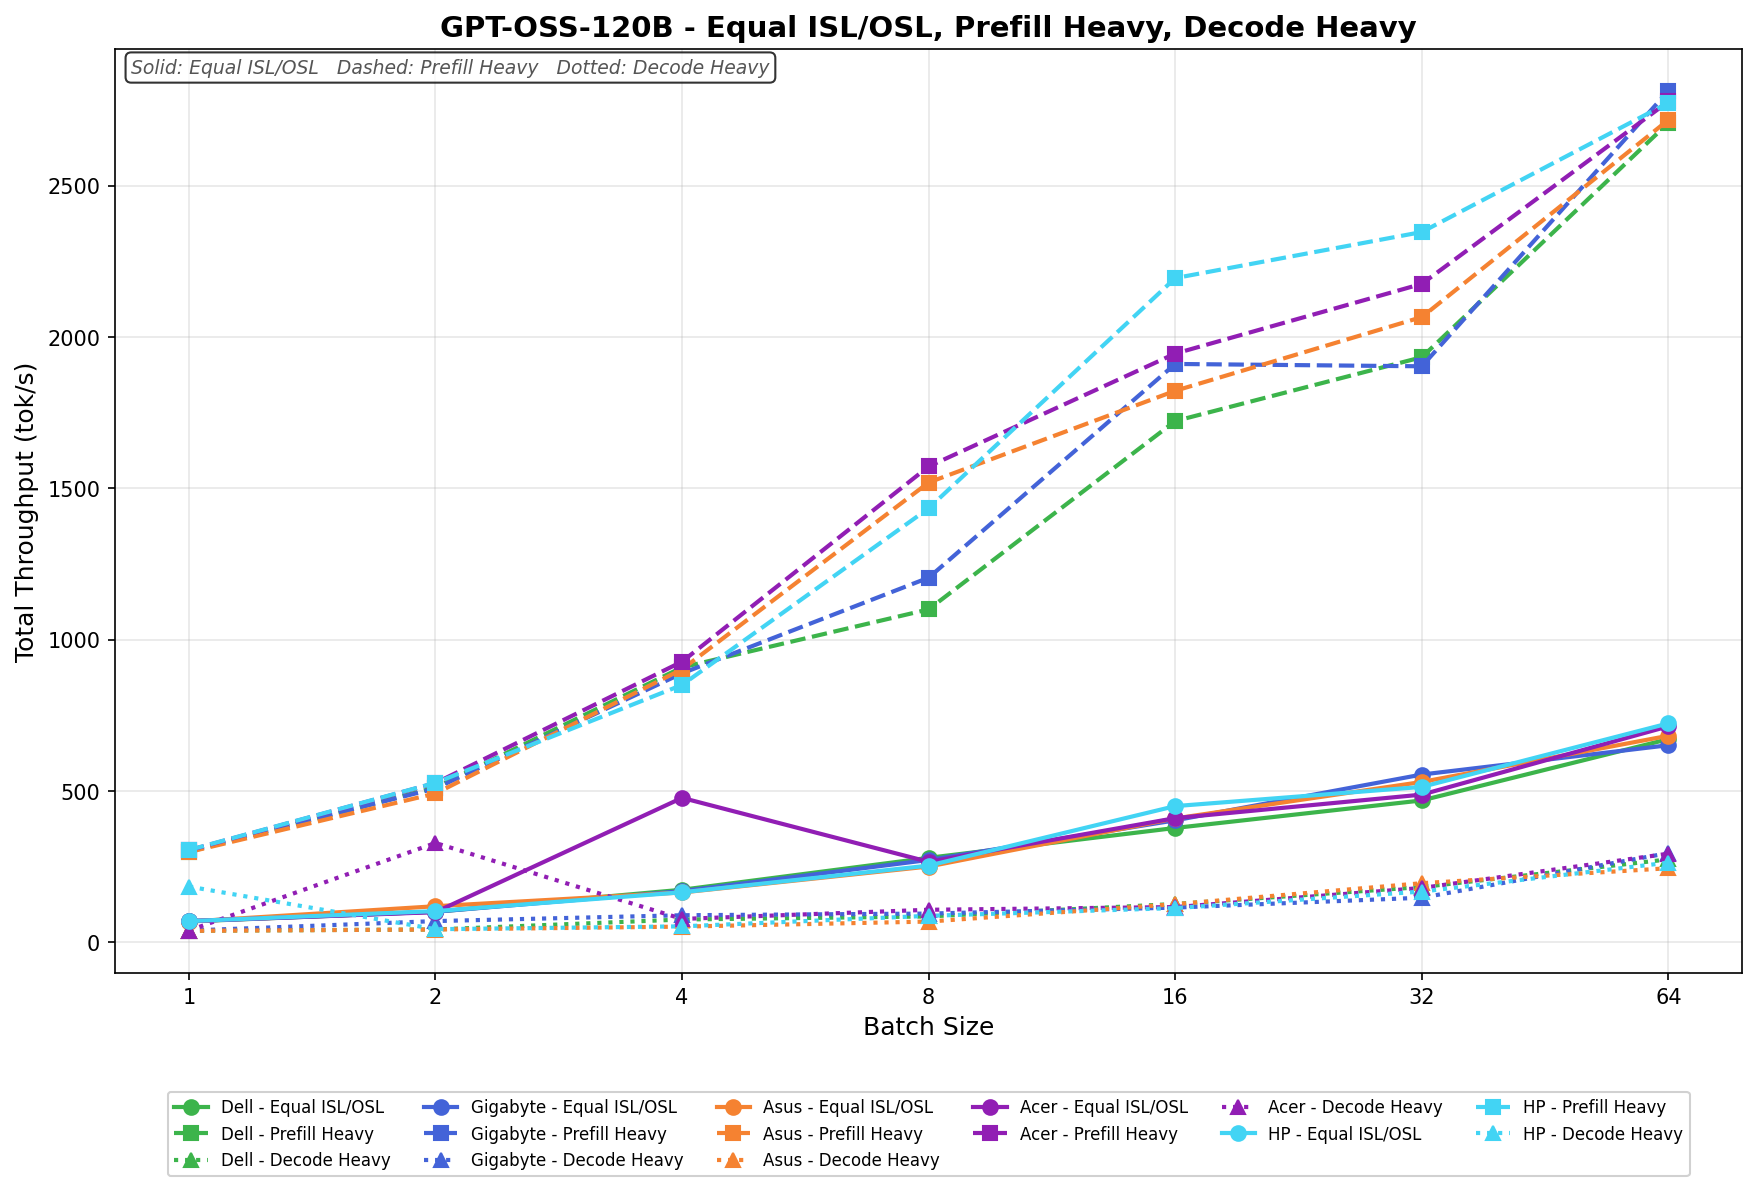
GPT-OSS-120B

With GPT-OSS-120B, the HP ZGX Nano G1n posts its strongest results in Prefill Heavy, where throughput climbs from 304.5 tok/s at batch 1 to 2773.3 tok/s at batch 64. Equal ISL/OSL also scales steadily, rising from 69.6 tok/s to 722.9 tok/s across the sweep. Decode Heavy is much lighter by comparison, starting at 183.7 tok/s in batch 1, dipping slightly in batch 2, then recovering to 262.9 tok/s by batch 64.


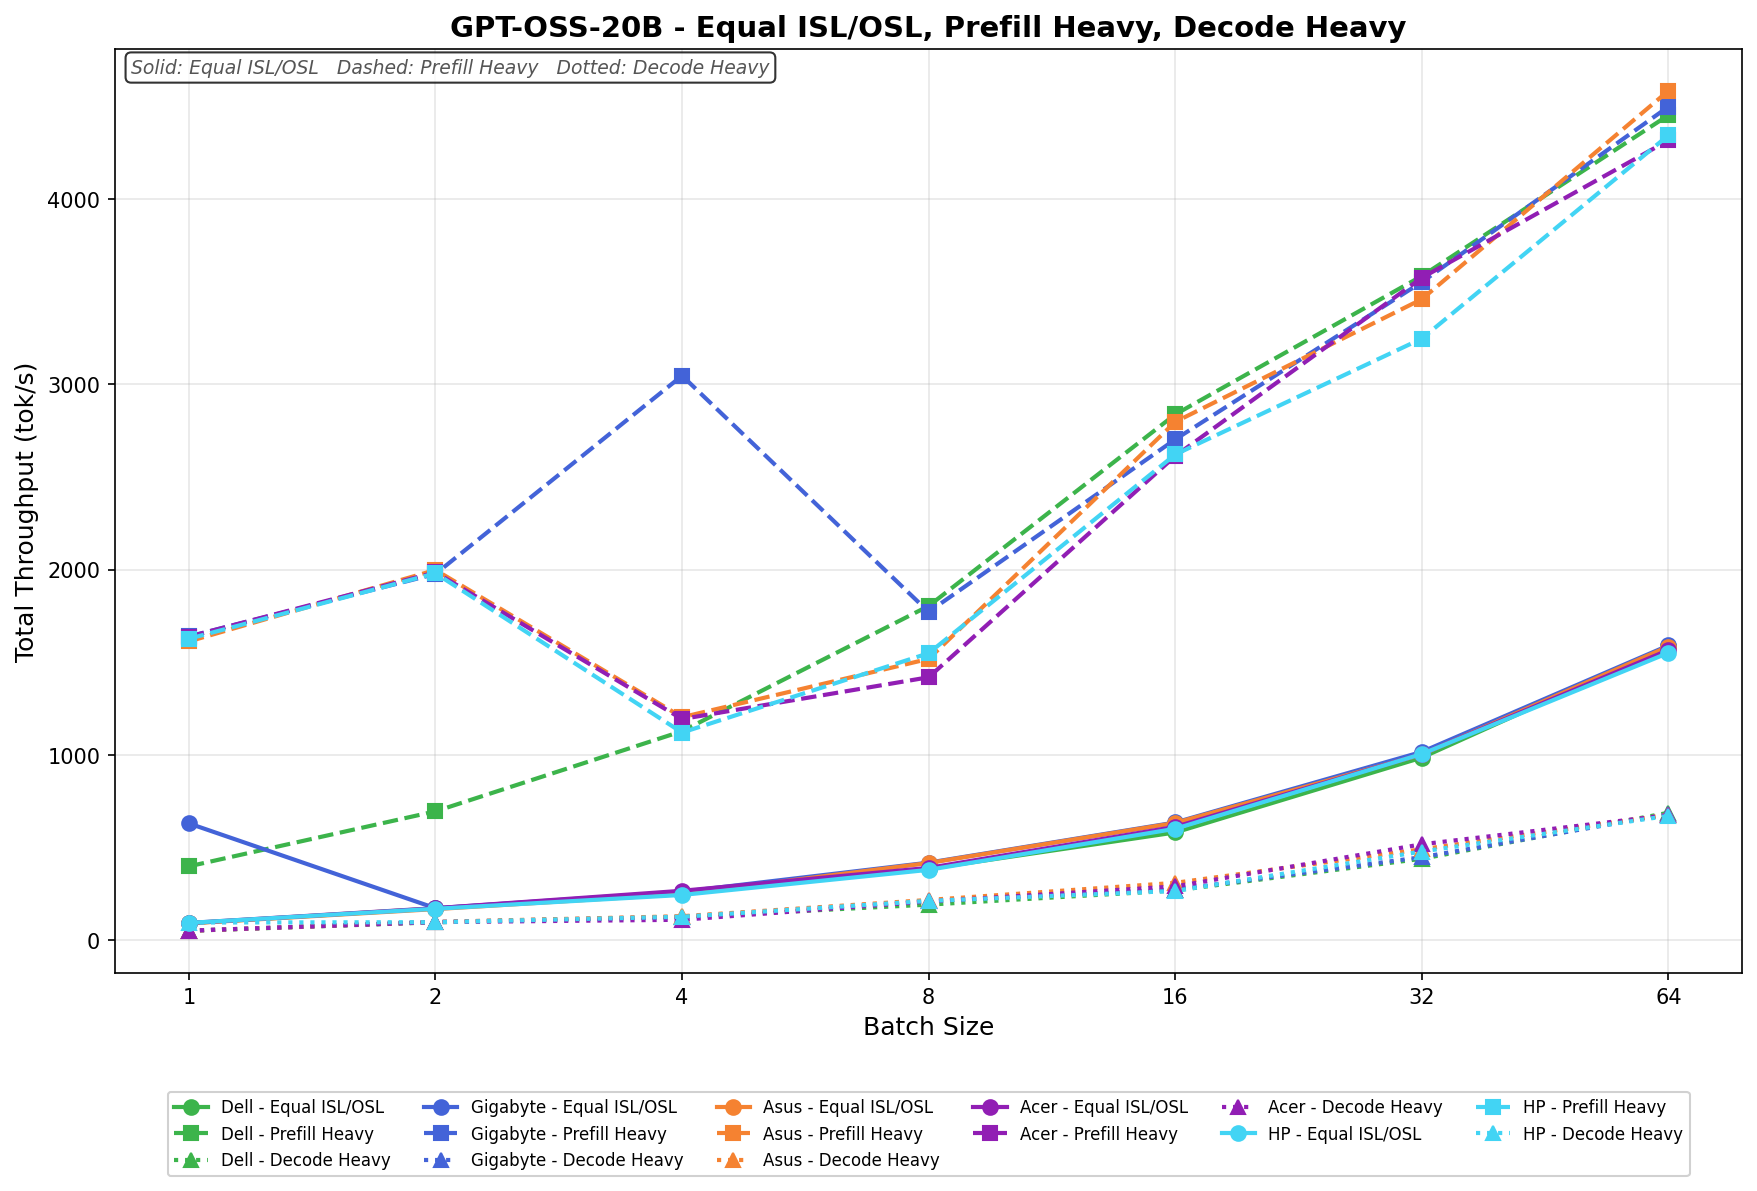
GPT-OSS-20B

With GPT-OSS-20B, HP’s highest numbers come from Prefill Heavy, but the scaling is less linear than with the other models. Prefill starts at 1626.6 tok/s at batch 1, climbs to 1980.3 tok/s at batch 2, drops sharply to 1120.3 tok/s at batch 4, then recovers to 4345.1 tok/s by batch 64. Equal ISL/OSL scales more smoothly from 92.6 tok/s to 1550.6 tok/s, and Decode Heavy rises from 94.4 tok/s to 670.4 tok/s.

Qwen3 Coder 30B A3B FP8

For Qwen3 Coder 30B A3B (FP8), HP again excels in Prefill Heavy, with throughput increasing from 432.2 tok/s at batch size 1 to 2069.4 tok/s at batch size 64. Equal ISL/OSL rises from 104.2 tok/s to 1274.4 tok/s, while Decode Heavy improves from 55.9 tok/s to 480.4 tok/s. This is among HP’s stronger overall results.

Qwen3 Coder 30B A3B Base

On Qwen3 Coder 30B A3B (Base), HP delivers steady growth across all three phases, although the topline remains in the Prefill Heavy phase. That phase increases from 258.6 tok/s at batch 1 to 1629.4 tok/s at batch 64. Equal ISL/OSL scales from 60.3 tok/s to 690.3 tok/s, while Decode Heavy rises from 33.0 tok/s to 331.8 tok/s.

Llama 3.1 8B Instruct FP4

With Llama-3.1-8B-Instruct (FP4), HP shows a clear step up in throughput. Equal ISL/OSL climbs from 76.4 tok/s at batch 1 to 2774.1 tok/s at batch 64, making it the strongest of HP’s three phases on this model. Prefill Heavy also scales aggressively, rising from 316.8 tok/s to 2397.1 tok/s at batch 32 before slipping to 2270.4 tok/s at batch 64. Decode Heavy increases from 40.7 tok/s to 547.6 tok/s across the sweep.

Llama 3.1 8B Instruct (Base)

On Llama-3.1-8B-Instruct (Base), the HP ZGX Nano G1n scales cleanly across all three phases. In Equal ISL/OSL, throughput rises from 28.2 tok/s at batch 1 to 1298.6 tok/s at batch 64. In Prefill Heavy, HP increases from 123.2 tok/s to 1759.5 tok/s, with gains remaining strong throughout the sweep before tapering slightly at the top end. Decode Heavy is much lighter by comparison, rising from 15.5 tok/s at batch 1 to 366.4 tok/s at batch 64.

GPU Direct Storage

How GPU Direct Storage Works

Traditionally, when a GPU processes data from an NVMe drive, the data must first pass through the CPU and system memory before reaching the GPU. This process creates bottlenecks because the CPU acts as a middleman, adding latency and consuming system resources. GPU Direct Storage eliminates this inefficiency by allowing the GPU to access data directly from the storage device over the PCIe bus. This direct path reduces data movement overhead, enabling faster, more efficient transfers.

AI workloads, especially those involving deep learning, are highly data-intensive. Training large neural networks requires processing terabytes of data, and any delay in data transfer leads to underutilized GPUs and longer training times. Accordingly, GPU Direct Storage addresses this challenge by delivering data to the GPU as quickly as possible, minimizing idle time and maximizing computational efficiency.

In addition, GDS benefits workloads that stream large datasets, such as video processing, natural language processing, and real-time inference. By reducing CPU reliance, GDS accelerates data movement and frees CPU resources for other tasks, further enhancing overall system performance.

GDSIO Read Throughput 16K

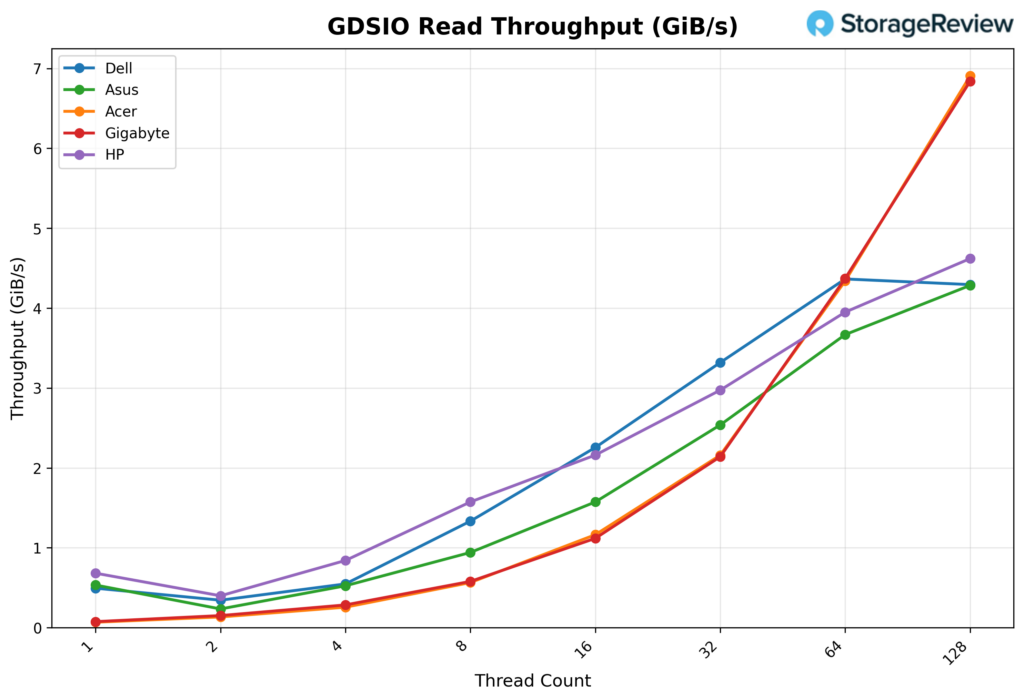
Looking at GDSIO Read Throughput 16K, the HP ZGX Nano G1n starts at 0.70GiB/s with 1 thread, placing it among the stronger low-thread performers in the group. It dips to 0.41GiB/s at 2 threads, then climbs back to 0.86GiB/s at 4 threads, showing the same small early-thread inconsistency seen in a few of these systems. From there, scaling becomes much more consistent. Throughput rises to 1.6GiB/s at 8 threads and 2.2GiB/s at 16 threads, then continues upward to 3.0GiB/s at 32 threads. At the higher queue depths, the HP keeps gaining ground, reaching 3.9GiB/s at 64 threads and peaking at 4.6GiB/s at 128 threads.

GDSIO Read Average Latency 16K

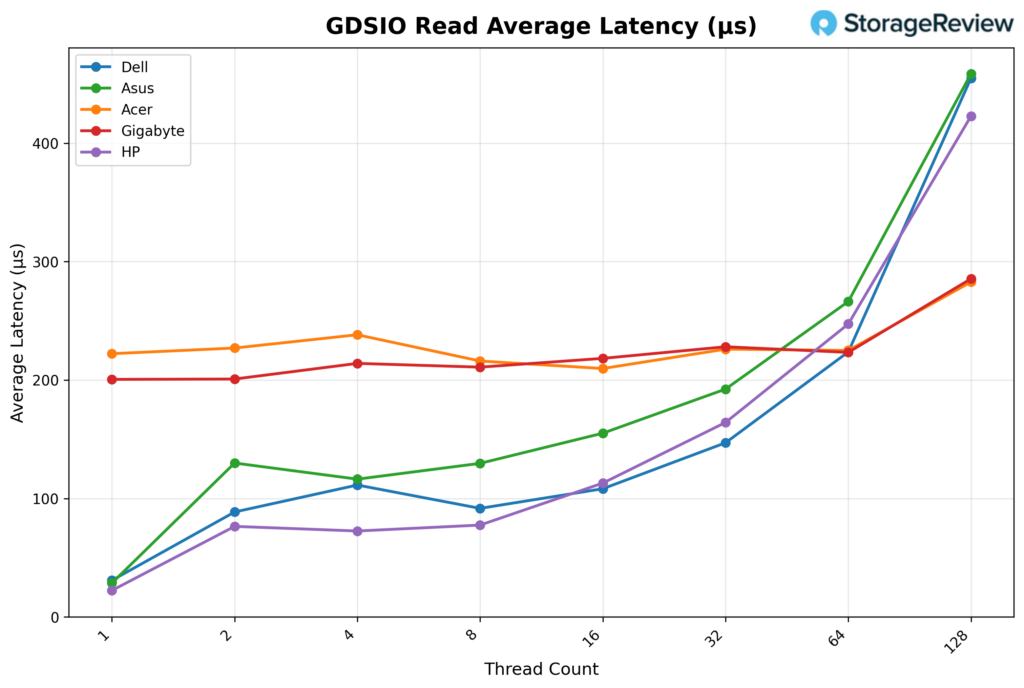
Looking at GDSIO Read Average Latency (16K), the HP ZGX Nano G1n starts at approximately 0.02ms with 1 thread and remains low through 2 threads (0.08ms) and 4 threads (0.07ms). Latency edges up slightly at 8 threads (0.08ms) and 16 threads (0.11ms), then increases more noticeably at 32 threads (0.16ms) and 64 threads (0.25ms). At 128 threads, latency reaches 0.42ms, still a bit below the highest results in the group while tracking the system’s steady throughput scaling across the test.

GDSIO Write Throughput 16K

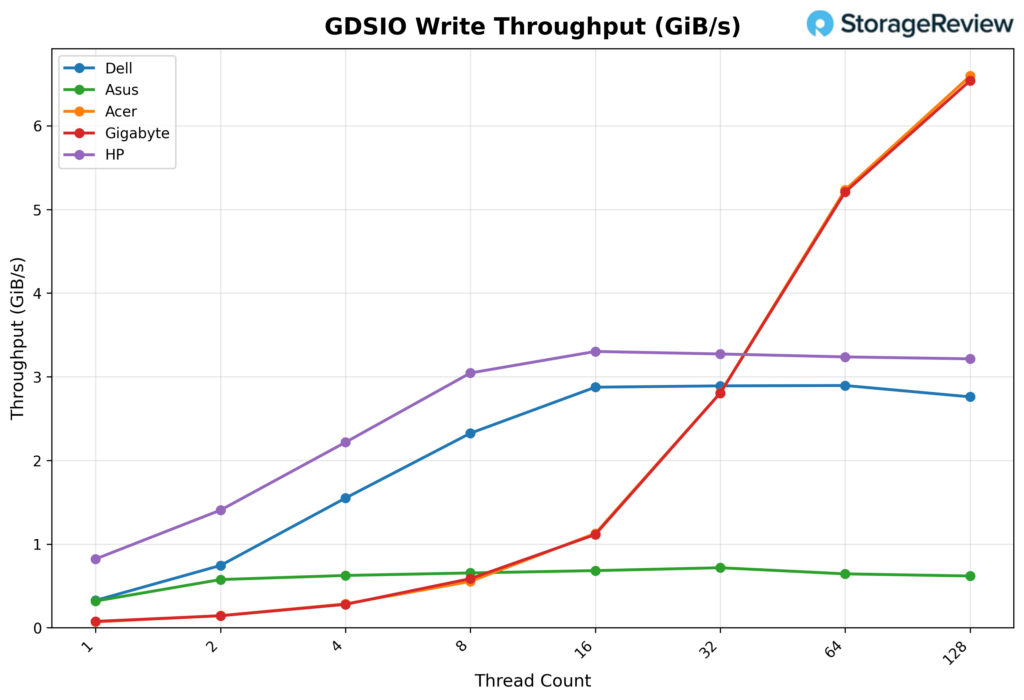
Looking at GDSIO Write Throughput 16K, the HP ZGX Nano G1n starts at 0.84GiB/s on 1 thread, rises to 1.4GiB/s on 2 threads, and reaches 2.2GiB/s on 4 threads. Performance continues to scale strongly at 8 threads (3.0 GiB/s) and reaches 3.3GiB/s at 16 threads, where it effectively levels off. From there, throughput remains nearly flat at 3.3GiB/s with 32 and 64 threads, then eases slightly to 3.2GiB/s with 128 threads, indicating the platform reaches its write ceiling relatively early and sustains that level consistently through the rest of the sweep.

GDSIO Write Average Latency 16K

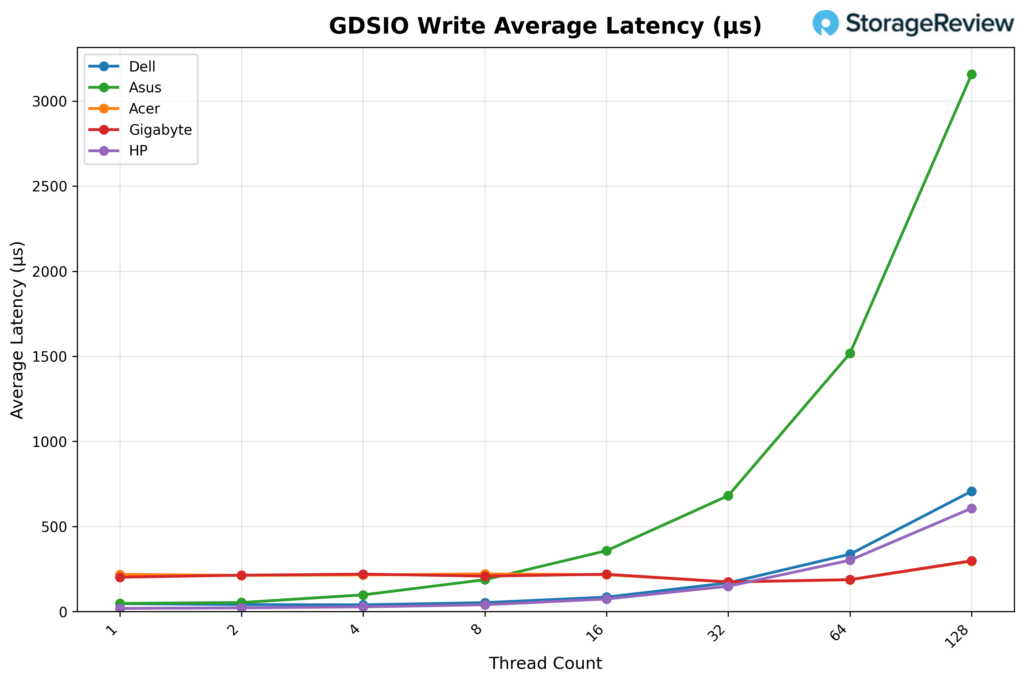
Looking at GDSIO Write Average Latency (16K), the HP ZGX Nano G1n starts at approximately 0.02ms with 1 thread and remains very low through 2 threads (0.02ms) and 4 threads (0.03ms). Latency rises modestly at 8 threads (0.04ms) and 16 threads (0.07ms), then jumps at 32 threads (0.15ms) and 64 threads (0.30ms). At 128 threads, latency reaches 0.61ms, still fairly well controlled overall, though the upward trend aligns with the point where write throughput has already flattened at higher thread counts.

GDSIO Read Throughput 1M

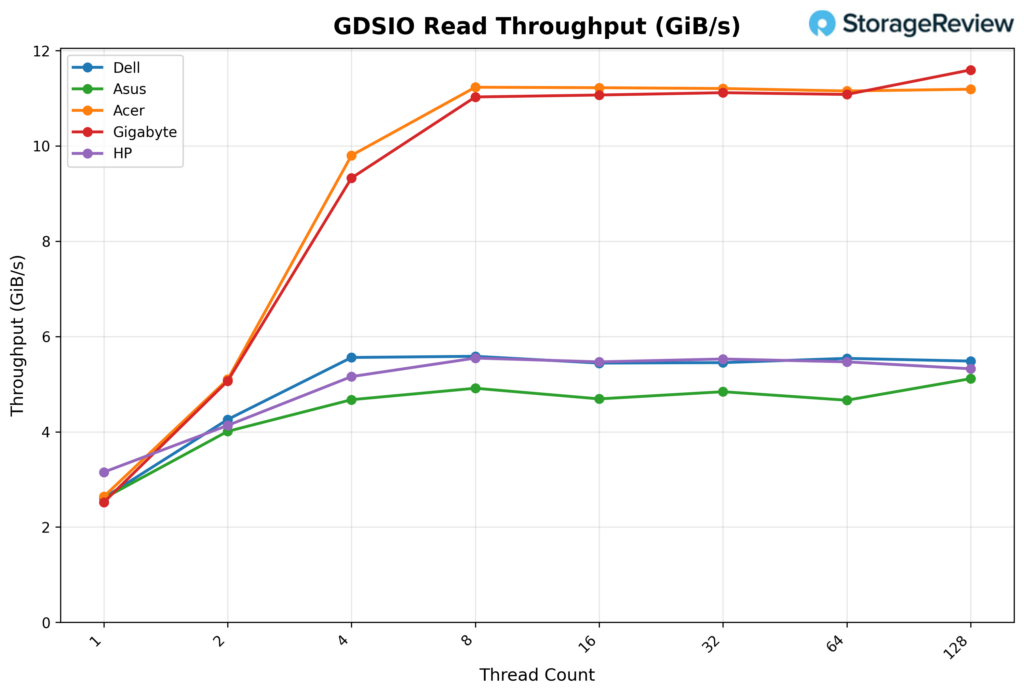
Looking at GDSIO Read Throughput 1M, the HP ZGX Nano G1n starts at 3.2GiB/s on 1 thread and rises to 4.1GiB/s on 2 threads. Performance continues to climb at 4 threads (5.2GiB/s) and 8 threads (5.5GiB/s), after which the platform effectively reaches its ceiling. Throughput then holds essentially flat at 5.5GiB/s for 16, 32, and 64 threads, before easing slightly to 5.3 GiB/s at 128 threads, indicating a strong early ramp followed by a very stable high-thread plateau.

GDSIO Read Average Latency 1M

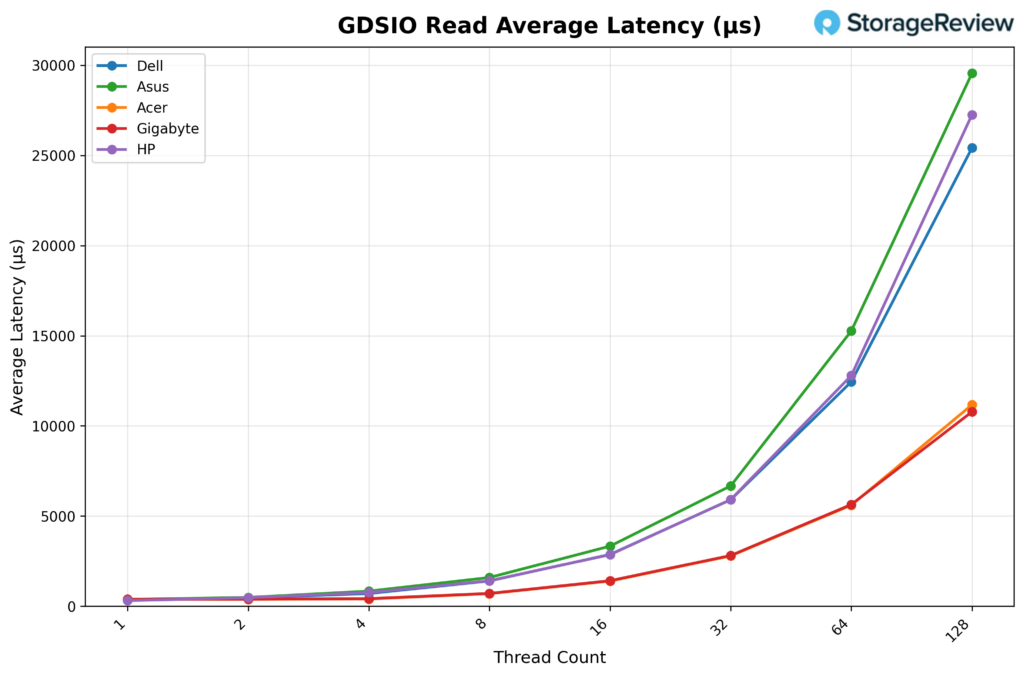
Looking at GDSIO Read Average Latency (1M), the HP ZGX Nano G1n starts at approximately 0.31ms with 1 thread and remains relatively low at 2 threads (0.47ms) and 4 threads (0.76ms). Latency increases with concurrency, rising to 1.4ms at 8 threads, 2.9ms at 16 threads, and 5.9ms at 32 threads. The trend continues at 64 threads (12.8ms) and reaches 27.2ms at 128 threads, tracking the higher queue depths even though throughput had already flattened much earlier in the sweep.

GDSIO Write Throughput 1M

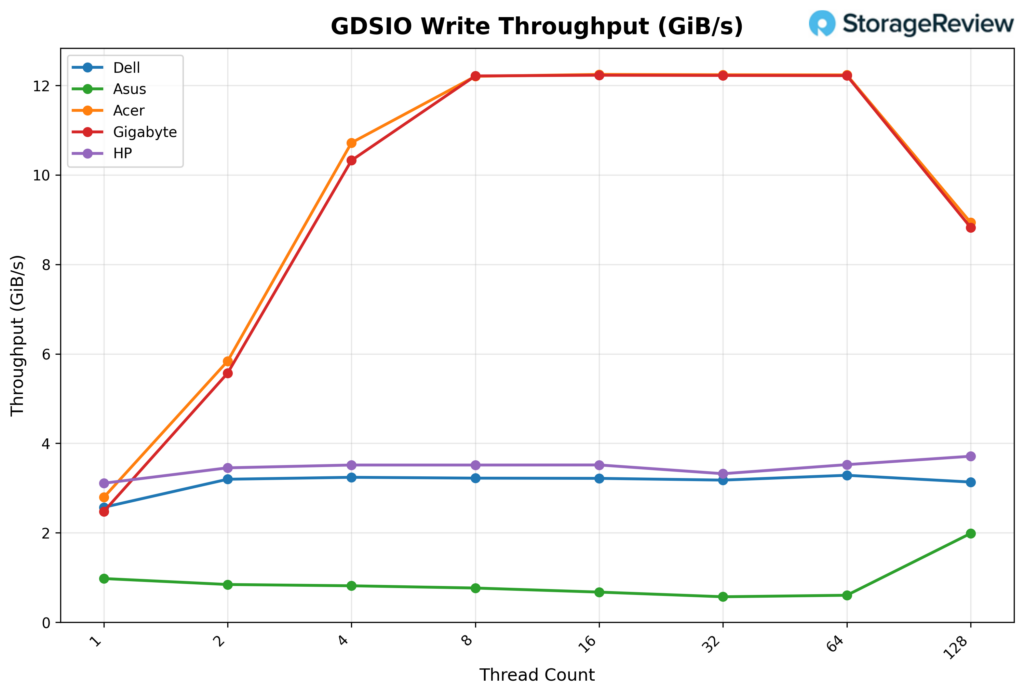
Looking at GDSIO Write Throughput 1M, the HP ZGX Nano G1n starts at 3.1GiB/s with 1 thread and rises to 3.5GiB/s with 2 threads, then holds that level at 4, 8, and 16 threads. Performance dips slightly to 3.3GiB/s at 32 threads before returning to 3.5GiB/s at 64 threads. At 128 threads, throughput increases to 3.7GiB/s, indicating a mostly flat write profile across the sweep with only minor variation and a small uptick at the highest thread count.

GDSIO Write Average Latency 1M

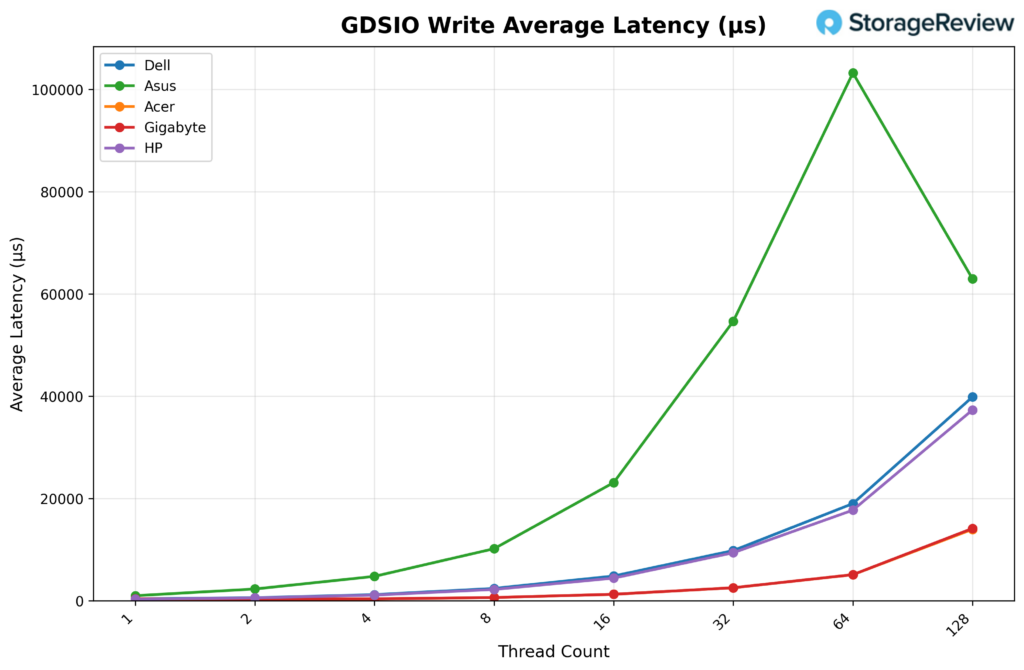
Looking at GDSIO Write Average Latency (1M), the HP ZGX Nano G1n starts at approximately 0.31ms with 1 thread, rising to 0.57ms with 2 threads and 1.1ms with 4 threads. Latency continues to climb as concurrency increases, reaching 2.2ms with 8 threads, 4.4ms with 16 threads, and 9.4ms with 32 threads. The upward trend continues at 64 threads (17.7ms) and reaches 37.3ms at 128 threads, reflecting steadily increasing queue pressure even though write throughput itself remains fairly flat through most of the sweep.

Conclusion

HP’s ZGX Nano G1n carries the DGX Spark platform’s expected performance profile and adds engineering choices that set it apart from the other Spark systems in the field. In our testing, CPU temperatures peaked at 77.3°C and GPU temperatures at 69°C, both on the cooler side of the Spark units we’ve benchmarked. vLLM performance was strongest in Prefill Heavy workloads across all six models we tested, with scaling that held cleanly through higher batch sizes. GPU Direct Storage read throughput reached 4.6 GiB/s at 16K and 5.5 GiB/s at 1M block sizes, and write throughput plateaued early but held that level consistently across the remaining thread counts.

HP ZGX Nano G1n stacked

Where the ZGX Nano G1n separates itself from the rest of the Spark field is in the work HP did around the reference design. The recycled-materials content, the upper/lower-chassis split that improves internal serviceability, and the acoustic envelope that holds at 27.6 dBA under load all reflect deliberate engineering choices beyond what the GB10 platform itself requires. The security stack follows the same pattern. TPM 2.0 in FIPS 140-2 mode, Common Criteria EAL4+, and SED OPAL storage push this unit past a developer appliance and toward a system that can clear procurement in regulated environments.

Like other Sparks, this is not a general-purpose workstation, and HP does not position it as one. For developers, small teams, and organizations that need local AI compute with credible sustainability and security stories behind the purchase, the ZGX Nano G1n is a clear differentiated option within the Spark lineup. For shops where those criteria do not apply, the underlying platform is the constant across all five OEM systems we’ve reviewed, and the decision comes down to ecosystem, support, and price.

Product Page – HP ZGX Nano G1n AI

The post HP ZGX Nano G1n AI Station Review: A Secure, Sustainable Desk-Side AI Node appeared first on StorageReview.com.

Seagate One Touch Desktop HDD Review: 24TB Without the Power Brick

Seagate’s new One Touch Desktop HDD sidesteps one of the staples of the desktop external drive category: the power brick. The refreshed lineup runs 8TB, 20TB, and 24TB in a 3.5-inch chassis, but instead of a DC input and wall adapter, it draws everything it needs over a single USB-C cable. Seagate bills it as the industry’s only bus-powered USB-C desktop HDD, which is a meaningful shift in a segment where cable count and desk clutter have long been accepted costs of doing business. Pricing starts at $259.99 for 8TB and tops out at $619.99 for 24TB.

Beyond the cable story, the One Touch Desktop HDD is straightforward mechanical storage aimed at backup and archive workloads. It slots between the complexity of a NAS and the cost of high-capacity SSDs, working well as a companion to a smaller internal NVMe or as a bulk offload destination for photos, video, and project files. The bus-powered design also opens up use cases that traditional desktop drives can’t cover, such as pulling footage off a laptop in the field with no outlet nearby. Pair that with Windows and Mac support, Seagate’s Toolkit for backup and mirroring, and two years of Rescue Data Recovery Services, and the pitch comes down to storage headroom, data safety, and a cleaner desk at a competitive cost per terabyte.

Design & Features

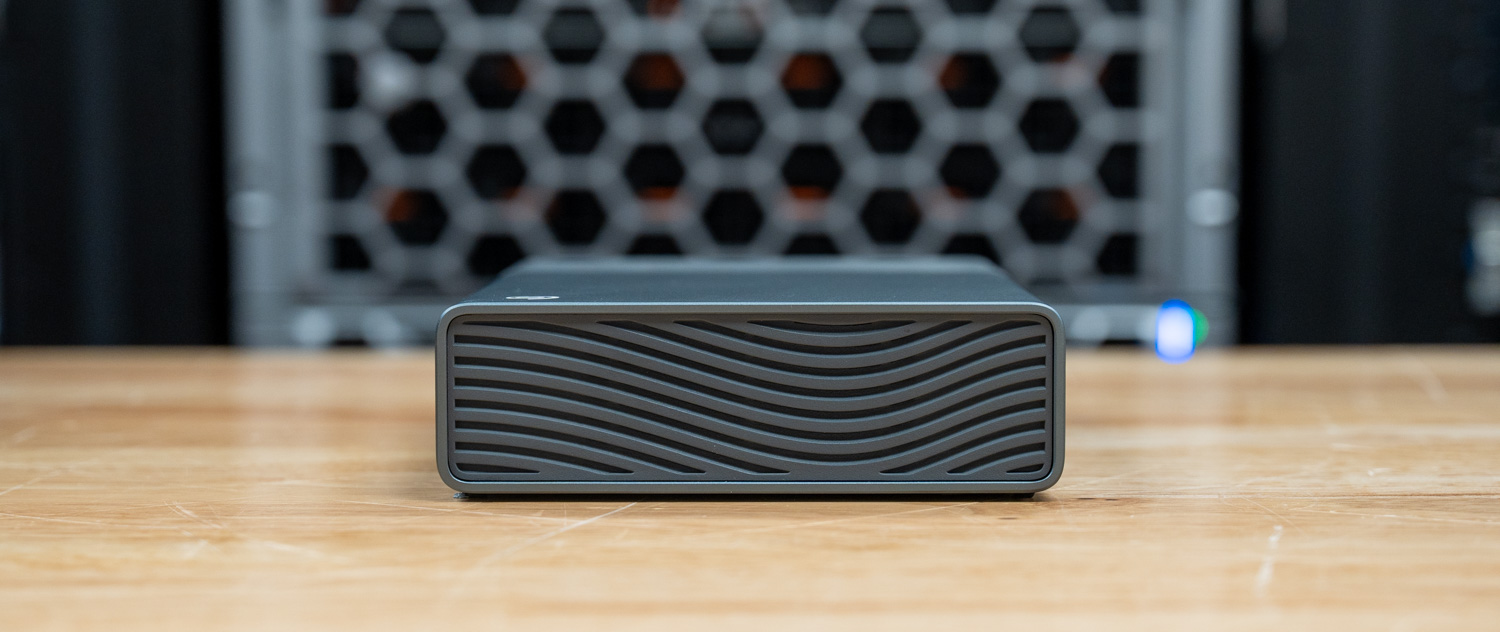
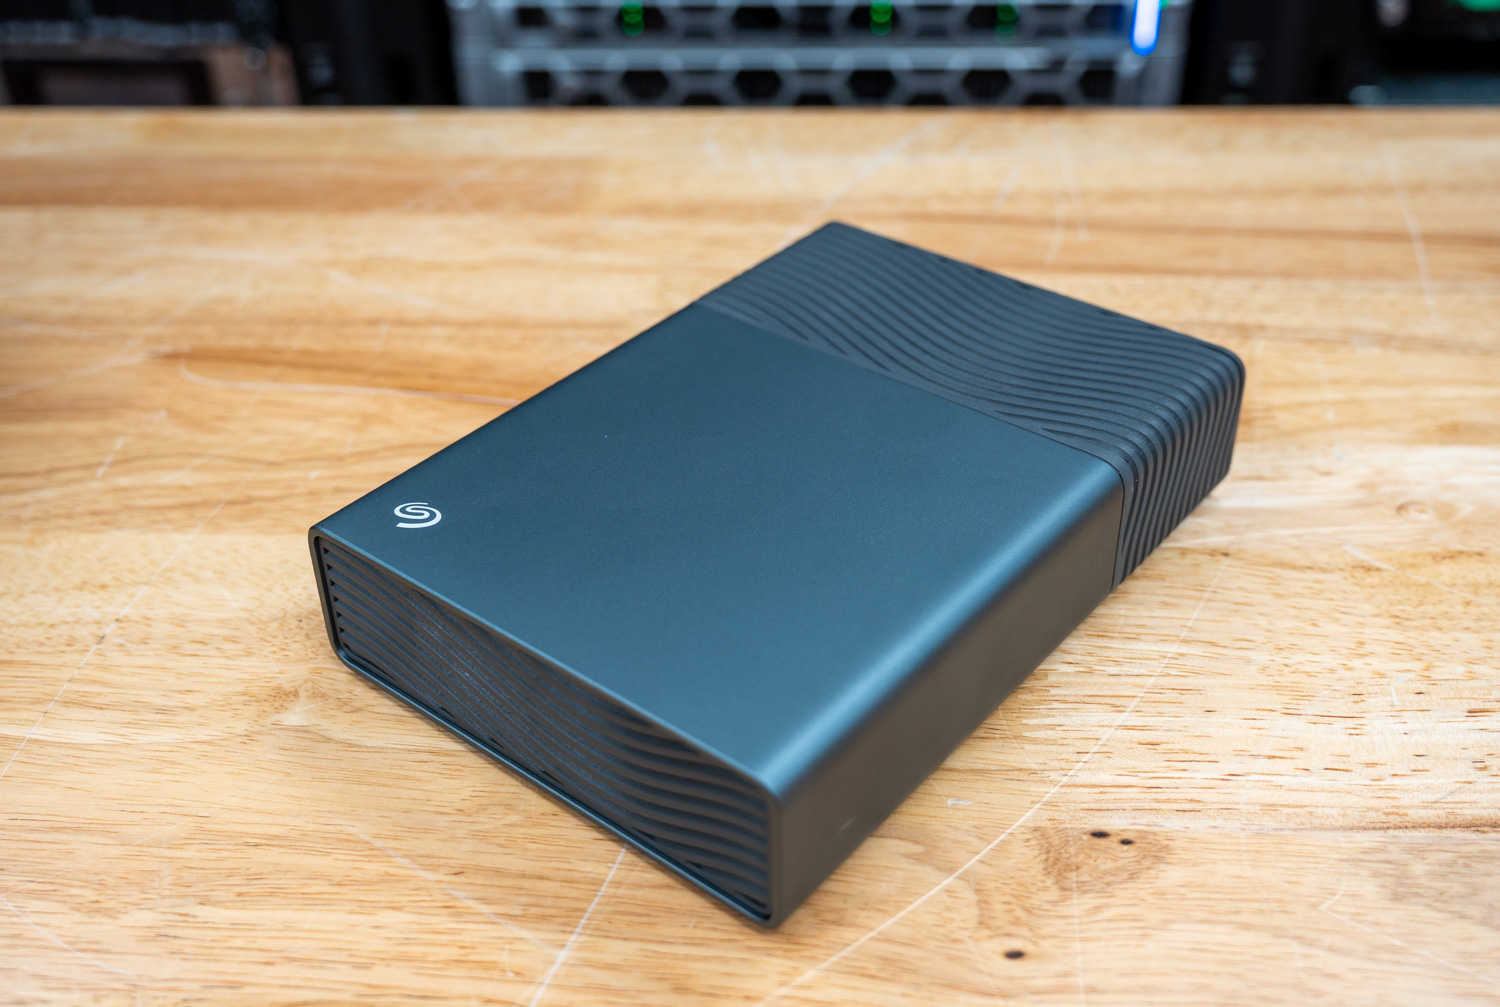
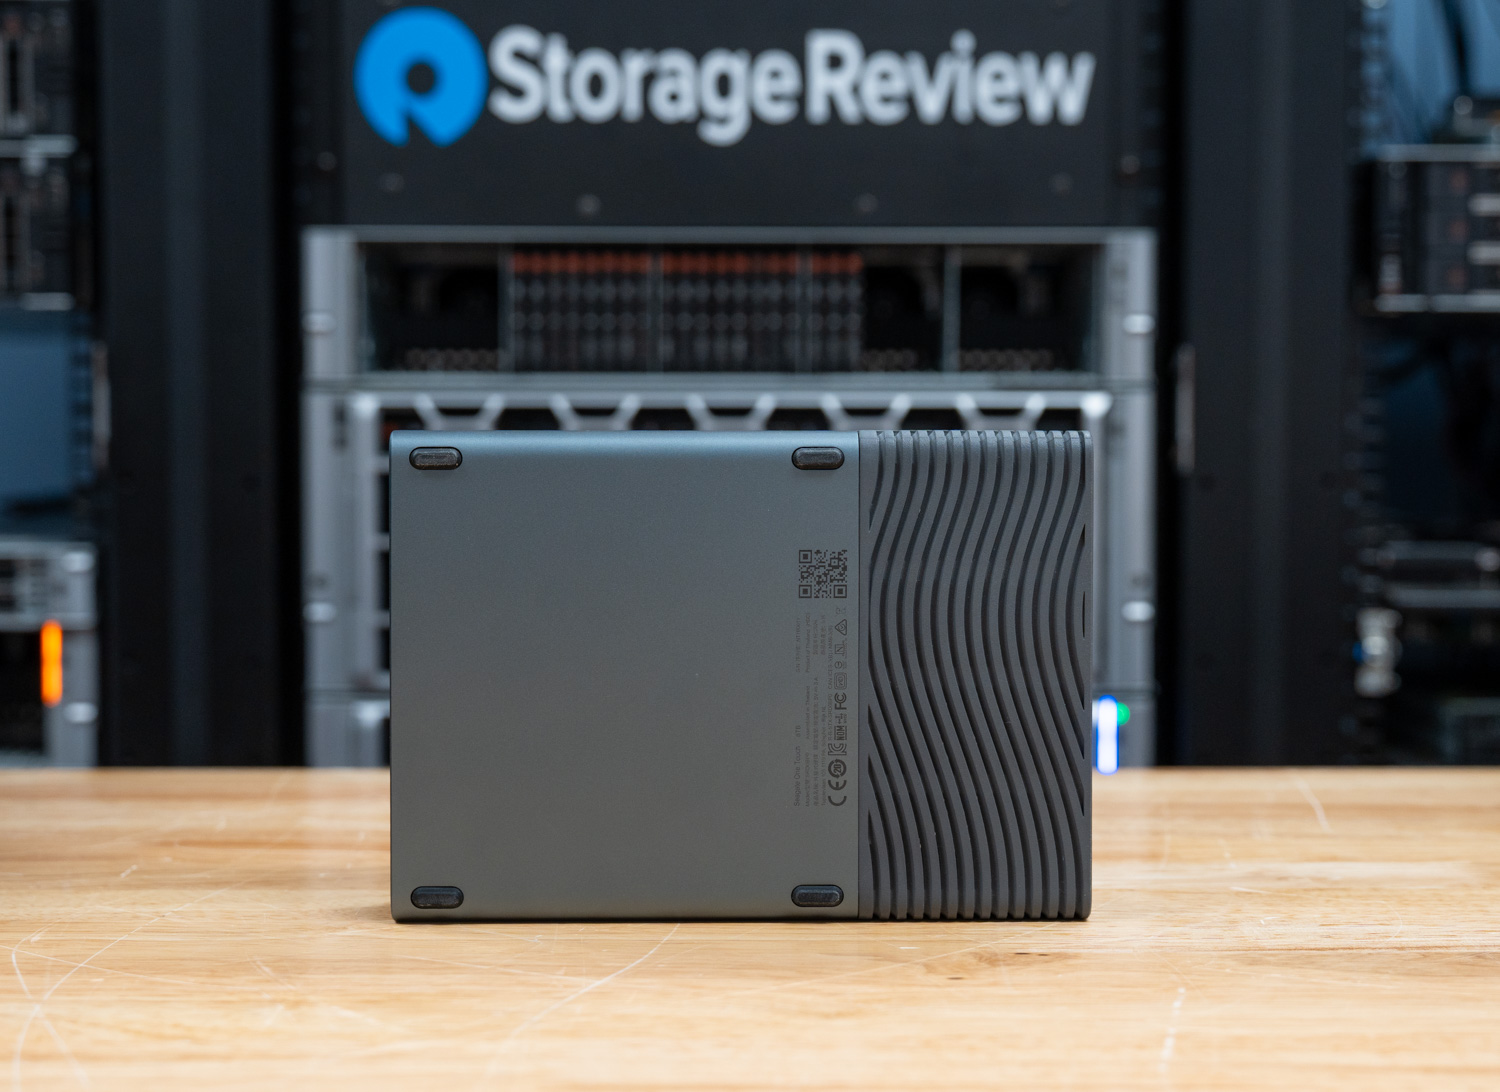
The One Touch Desktop HDD features a refined, premium aesthetic, combining aluminum and plastic for a solid, high-quality feel. Rubber feet on the bottom also help stabilize the device and prevent unwanted movement during operation. To keep things clean and minimal, Seagate has also avoided adding unnecessary lighting elements.

Seagate One Touch bottom view

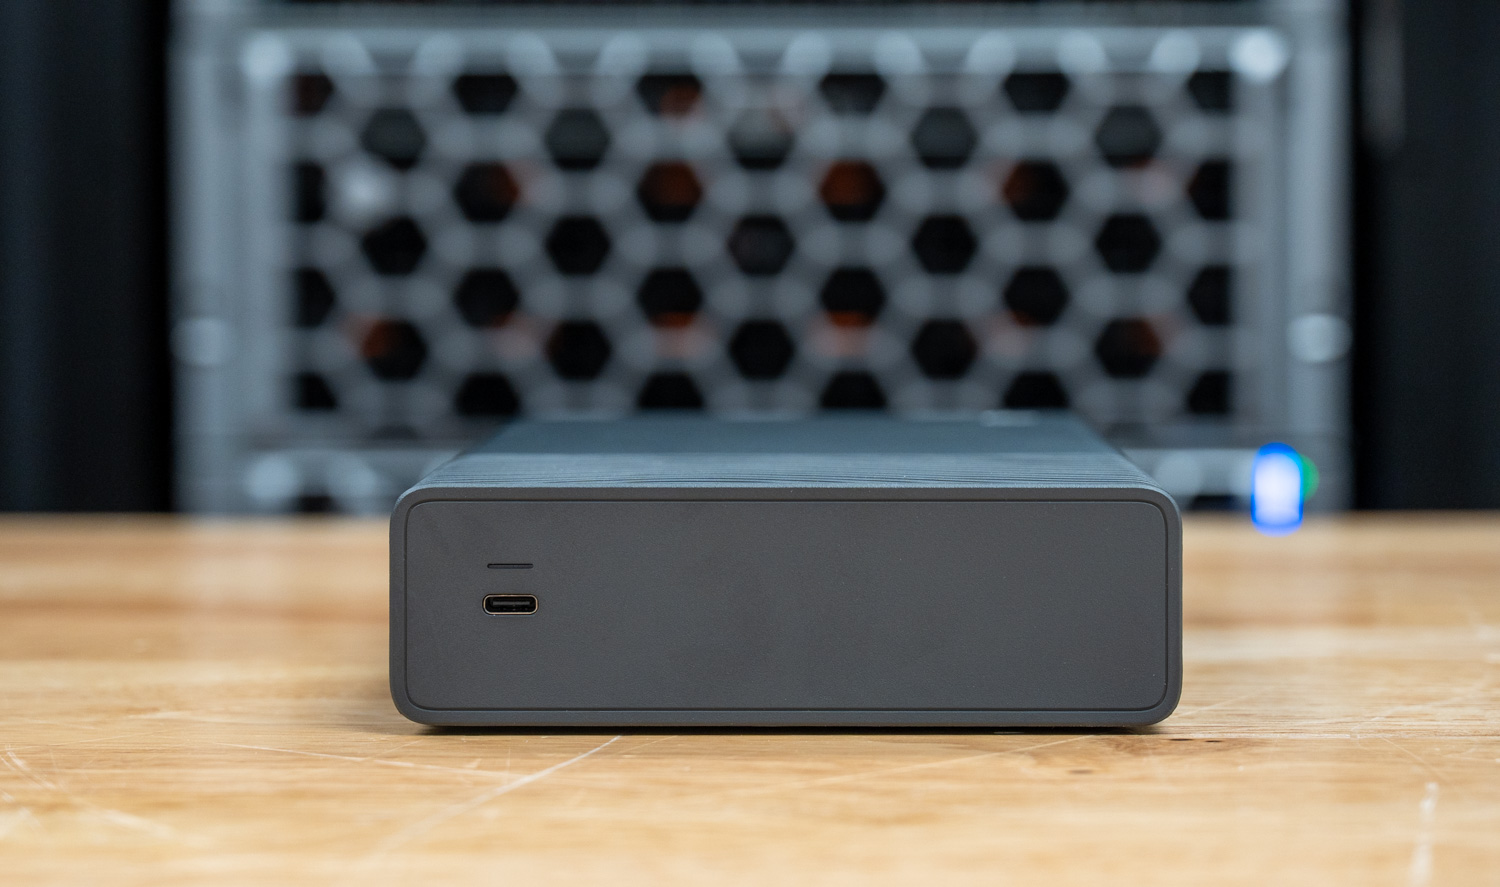
For connectivity, the drive uses a single USB-C cable and does not require a separate power adapter, provided the host port can supply at least 15W. While this requirement may be a limitation for older systems, it ultimately simplifies setup for modern devices. A small front-facing status light is the only visual indicator, blinking red if insufficient power is detected.

Seagate One Touch USB-C view

Getting started is pretty straightforward; simply plug in the cable and wait for the volume to mount. You can optionally install the Seagate Toolkit software, but it works out of the box with both Windows and macOS. Time Machine users will need to reformat before initial use, though.

Inside the box, Seagate includes a (0.5m) USB-C cable, Toolkit software, a quick-start guide, and a 2-year limited warranty. In addition, users receive 2-year Rescue Data Recovery Services, which include one in-lab recovery attempt, with recovered data returned on an encrypted device if the attempt is successful. The turnaround time for the recovery service is about 30 days, which provides peace of mind for anyone relying on the drive for long-term storage.

For creatives, Seagate provides a complimentary 2-month trial subscription to Adobe Creative Cloud Pro (All Apps). This inclusion gives users access to tools they might otherwise pay for separately, making the overall package more compelling.

Feature 8TB 20TB 24TB
Specifications
Connector USB-C
Interface USB 3.2 Gen 1 (up to 5Gb/s)
Power Bus-powered via USB-C (≥15W required)
Compatibility Windows & macOS (Time Machine requires reformat; ChromeOS not supported for Toolkit)
In the Box & Software
What’s in the Box One Touch HDD, 1.64ft USB-C cable, Toolkit software, Quick Start Guide
Included Software Seagate Toolkit, 2-month Adobe Creative Cloud Pro (All Apps) trial
Support & Pricing
Warranty 2-year limited (may vary by region)
Rescue Data Recovery 2-year included (may vary by region)
MSRP $259.99 $519.99 $619.99

Toolkit Software

Seagate Toolkit is a bundled utility that enhances the One Touch Desktop HDD’s functionality without complicating the user experience. After the initial backup, its incremental backup feature saves only modified files, helping keep backup times and system load manageable. At the same time, the Mirroring (RealTime Sync) feature continuously maintains updated copies of selected folders in the background. Additionally, Seagate Secure provides password protection for supported drives, while the Import function automatically transfers files from connected USB devices or memory cards, making it especially useful for frequent media offloads.

Moreover, Toolkit supports both scheduled and manual backups. Users who prefer automation can rely on scheduled backups, while those who want more control can trigger backups manually. Either way, it delivers essential data protection features without requiring third-party software.

Capacity in Context

To better understand available capacities, Seagate provides real-world storage estimates for common file types. Although actual results will vary depending on codec, compression, and workflow, these figures still offer a helpful baseline for planning:

Capacity 1080p HD Video (approx.) 4K Video (approx.) RAW Photos (approx.)
8TB ~800 hours ~120 hours ~200,000
20TB ~2,000 hours ~300 hours ~500,000
24TB ~2,400 hours ~360 hours ~600,000

Performance

To evaluate the performance of the Seagate One Touch Desktop HDD, we compared it against the Seagate FireCuda X Vault across a variety of benchmarks.

Here’s the high-performance test rig we used for benchmarking:

  • CPU: AMD Ryzen 7 9850X3D
  • Motherboard: Asus ROG Crosshair X870E Hero
  • RAM: G.SKILL Trident Z5 Royal Series DDR5-6000 (2x16GB)
  • GPU: NVIDIA GeForce RTX 4090
  • OS: Windows 11 Pro

The drive inside our 8TB Seagate One Touch HDD self-reported as the Seagate SkyHawk (ST8000VX009) at 5400 RPM.

Blackmagic Disk Speed Test

The BlackMagic Disk Speed Test benchmarks a drive’s read and write speeds to estimate its performance, especially for video editing tasks. It helps users ensure their storage is fast enough to handle high-resolution content, such as 4K or 8K video.

In Blackmagic, the Seagate FireCuda X Vault posted the stronger read speed at 222.4 MB/s, edging out the Seagate One Touch Desktop HDD at 210.9 MB/s. Write performance also showed a similar edge, with the One Touch measuring 152.0 MB/s compared to 158.9 MB/s from the FireCuda X Vault. Overall, both drives landed in expected territory for high-capacity external hard drives, though the FireCuda showed slightly better read and write speed.

Blackmagic (higher is better) Seagate One Touch Desktop HDD 8TB Seagate FireCuda X Vault 8TB
Read 210.9 MB/s 222.4 MB/s
Write 152.0 MB/s 158.9 MB/s

IOMeter

In the 1-queue IOMeter run, the FireCuda X Vault led in sequential throughput, reaching 224.03 MB/s read and 223.37 MB/s write, compared to 211.26 MB/s read and 211.48 MB/s write from the One Touch Desktop HDD. Random 2MB performance was much closer. The One Touch slightly led in random 2MB writes at 150.06MB/s versus 149.59MB/s, while the FireCuda posted the better random 2MB read at 117.17MB/s versus 113.83MB/s.

Small-block performance remained low on both drives, as expected for HDD-based storage, with the FireCuda reaching 429 IOPS in random 4K writes versus 424 IOPS on the One Touch, while the One Touch narrowly led in random 4K reads at 129 IOPS versus 126 IOPS on the FireCuda. Overall, the FireCuda showed a modest advantage in sequential performance, while the two drives were very close in lighter random workloads.

IOMeter Test Seagate One Touch Desktop HDD 8TB Seagate FireCuda X Vault 8TB
Seq 2MB Write 211.48 MB/s 223.37 MB/s
Seq 2MB Read 211.26 MB/s 224.03 MB/s
Random 2MB Write 150.06 MB/s 149.59 MB/s
Random 2MB Read 113.83 MB/s 117.17 MB/s
Random 4K Write 424 IOPS 429 IOPS
Random 4K Read 129 IOPS 126 IOPS

PCMark 10 Storage

PCMark 10 Storage Benchmarks evaluate real-world storage performance using application-based traces. They test the system and data drives, measuring bandwidth, access times, and consistency under load. These benchmarks offer practical insights beyond synthetic tests, enabling users to compare modern storage solutions effectively.

In PCMark 10’s Quick System Drive Benchmark, both drives delivered nearly identical performance, with the Seagate One Touch Desktop HDD scoring 750 and the Seagate FireCuda X Vault coming in at 746. This narrow gap suggests that, in trace-based workloads, the two drives perform very similarly, with no meaningful advantage for either.

As expected for high-capacity HDDs, both are best suited for bulk storage tasks such as backups, media libraries, and large file transfers rather than latency-sensitive workloads. Overall, this result shows that real-world responsiveness between the two is effectively on par in this test.

PCMark 10 Storage (higher is better) Seagate One Touch Desktop HDD 8TB Seagate FireCuda X Vault 8TB
Overall Score 750 746

Conclusion

The Seagate One Touch Desktop HDD is a category-first product in a commoditized space. Bus-powered USB-C on a 3.5-inch desktop drive genuinely changes how the drive fits on a desk or travels in a bag, and it’s the feature most likely to sway buyers who’ve grown tired of juggling bulky power bricks. Cross-platform support, Toolkit for backup and mirroring, and two years of Rescue Data Recovery Services round out a package that covers the basics without asking for much from the user.

Performance lands where it should for 5400 RPM mechanical storage. Sequential throughput sits in the low 200s MB/s, random workloads are modest, and small-block IOPS are firmly in HDD territory. That rules it out for anything latency sensitive or for active video editing off the drive, but those aren’t the workloads this product targets. For backup, archive, media libraries, and bulk offload, it does the job.

At $259.99 for 8TB and $619.99 for 24TB, pricing is competitive against other high-capacity external HDDs, and the single-cable design is a real differentiator rather than a marketing one. For users who want maximum capacity with minimum desk footprint and cable clutter, the One Touch Desktop HDD earns its spot on the shortlist.

Product page – Seagate One Touch Desktop HDD

The post Seagate One Touch Desktop HDD Review: 24TB Without the Power Brick appeared first on StorageReview.com.

Ubiquiti UniFi G6 Turret Review: 4K PoE Camera with On-Device AI for $199

wall mounted ubiquiti g6 turret wall mounted ubiquiti g6 turret

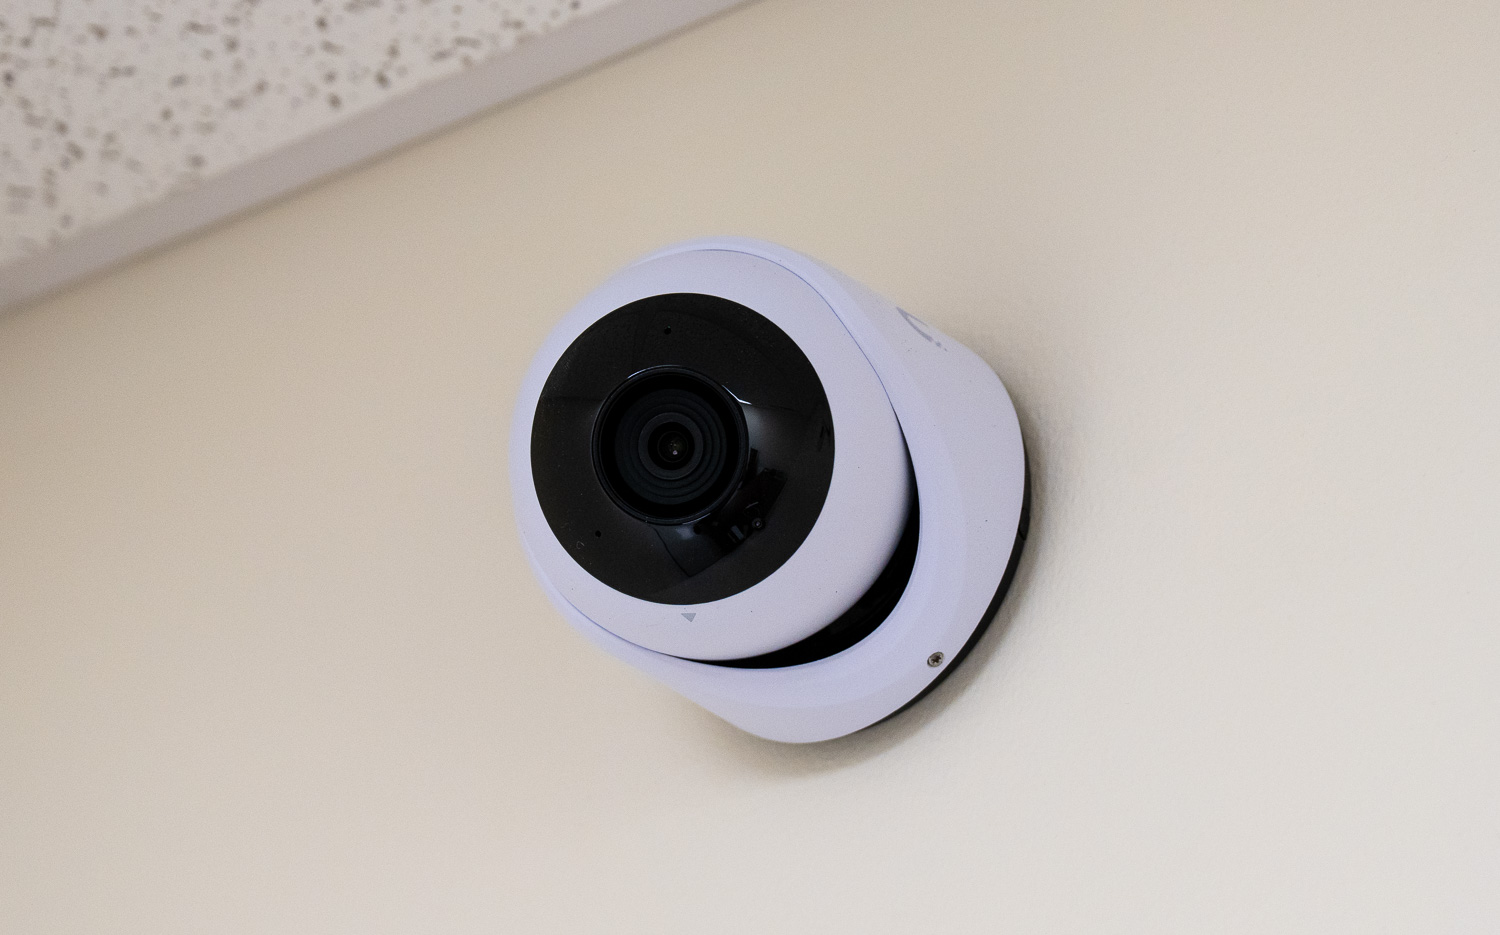
Ubiquiti’s G6 Turret is a 4K PoE camera with a turret design, featuring on-device face and license plate recognition and full UniFi Protect integration, all at a $199 price point. The turret design sets it apart from traditional domes by placing the lens module in a ball-and-socket housing. You can physically adjust the module on three axes after mounting, giving installers direct control over framing without being locked into the bracket’s angle. For jobs involving a specific entry lane, a retail counter, or a tight corridor, this hands-on adjustability considerably speeds up installation.

wall mounted ubiquiti g6 turret

Hardware Overview

The G6 Turret has a 1/1.8″ 8MP sensor and a quad-core processor powered by a Multi-TOPS AI Engine. In addition to local face and license plate recognition, this small camera offers 30-meter IR night vision and connects to UniFi Protect over standard PoE, without requiring PoE+.

The IK04 rating makes this camera better suited to controlled commercial spaces than high-exposure public areas. As a result, it belongs in offices, retail shops, or covered entrances rather than unmonitored street-side mounts, where frequent physical tampering isn’t expected.

Specification Ubiquiti UniFi G6 Turret
General
Dimensions ⌀100 × 95 mm (⌀3.9 × 3.7″)
Weight 550 g (1.2 lb)
Enclosure Material Aluminum alloy, polycarbonate
Weatherproofing IP66
Tamper Resistance IK04
Ambient Operating Temperature -30 to 50°C (-22 to 122°F)
Ambient Operating Humidity 0 to 90% noncondensing
Button (1) Factory reset
Video
Resolution 4K  8MP 3864 × 2160 (16:9)
Max. Frame Rate 30 FPS
Image Settings Color, brightness, sharpness, contrast, white balance, exposure control, 2DNR, 3DNR, NR by motion, masking, text overlay, HDR
Optics
Sensor 1/1.8″ 8MP
Lens Fixed focal length
Field of View H: 109.9°, V: 56.7°, D: 134.1°
Night Mode Built-in IR LED illumination and IR cut filter
IR Night Vision Range 30 m (98 ft)
Intelligence
Face Recognition
License Plate Recognition
Smart Detections People, Vehicles, Animals
Audio
Audio Microphone
Hardware
Processor Quad-core ARM Cortex-A53-based chip
Power
Power Method PoE
Supported Voltage Range 37 – 57V DC
Max. Power Consumption 12.5W
Networking
Networking Interface 10/100 MbE RJ45 port
UniFi Application Suite Protect
Cable
Cable Connector Type RJ45
Cable Diameter 4.5 mm (0.2″)
Cable Length 30 cm (1 ft)
Jacket Material Thermoplastic elastomer
Jacket Enclosure Dimensions ⌀20 × 70.6 mm (0.8 × 2.8″)
Jacket Enclosure Material Thermoplastic elastomer, polycarbonate, silicone rubber
Mounting
Included Mounting Ceiling, Wall
Optional Mounting Arm, Pendant, Junction Box

Design and Build

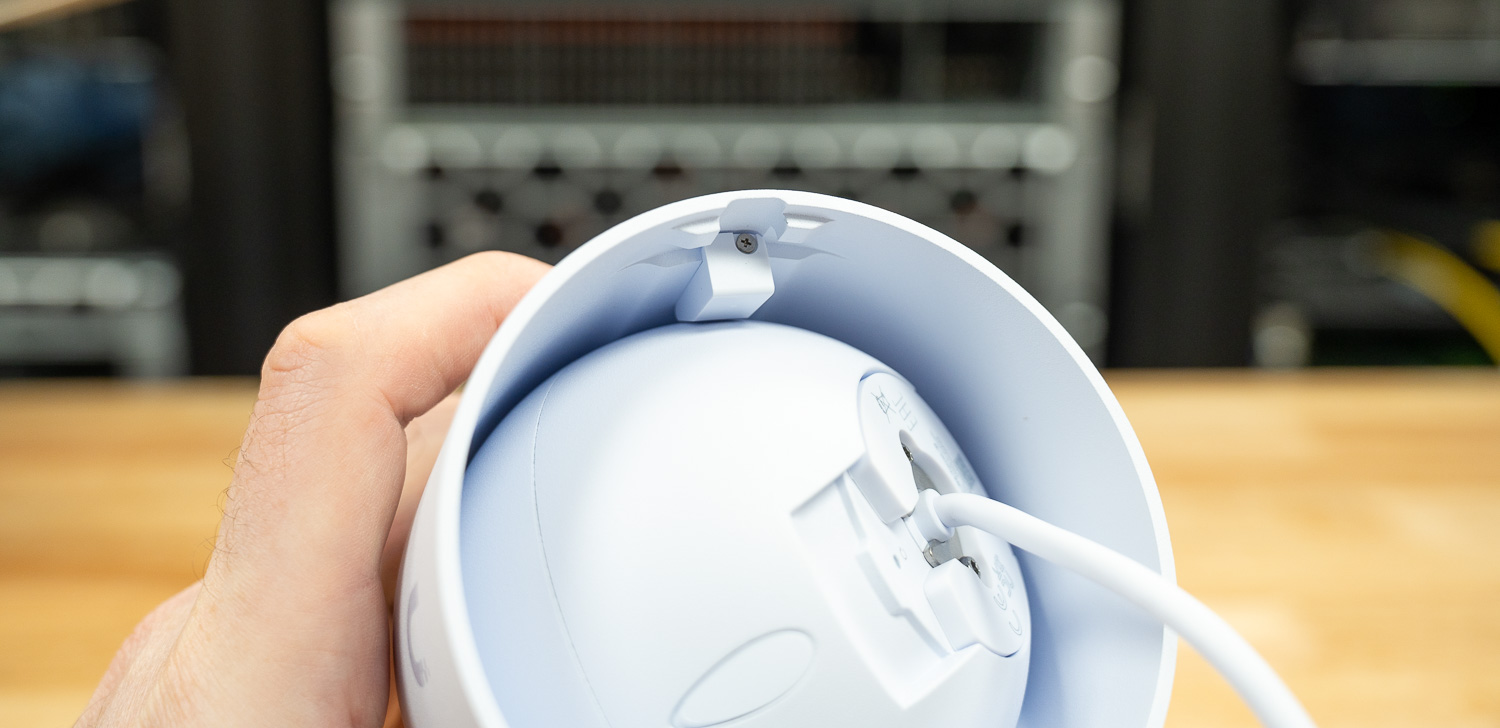
The turret form factor works differently from a dome. Rather than positioning a fixed lens behind a polycarbonate cover, the G6 Turret places its lens module in an exposed ball-and-socket housing that rotates freely until you tighten it down. Three-axis adjustment allows independent pan, tilt, and rotation, which is particularly useful on wall mounts, where a ceiling-only mount angle would otherwise require repositioning the entire bracket. Only a screwdriver is needed for adjustments, so framing the shot on-site is quick.

rear mounted-side view of the ubiquiti g6 turret

The camera measures ⌀100 × 95 mm and weighs 550 g (1.2 lb). Build quality is solid throughout, with an aluminum alloy and polycarbonate construction that matches the broader G6 lineup. The white finish blends cleanly against standard commercial ceilings, though the exposed ball joint makes this camera more visible than a low-profile dome. If a discreet install is a priority, a recessed dome is the better choice.

IP66 weatherproofing allows for outdoor use without a cover, so it handles car parks, entry canopies, and similar positions without issue. The IK04 rating covers standard commercial use cases but isn’t suited to high-impact or high-interference locations. The operating temperature range runs from -30 to 50°C (-22 to 122°F), so cold climates aren’t a concern either.

Optics and AI

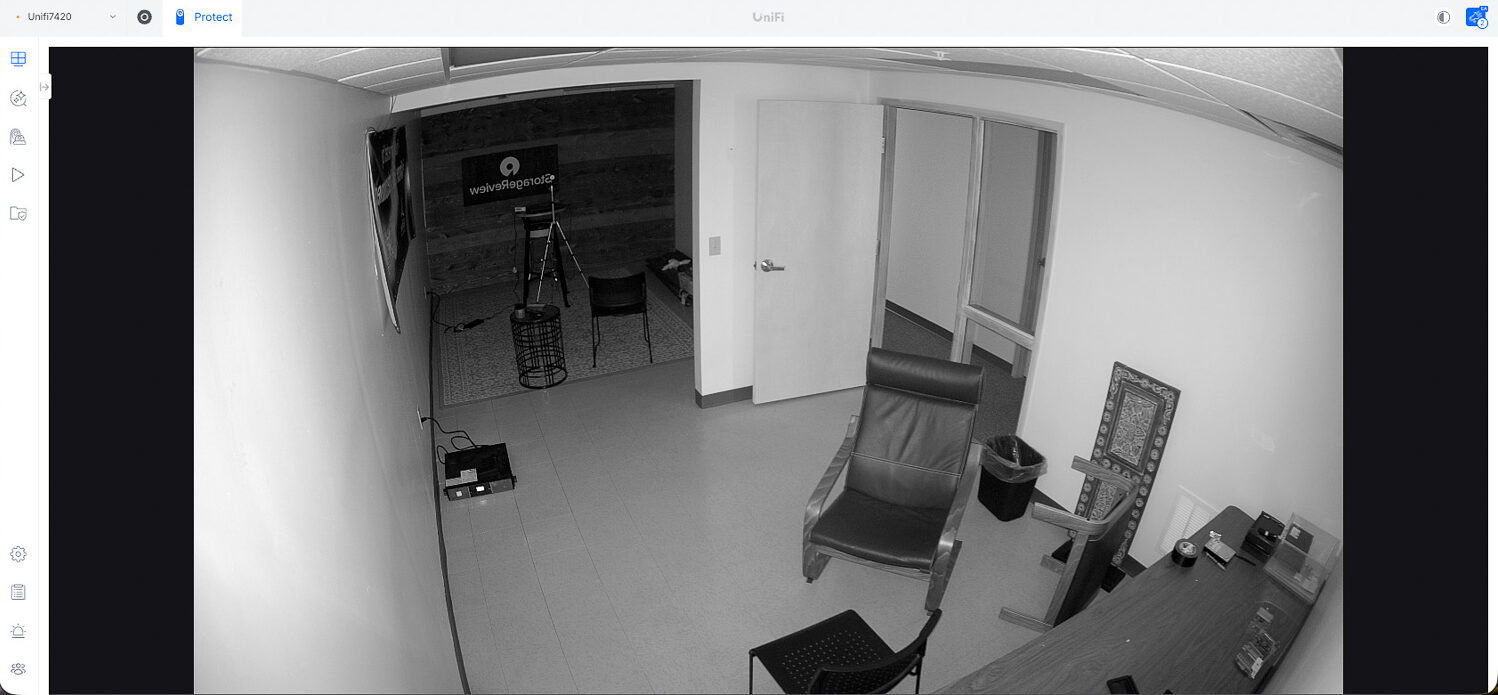
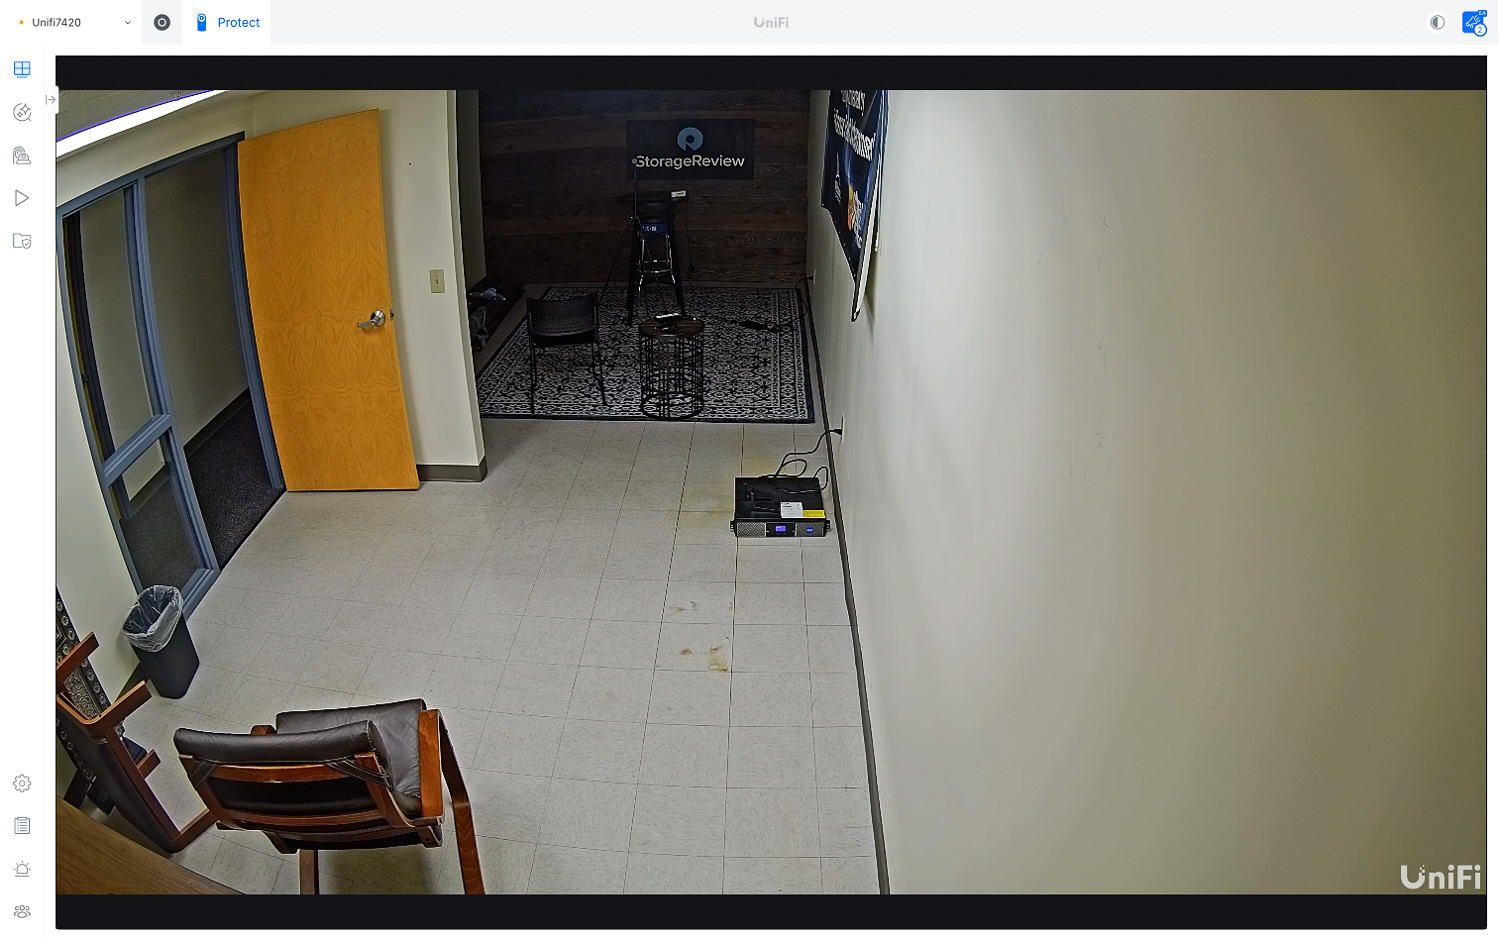
The 1/1.8″ 8MP sensor records 4K at 30 FPS with a full image settings suite including HDR, 2DNR, 3DNR, masking, and text overlay. The field of view spans 109.9 degrees horizontal and 134.1 degrees diagonal, which is wide enough to cover most fixed camera positions without needing to zoom in on subjects. Built-in IR LED illumination handles night operation out to 30 meters (98 ft), and an IR cut filter switches automatically at dusk.

ubiquiti g6 turret night vision view

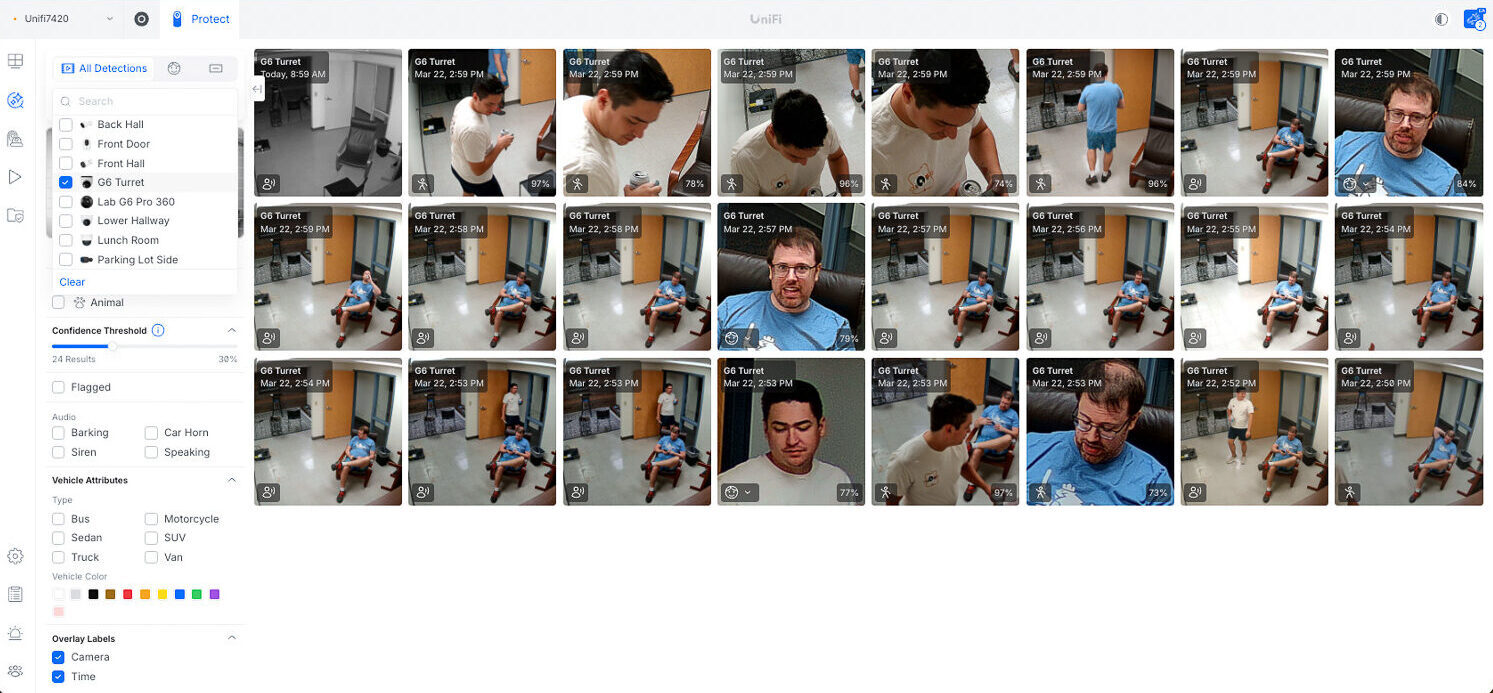
On-device AI runs via the quad-core Arm Cortex-A53 and the Multi-TOPS AI Engine. Face and license plate recognition process locally at the camera level rather than waiting on the NVR, which keeps alert latency low and reduces load on the host recorder. Smart detection monitors people, vehicles, and animals and works with Protect’s configurable zone masking to deliver targeted alerts.

in software face detection view of ubiquiti g6 turret

The fixed focal-length lens consistently covers the full field of view without barrel distortion, so identification accuracy remains high. Physical three-axis adjustment handles positioning, and once you tighten the ball joint, the framing holds reliably.

Management and Installation

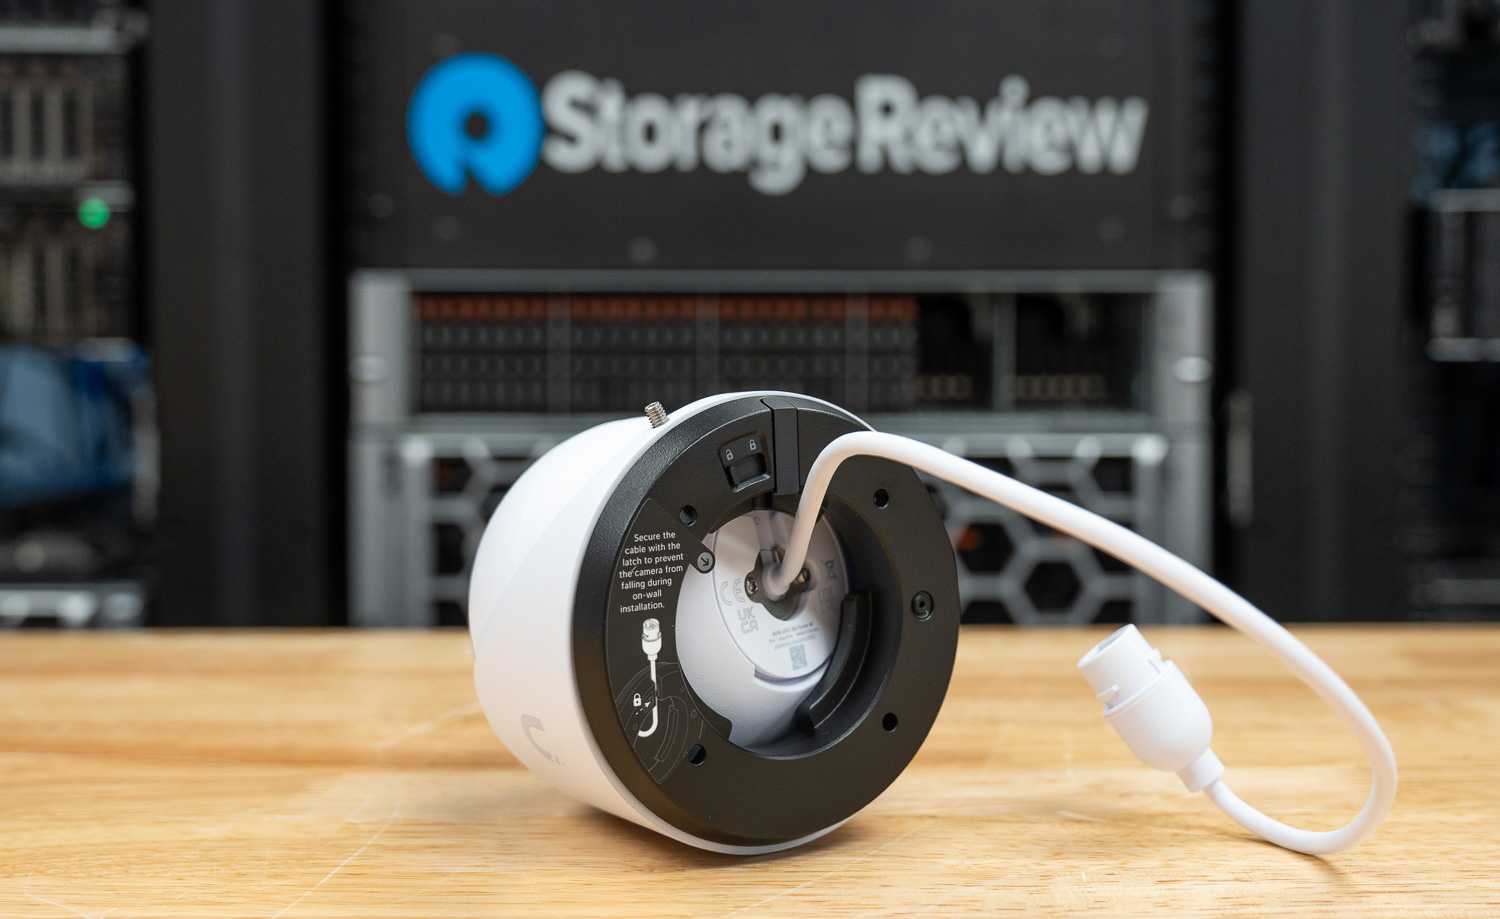
The G6 Turret operates on standard PoE with a maximum power draw of 12.5W, which stays within the 15.4W limit of 802.3af, eliminating the need for PoE+ switching. Even so, you should account for the draw when budgeting power across a dense switch. The included 30 cm (1 ft) pigtail features an RJ45 connector with a thermoplastic elastomer jacket that seals the connection cleanly at the camera body. Protect detects the camera immediately upon first power-up and then guides you through setup.

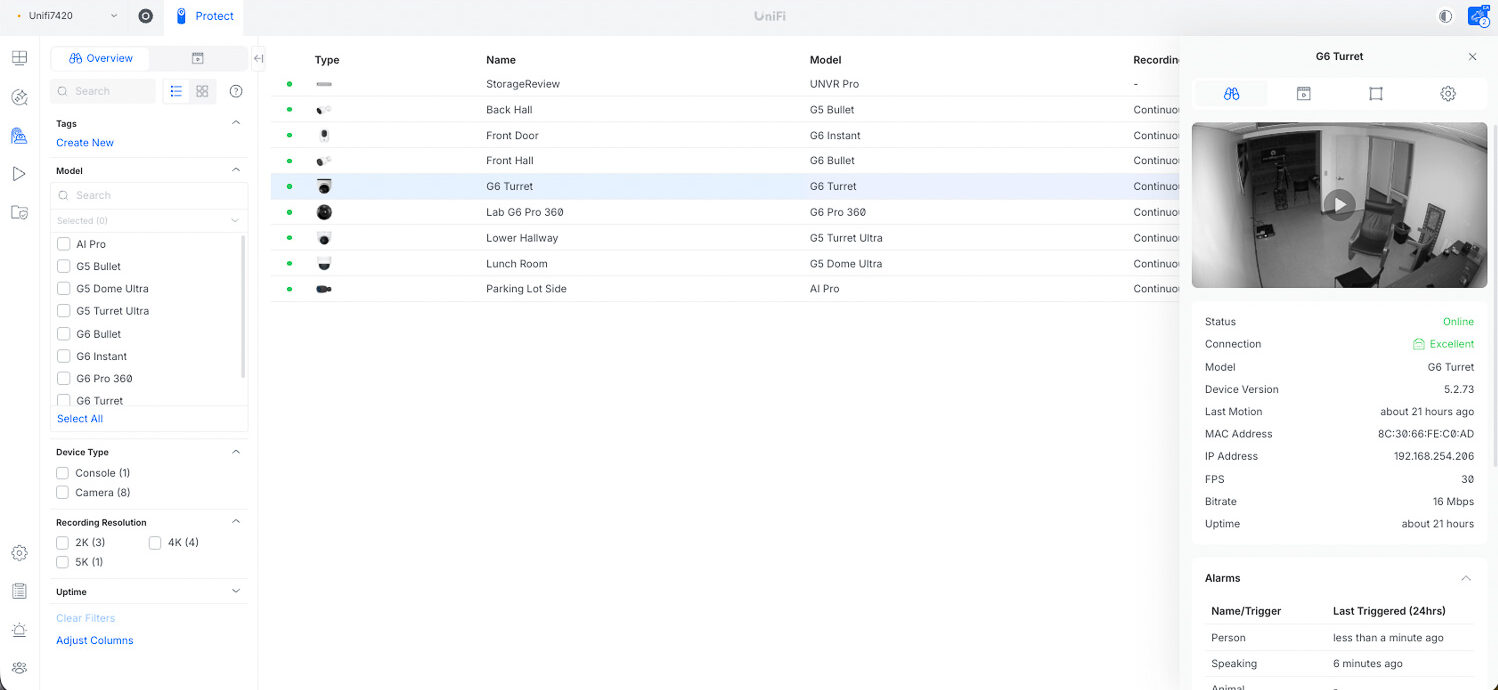
ubiquiti unifi protect software device view of g6 turret

Once you adopt the camera, the UniFi Protect dashboard provides centralized management for connection status, image tuning, and recording settings. Adjusting the framing is straightforward and takes about a minute. Loosen the collar, rotate the lens, and retighten, which is considerably faster than repositioning a fixed dome’s backplate.

alternate rear view of camera adjustment for ubiquiti g6 turret

Before deploying the G6 Turret, a few practical details are worth noting. First, Protect lets you configure motion and smart detection masks independently, so you can exclude footpaths or busy roads from triggering alerts without turning off detection across the entire frame. Second, the G6 Turret has no MicroSD slot and therefore won’t record locally if the NVR connection drops. Finally, ceiling and wall mounts come in the box, and arm, pendant, and junction box mounts are available separately for non-standard implementations.

Conclusion

Overall, the G6 Turret delivers 4K at 30 FPS, on-device face and license plate recognition, and 30-meter IR, all for $199. The three-axis manual adjustment is a genuine practical advantage in the field, especially on wall mounts, where fixed cameras require more bracket work. Additionally, on-device AI processing via the Multi-TOPS engine keeps detection fast and reduces NVR load.

Ubiquiti G6 Turret Side view

That said, the IK04 rating and the absence of local storage are worth confirming against your deployment requirements before you commit. For controlled commercial spaces, retail, and offices, those limitations rarely matter. Overall, the G6 Turret is a well-specified camera that integrates cleanly into any UniFi Protect system.

Product Page – G6 Turret

The post Ubiquiti UniFi G6 Turret Review: 4K PoE Camera with On-Device AI for $199 appeared first on StorageReview.com.

Ubiquiti UniFi AI Dome Review: On-Device Face and License Plate Recognition at $399

ubiquiti ai dome close-up view ubiquiti ai dome close-up view

Ubiquiti is expanding its edge-processing hardware lineup with the AI Dome (UVC-AI-Dome-B). The standard G-series cameras cover most general UniFi Protect deployments just fine. Still, the AI Dome targets environments that need local metadata processing without sacrificing image quality or build quality. Most notably, it handles face and license plate recognition on-device, bringing Pro-tier capabilities to a more accessible price point. Sitting between the G6 Dome and the G6 Pro, it combines 4K imaging with dedicated silicon for real-time analytics. Ubiquiti has built it to handle entry points and high-traffic areas where accurate identification matters as much as general surveillance coverage. Whether you’re covering a parking lot entrance, a corporate lobby, or a retail storefront, the AI Dome is designed with that specific kind of deployment in mind.

ubiquiti ai dome wall-mounted view

Ubiquiti Dome Lineup

At $399, the AI Dome sits in a deliberate spot between the G6 Dome and the G6 Pro. It’s aimed at users who need the advanced analytics of the Pro line but don’t want the larger footprint, optical zoom, or the elevated power requirements that come with it. Compared to the G6 Pro at its higher price point, the AI Dome trades optical zoom for on-device AI processing at a significantly lower cost. For fixed-focal-length deployments where edge AI is the priority, the price-to-feature ratio is hard to argue with.

Specification AI Dome G5 Dome G6 Dome G6 Pro Dome
Overview
Dimensions ⌀118 x 90.8 mm (⌀4.6 x 5.5″) ⌀109.2 x 64.5 mm (⌀4.3 x 2.5″) ⌀144.7x 96.3 mm (⌀5.7 x 3.8″) ⌀163.8 × 108.8 mm (⌀6.45 × 4.28″)
IR Night Vision 40 m (131 ft) 9 m (30 ft) 30 m (98 ft) 40 m (131 ft)
Zoom Mode 2.36x Optical
Face Recognition
License Plate Recognition
Smart Detections
Resolution 4K 2K 4K 4K
Field of View H: 109.9°, V: 56.7°, D: 134.1° H: 102.4°, V: 54.9°, D: 120.6° H: 109.9°, V: 56.7°, D: 134.1° Wide: H: 113.8°, V: 61.9°, D: 134°
Tele: H: 45.5°, V: 25.8°, D: 52°
Audio Microphone Two-way audio Microphone Microphone
Weatherproofing IP66 IPX4 (While Covered) IP66 IP66
Tamper Resistance IK10 IK08 IK10 IK10
Mounting Arm, ceiling, pendant, wall mount, junction box Wall, ceiling mount (Included)
Junction box, arm mount (Optional)
Ceiling, Wall mount (Included)
Gang Box Mounting Plate, Camera Dual Mount, Flush Mount, Weather Shield (Optional)
Ceiling, Wall mount (Included)
Gang Box Mounting Plate, Camera Dual Mount, Flush Mount, Weather Shield (Optional)
UniFi Application Suite
Protect
Performance
Networking Interface GbE RJ45 port 10/100 MbE RJ45 port 10/100 MbE RJ45 port GbE RJ45 port
Video
Image Settings Color, brightness, sharpness, contrast, white balance, exposure control, 2DNR, 3DNR, NR by motion, masking, text overlay, HDR Color, brightness, sharpness, contrast, white balance, exposure control, 2DNR, 3DNR, NR by motion, masking, text overlay Color, brightness, sharpness, contrast, white balance, exposure control, 2DNR, 3DNR, NR by motion, masking, text overlay, HDR Color, brightness, sharpness, contrast, white balance, exposure control, 2DNR, 3DNR, NR by motion, masking, text overlay, HDR
Max. Frame Rate 30 FPS 30 FPS 30 FPS 30 FPS
Resolution 8MP 3840 x 2160 (16:9) 4MP 2688 x 1512 (16:9) 8MP 3840 x 2160 (16:9) 8MP 3840 x 2160 (16:9)
Optics
Sensor 1/1.8″ 8MP 5MP CMOS 1/1.8″ 8MP 1/1.2″ 8MP
Lens Fixed focal length Fixed focal length Fixed focal length F 5.9-13.8 mm; ƒ/1.5-ƒ/2.9
Night Mode Built-in IR LED illumination and IR cut filter Built-in IR LED illumination and IR cut filter Built-in IR LED illumination and IR cut filter Built-in adaptive IR LED illumination and IR cut filter
Hardware
Max. Power Consumption 10W 5W 9.25W 15W
Supported Voltage Range 42.5 – 57V DC 37 – 57V DC 37 – 57V DC 42.5 – 57V DC
Power Method PoE PoE PoE PoE+
Processor Quad-core Arm® Cortex®-A53 based chip Dual-core Arm® Cortex®-A7 based chip Quad-core Arm® Cortex®-A53 based chip Quad core Arm® Cortex®-A53 based chip
Weight 700 g (1.5 lb) Without mount: 370 g (13.1 oz)
With mount: 390 g (13.8 oz)
820 g (1.8 lb) 1.2 kg (2.6 lb)
Enclosure Material Aluminum alloy, polycarbonate Aluminum alloy, polycarbonate, hard-coated dome Aluminum alloy Aluminum alloy, polycarbonate
Mount Material Surface mount: polycarbonate Polycarbonate, stainless steel Polycarbonate Stainless steel
Expansion Slot MicroSD Card MicroSD card
Ambient Operating Temperature -30 to 50° C (-22 to 122° F) -20 to 40° C (-4 to 104° F) -20 to 50º C (-4 to 122º F) -20 to 50º C (-4 to 122º F)
Ambient Operating Humidity 0 to 90% noncondensing 0 to 90% noncondensing 0 to 90% noncondensing 0 to 90% noncondensing
NDAA Compliant
Certifications CE, FCC, IC CE, FCC, IC CE, FCC, IC CE, FCC, IC

Design and Build

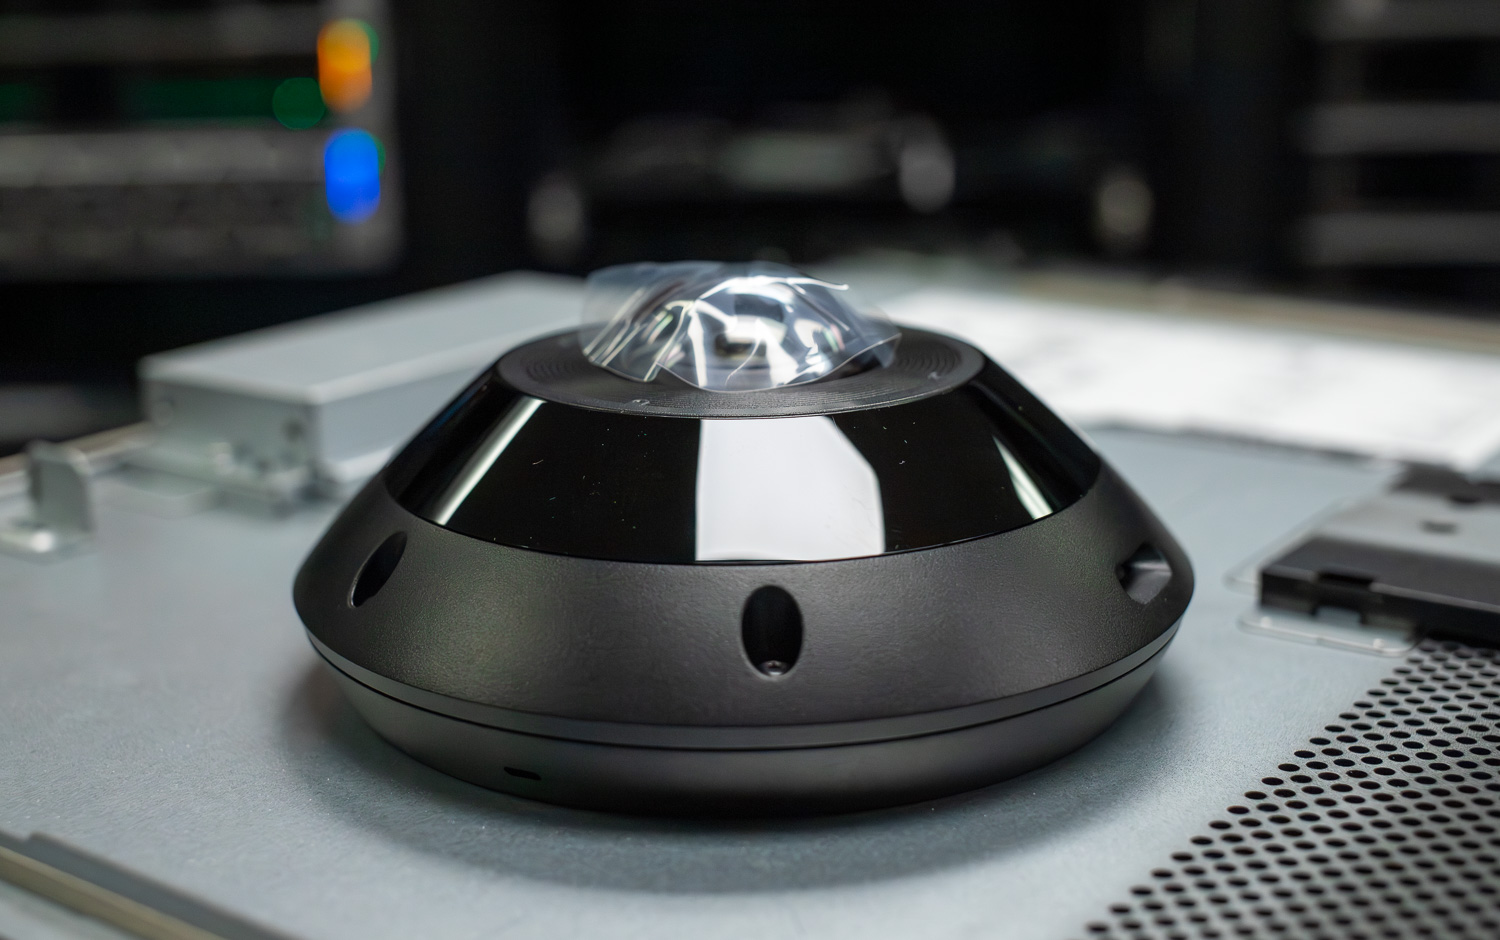
The AI Dome is built from aluminum alloy and polycarbonate; it feels solid and well-constructed. At ⌀118 x 90.8 mm and 700 g (1.5 lb), it’s noticeably more compact and lighter than the G6 Pro, making installation easier in tighter spaces where you don’t have much room to work. That said, it still has a reassuring heft that feels consistent with the build quality you’d expect at this price.

The black colorway (UVC-AI-Dome-B) is a welcome option for commercial environments with dark ceilings, exterior eaves, or modern interior fitouts where white hardware would stand out too much. It blends cleanly into the architecture, and that’s an easy factor to underestimate in retail and hospitality settings. Beyond aesthetics, the surface-mount unit that ships in the box is made of polycarbonate and performs well in standard installation scenarios. For cleaner ceiling installations, the optional Flush Mount ($39.00) lets you recess the housing directly into the ceiling tile, significantly lowering the camera’s profile and giving it a more integrated look.

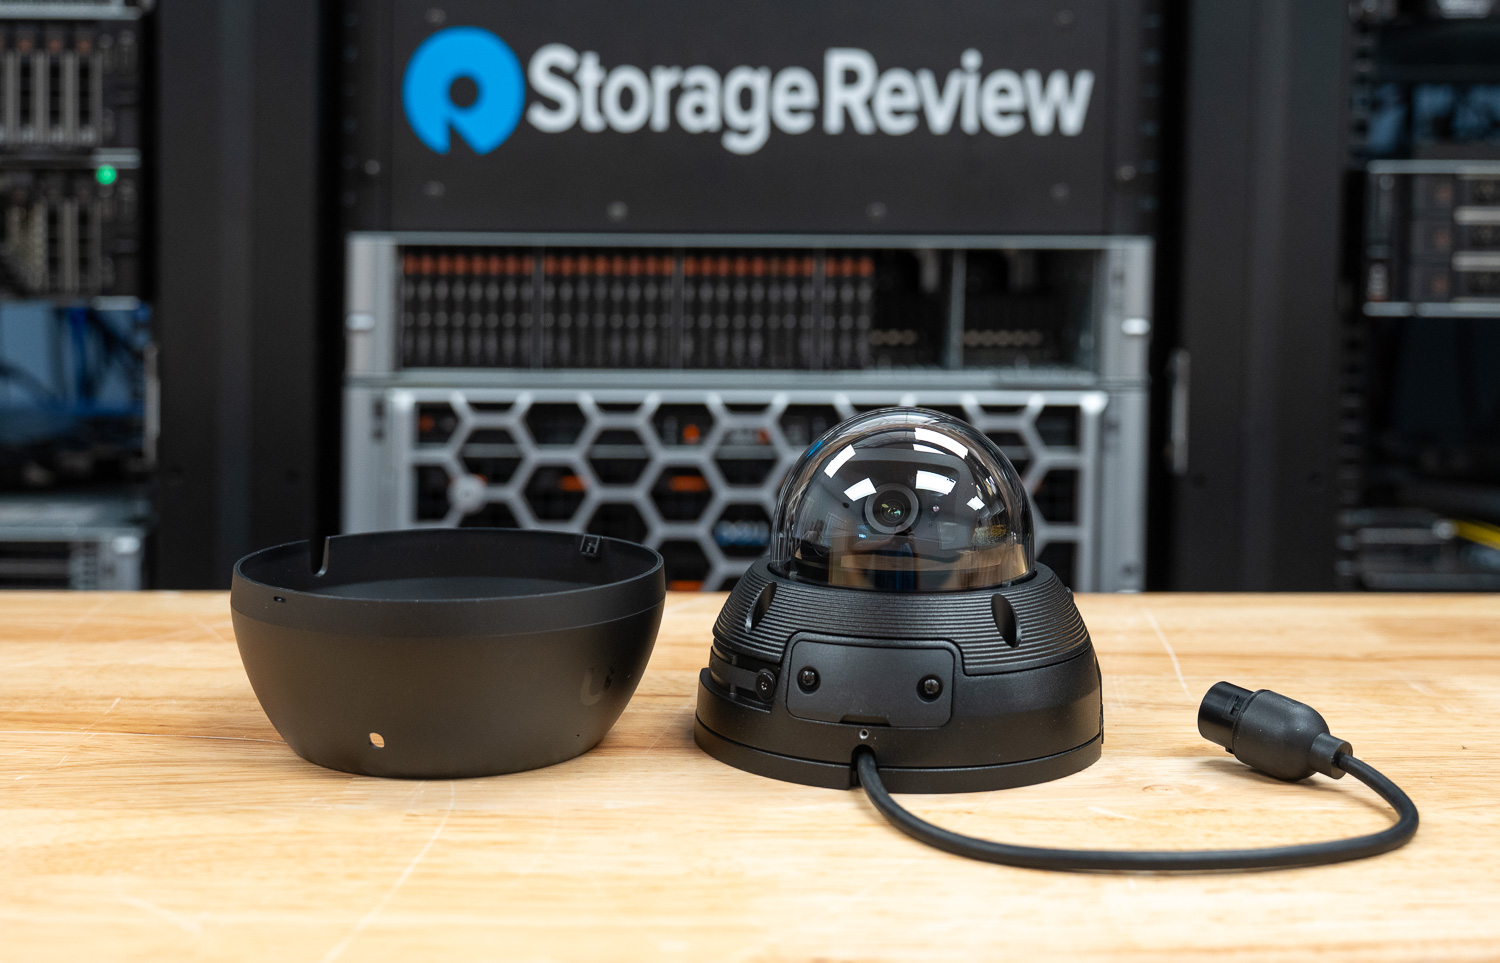
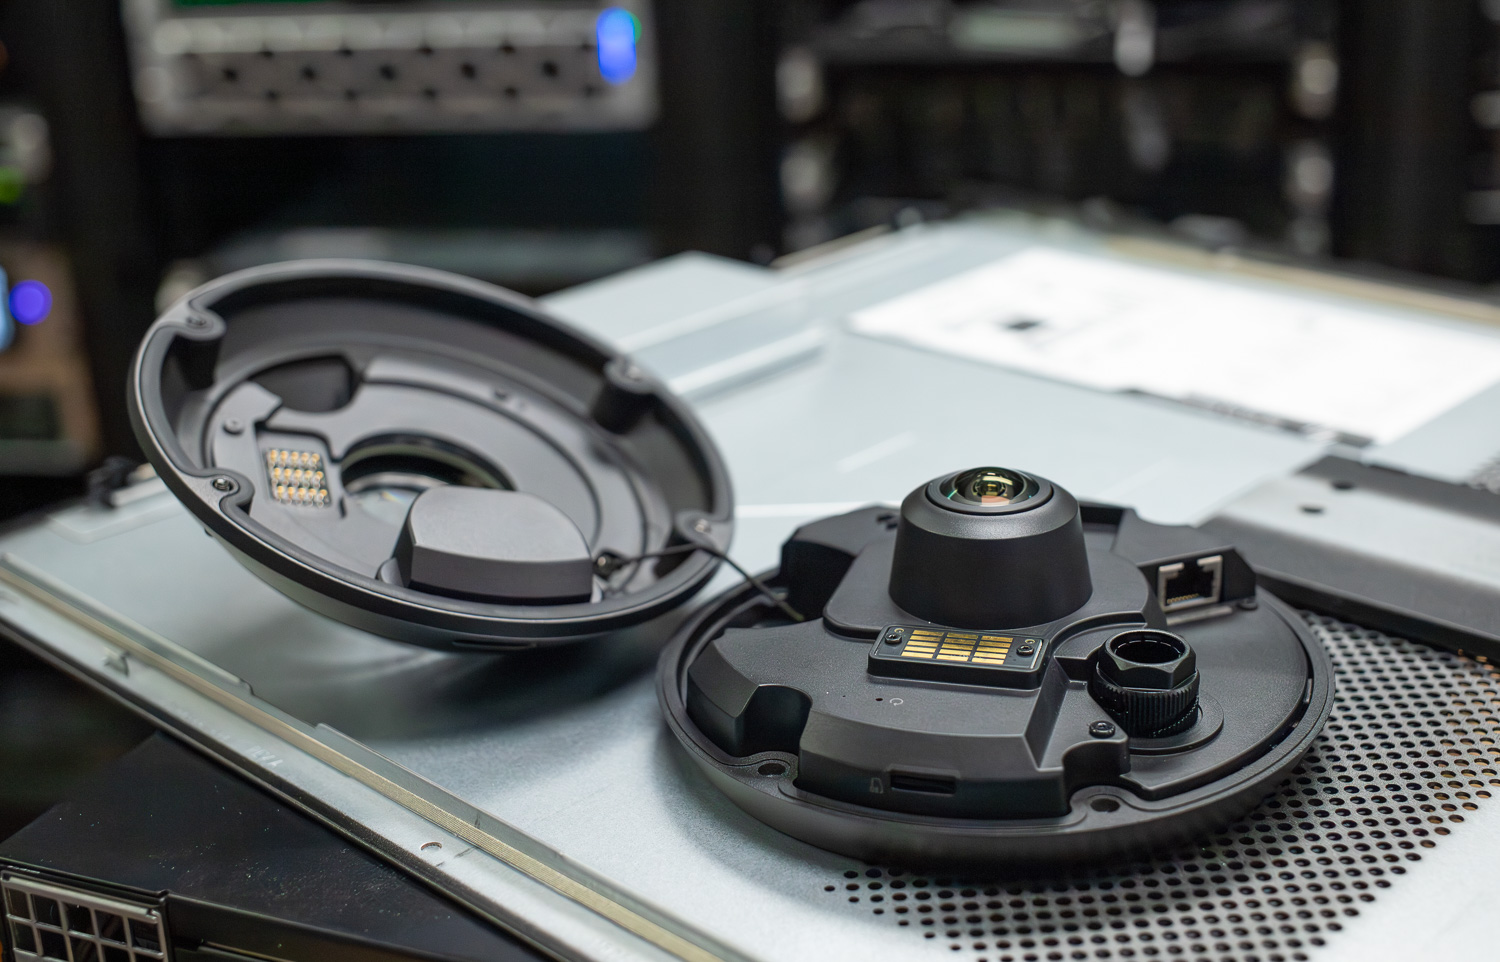
ubiquiti ai dome disassembled

On the durability side, the IP66 weatherproofing and IK10 tamper-resistance ratings mean the AI Dome handles fully exposed installations without issue. That’s a step up from the G5 Dome, which only carries an IPX4 rating and needs a cover to stay weather-protected. In contrast, the AI Dome can enter low-clearance, publicly accessible areas and hold up well against both the elements and physical interference. The operating temperature range of -30 to 50 degrees C (-22 to 122 F) is the widest in the dome lineup, so it works in climates where the rest of the G-series would hit its limits. For outdoor deployments in cold regions in particular, that extra headroom is worth noting.

ubiquiti ai dome close-up view

Optics & AI

The AI Dome uses a 1/1.8″ 8MP sensor and shoots 3840 x 2160 at 30 FPS with HDR support. While it doesn’t carry the larger 1/1.2″ sensor found in the G6 Pro, it still matches the G6 Pro’s 40-meter (131 ft) IR night vision range, which is a strong result at this price point. For context, the G6 Dome only reaches 30 meters, and the G5 Dome tops out at just 9 meters, so the AI Dome sits clearly at the top of the lineup when it comes to night imaging distance. For a fixed dome without optical zoom, IR reach is useful in larger open spaces.

ubiquiti ai dome camera view, scary looking podcast room

Beyond raw resolution, the fixed-focal-length lens covers 109.9 degrees horizontally and 134.1 degrees diagonally, matching the G6 Dome’s field of view exactly. Importantly, it handles that wide angle without the barrel distortion you’d normally expect from a lens at this width. That matters because when you’re relying on footage for face or plate identification, image geometry directly affects how well recognition algorithms perform. The HDR support further helps in high-contrast environments, such as covered parking entrances or lobby doorways, where bright outdoor light meets a darker interior.

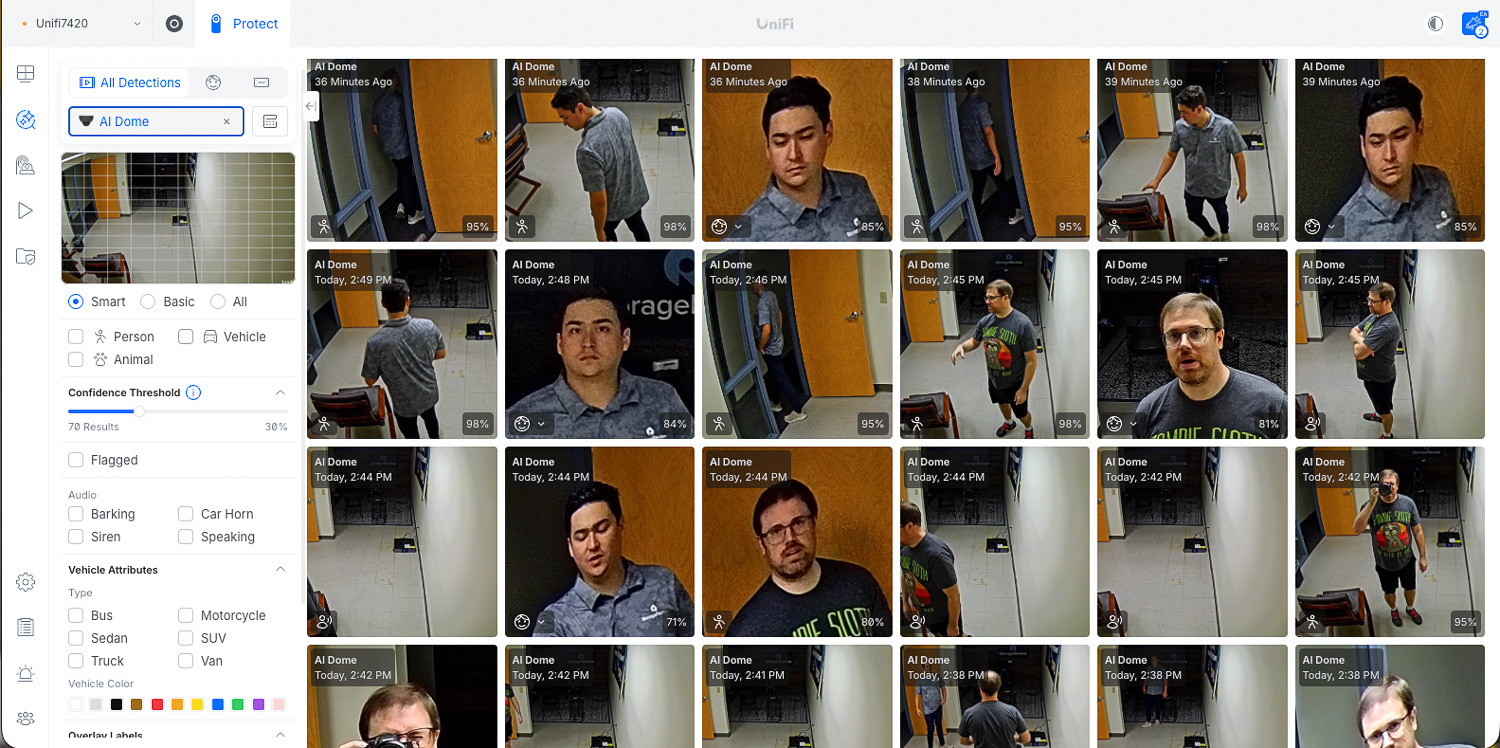
The biggest differentiator, though, is on-device processing. The quad-core Arm Cortex-A53 handles Face Recognition and License Plate Recognition directly at the camera, rather than pushing that work to the NVR or Dream Machine. In practice, this means faster detection alerts, lower CPU load on the recorder, and lower sustained bandwidth usage across the deployment. This is especially noticeable in larger multi-camera setups where the NVR’s processing headroom can become a real constraint. Beyond performance, it also opens up more useful automation options. For example, you can set up “unrecognized face” alerts to fire only after hours, or LPR notifications to trigger only for plates not on an approved list. That kind of context-aware control is ultimately where the AI Dome earns its place in the lineup over a standard 4K dome.

face detection ubiquiti ai dome

Management and Installation

Getting the AI Dome up and running is straightforward. It runs on standard PoE, not PoE+, and pulls a maximum of 10W under full load, so it’s easy to budget on most enterprise switches without needing to plan around higher-draw ports. The included 30 cm (1 ft) cable features an RJ45 connector and a thermoplastic elastomer jacket, with the jacket enclosure providing a clean, weatherproof termination at the camera body. Once you plug it in, Protect picks it up immediately and steps you through configuration. The GbE port is also a meaningful upgrade over the 10/100 MbE found on the G5 and G6 Dome, giving the camera enough headroom to handle 4K throughput and AI processing simultaneously while ensuring the AI Dome won’t become a bottleneck in network infrastructure where faster switching is already in place.

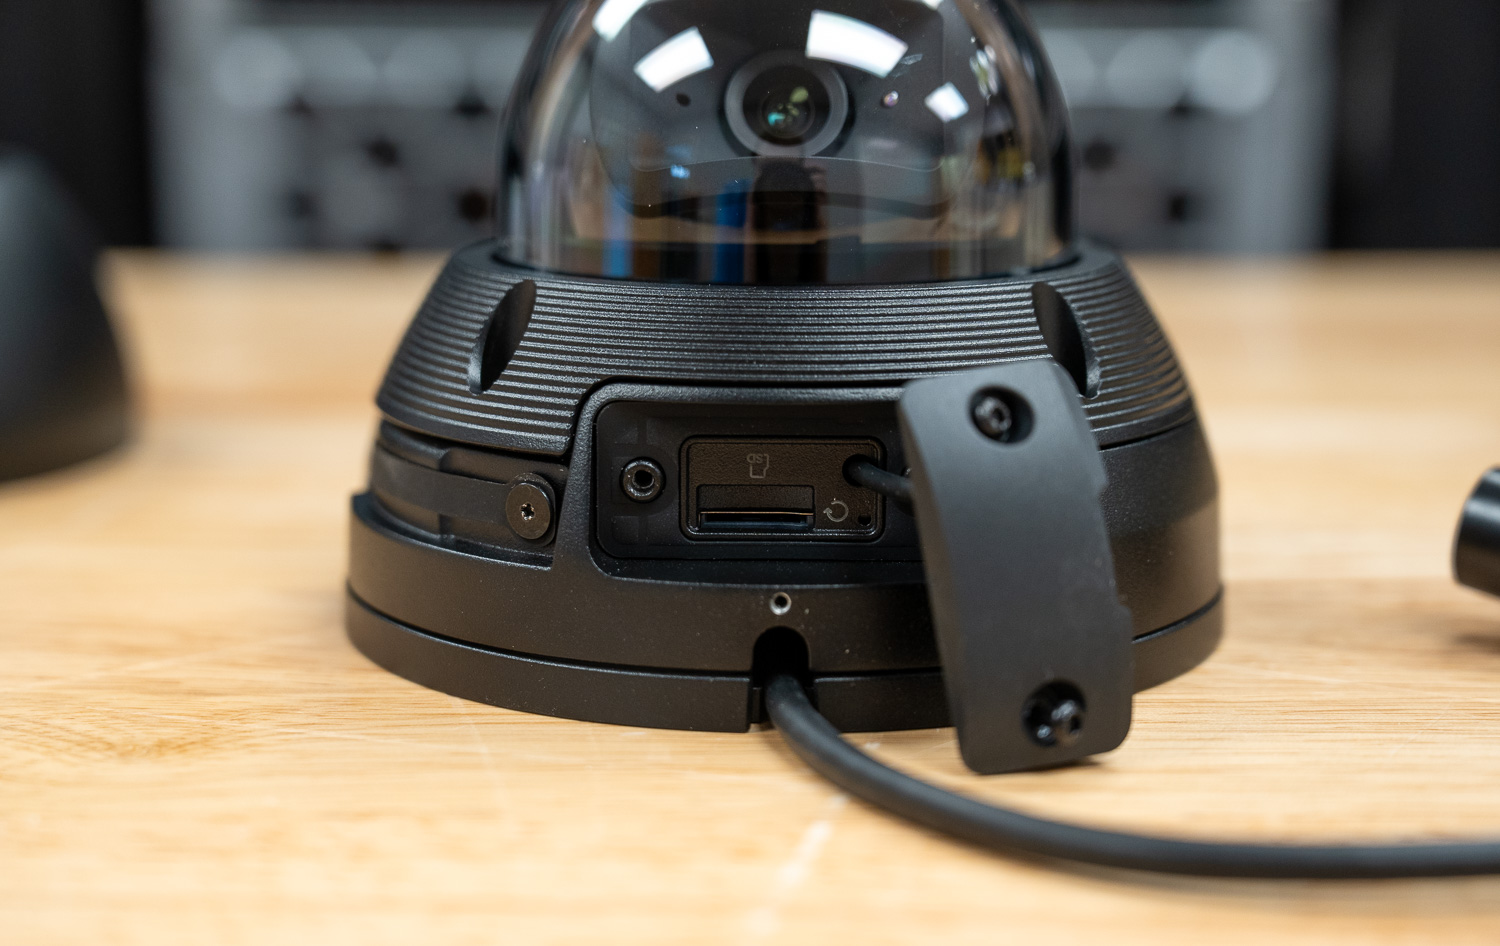
port view of ubiquiti ai dome

A few additional management features are worth calling out. The MicroSD slot enables local on-device recording as a storage failover. If the switch drops or the NVR connection goes down, the camera keeps recording and holds onto the footage until the connection comes back. That’s a useful safety net for critical locations, and it’s something neither the G5 Dome nor the G6 Dome can offer since neither includes an expansion slot. Detection zones can also be drawn separately for motion and smart detection, which helps reduce false positives from foot traffic, passing cars, or other movement outside the area you care about. In busy environments, this kind of tuning makes a significant difference in the day-to-day usefulness of the alert system. On the mounting side, the box includes a standard surface mount for ceiling and wall scenarios, with optional accessories including a Flush Mount ($39.00) for a recessed ceiling profile, Weather Shield ($29.00), Dual Mount ($59.00), Ethernet Surge Protection ($12.50), and High Capacity microSD Cards starting at $49.00 for those who need extra resilience or local storage in the field.

Conclusion

The AI Dome fills a gap in the UniFi camera lineup. It brings face recognition, license plate recognition, and full smart detection down to a more accessible price point without cutting corners on build quality or imaging performance. At $399, it’s a practical choice for anyone who needs AI-driven alerts but doesn’t need optical zoom and doesn’t want to pay the G6 Pro premium or deal with its higher power requirements. Notably, the combination of a GbE port, MicroSD failover, and on-device AI processing at 10W is competitive for what this class of camera costs elsewhere.

Overall, it works well for retail entrances, parking lots, corporate lobbies, or anywhere identification accuracy matters as much as general coverage. The wide temperature range, IP66/IK10 ratings, and MicroSD failover recording also make it a credible option for real-world deployments, not just clean indoor installs. On top of that, the black colorway gives it the versatility that standard white dome cameras lack in environments where blending in matters.

If you need optical zoom or native UniFi Protect support, the G6 Pro is still the right pick. However, if a fixed focal length covers your use case and you want on-device AI without the bulk and cost of the Pro tier, the AI Dome is a well-rounded, practical solution that’s hard to overlook at this price point.

Product Page – AI Dome

The post Ubiquiti UniFi AI Dome Review: On-Device Face and License Plate Recognition at $399 appeared first on StorageReview.com.

Ubiquiti UniFi G6 Pro 360 Review: Full-Room Coverage from a Single Camera

ubiquiti g6 pro 360 on top of a server, side view ubiquiti g6 pro 360 on top of a server, side view

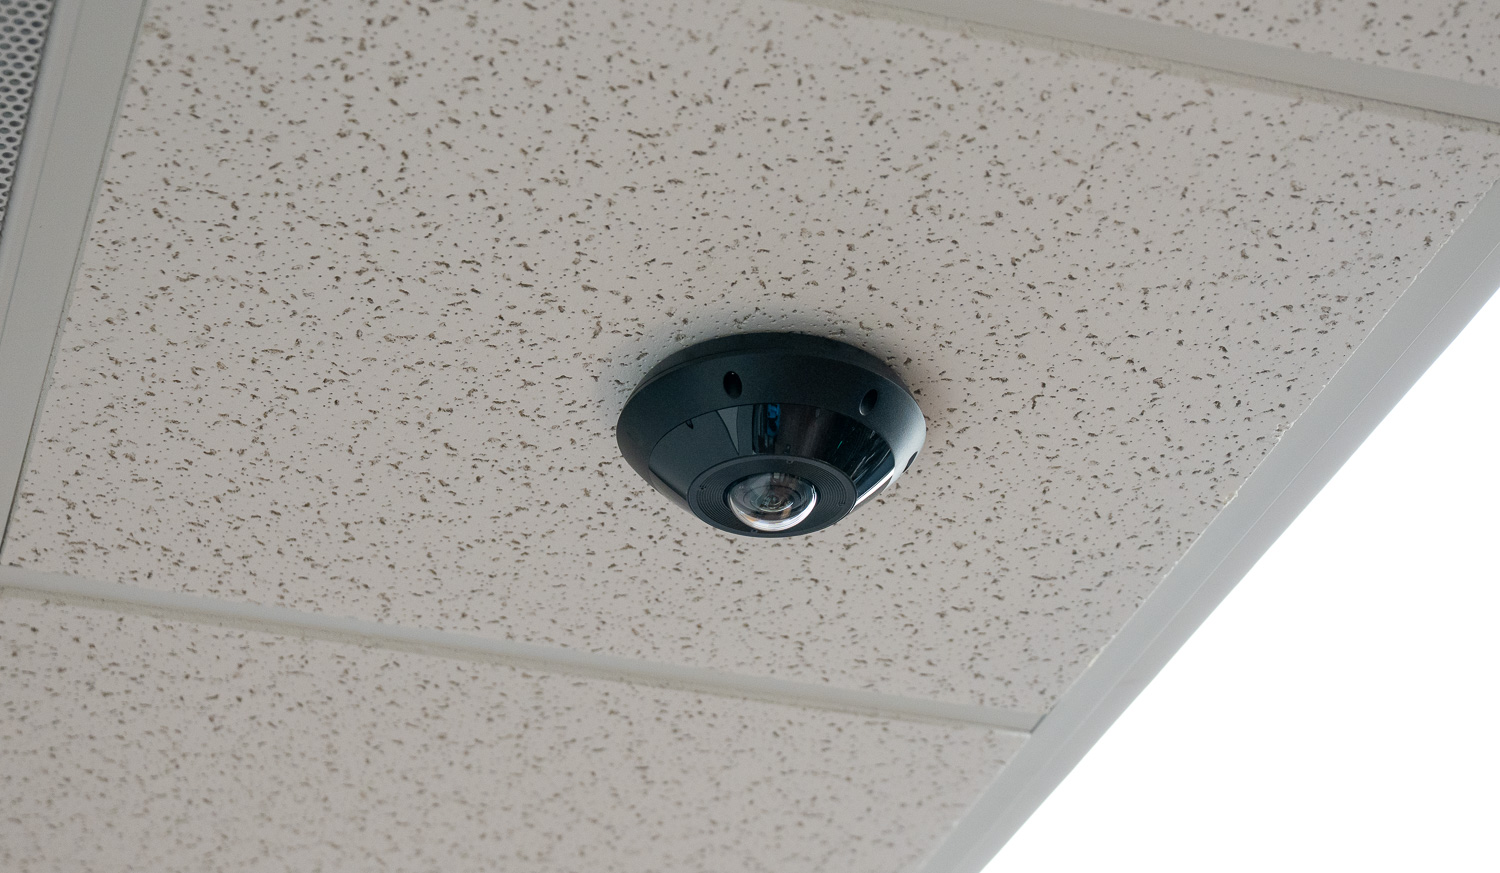
Ubiquiti is adding a compelling new option to its UniFi Protect camera lineup with the G6 Pro 360 (UVC-G6-Pro-360). Rather than covering a specific zone or doorway like a standard dome camera, the G6 Pro 360 takes a fundamentally different approach by capturing the entire scene in a single 360-degree field of view. Most notably, it does this at 12MP resolution with smart IR, two-way audio, and full UniFi Protect integration, all from a single PoE camera. In other words, instead of mounting multiple cameras to cover a room from different angles, a single unit covers the entire space. Whether you’re managing a warehouse floor, an open office, a retail sales floor, or any large interior space with no natural blind spots to hide in, the G6 Pro 360 is built for exactly that kind of wide-open deployment.

ubiquiti g6 pro 360 on top of a server, side view

360 Lineup

At $499, the G6 Pro 360 occupies a specific and intentional position in the UniFi camera lineup. It doesn’t compete directly with directional dome cameras or bullet-style units. Instead, it serves as area awareness rather than targeted coverage. For environments where you’d otherwise need two or three cameras to cover the same ground, a single G6 Pro 360 can often do the job more cleanly and at a lower total cost. That said, it relies on face recognition and license plate recognition to function, so it performs best with directional AI cameras at entry points rather than as a standalone identification tool. With that context in mind, the value proposition becomes much clearer that this is a camera for coverage, not identification.

Metric G6 Pro 360 AI 360 AI Multi Sensor 4
Overview
Dimensions ⌀147 x 65.5 mm (⌀5.8 x 2.6″) ⌀147 x 49 mm (⌀5.8 x 1.9″) ⌀255 x 105 mm (⌀10.04 x 4.13″)
IR Night Vision 15 m (50 ft) Smart IR (4x controllable zones) 9 m (30 ft) 20 m (65 ft)
Zoom Mode 2.33x Optical
Face Recognition
License Plate Recognition
Smart Detections (People, Vehicles, Animals)
Resolution 12MP 2K 32MP
Field of View H: 180°, V: 180°, D: 180° 360° Wide: H: 108.8°, V: 57.6°, D: 130.8°
Tele: H: 42.8°, V: 24.1°, D: 49.1°
Audio Two-way audio Two-way audio
Weatherproofing IP66 IPX4 (While Covered) IP66
Tamper Resistance IK10 IK08 IK10
Mounting Surface Mount (Included), AI 360 Junction Box, Camera Dual Mount, Arm Mount (Optional) Surface mount (Included), Junction box (Optional) Ceiling mount (Included), Pole, Corner, Arm, Pendant mount (Optional)
UniFi Application Suite
Protect
Performance
Networking Interface 10/100 MbE RJ45 port GbE RJ45 port GbE RJ45 port
Video
Image Settings Color, brightness, sharpness, contrast, white balance, exposure control, 2DNR, 3DNR, NR by motion, masking, text overlay, HDR Color, brightness, sharpness, contrast, white balance, exposure control, 2DNR, 3DNR, masking, text overlay Color, brightness, sharpness, contrast, white balance, exposure control, 2DNR, 3DNR, NR by motion, masking, text overlay, HDR
Max. Frame Rate 24 FPS 30 FPS 30 FPS
Resolution 12MP 3504 x 3504 (1:1) 4MP 1920 x 1920 (1:1) (4) 8MP 3840 x 2160 (16:9)
Optics
Sensor 1/1.6″ 12MP 5MP CMOS 1/2.8″ 8MP
Lens Fisheye lens Fisheye lens (4) F 3.18-7.42 mm; ƒ/1.8-ƒ/2.8
Night Mode Built-in IR LED illumination and IR cut filter Built-in IR LED illumination and IR cut filter Built-in (16) IR LEDs with adaptive control
Hardware
Max. Power Consumption 7.14W 8.64W 34.6W
Supported Voltage Range 37 – 57V DC 37 – 57V DC 42.5 – 57V DC
Power Method PoE+ PoE PoE++
Processor Quad-core Arm® Cortex®-A53 based chip Quad-core Arm® Cortex®-A53 based chip Dual core Arm® Cortex®-A76 based chip
Weight 610 g (1.3 lb) Without mount: 655 g (1.4 lb)
With outdoor accessory: 685 g (1.5 lb)
2.4 kg (5.3 lb)
Enclosure Material Aluminum alloy, polycarbonate Aluminum alloy, polycarbonate, hard-coated dome Aluminum alloy, polycarbonate
Mount Material Polycarbonate Polycarbonate, stainless steel Powder-coated aluminum alloy
Expansion Slot MicroSD card (2) MicroSD card, (1) M.2 2280 SATA SSD
Ambient Operating Temperature -30 to 50° C (-22 to 122° F) -20 to 40° C (-4 to 104° F) -20 to 50° C (-4 to 122° F)
Ambient Operating Humidity 0 to 90% noncondensing 0 to 90% noncondensing 0 to 90% noncondensing
NDAA Compliant
Certifications CE, FCC, IC CE, FCC, IC CE, FCC, IC

Design and Build

The G6 Pro 360 uses the same aluminum alloy and polycarbonate construction that runs across the G6 lineup, and it feels appropriately solid for a camera at this price point. At ⌀147 x 65.5 mm and 610 g (1.3 lb), it’s one of the lighter cameras in the Pro-tier range, making ceiling installation straightforward in most scenarios. The low-profile disc shape is intentional because of the fisheye lens it contains, and as a result, the overall size is surprisingly compact for its capabilities.

general internal view of the ubiquiti g6 pro 360

The black colorway suits the G6 Pro 360 for the same reasons it works on the recently reviewed AI Dome. In commercial spaces with darker ceilings or modern fitouts, it blends into the environment far more naturally than a white dome. Similarly, that low visual profile matters in settings like restaurants, gyms, or co-working spaces where the camera needs to be present but shouldn’t draw attention.

On the durability front, the G6 Pro 360 features IP66 weatherproofing and an IK10 tamper-resistance rating, putting it on a par with the AI Dome and G6 Pro in terms of environmental and physical resilience. As a result, it handles outdoor deployment without any issue. Furthermore, the -30 to 50 °C (-22 to 122 °F) operating temperature range gives it the same broad climate tolerance as the rest of the top-tier lineup, a meaningful advantage over cameras like the AI 360, which is limited to -20 °C at the low end. For covered outdoor areas like parking garages, loading docks, or building overhangs, these combined ratings make it a genuinely versatile option.

ubiquiti g6 pro mounted on the ceiling

Optics and Coverage

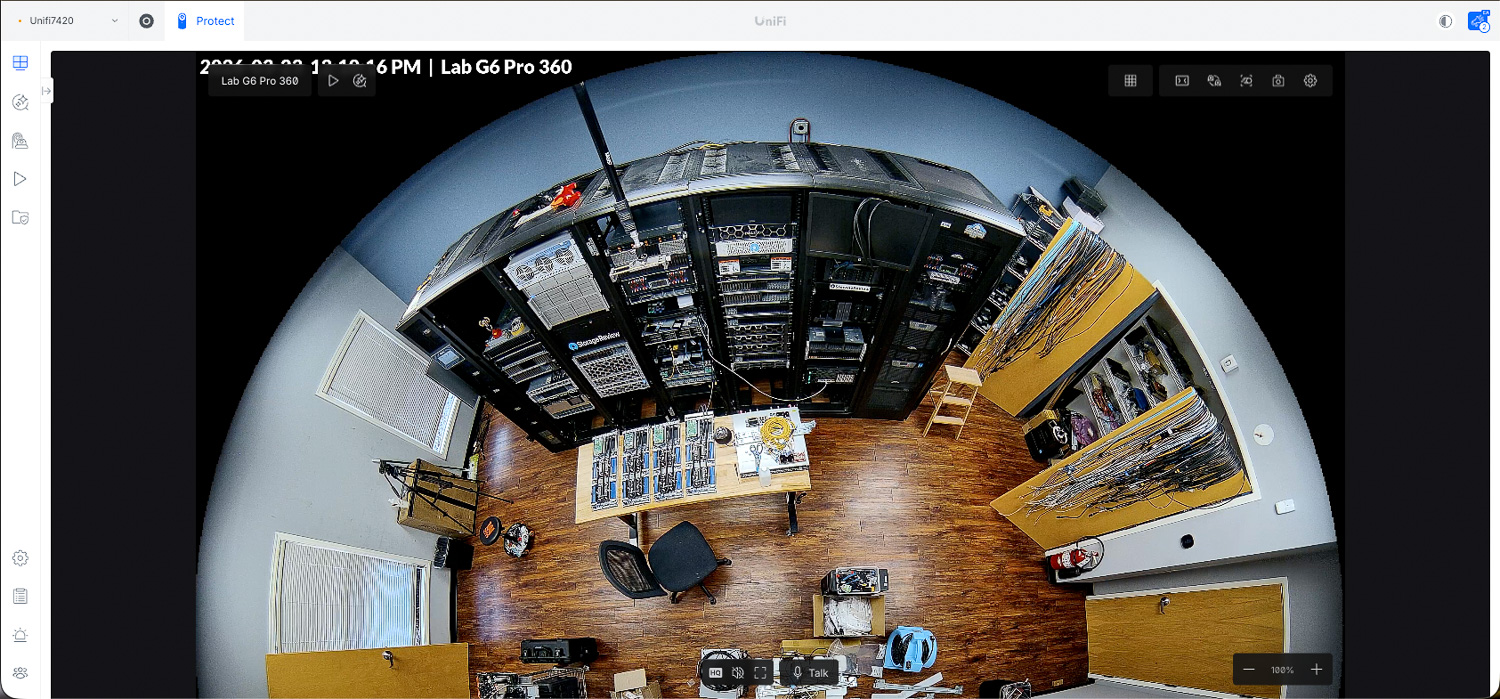
The headline spec here is the 1/1.6″ 12MP sensor capturing a native 3504 x 3504 square resolution through a fisheye lens. That 1:1 aspect ratio is important because it means the camera captures a full 180-degree hemisphere rather than cropping or stretching a rectangular frame to simulate panoramic coverage. In practice, when you view the dewarped output in UniFi Protect, you get a wide, usable panoramic image with good detail across the full scene. At 12MP, there’s enough pixel density in that view to digitally zoom into specific areas of the frame without the image completely falling apart, which is something a 2K or 4MP 360 camera can’t offer.

ubiquiti g6 pro 360 mounted camera view of the lab

Beyond the raw resolution, the digital pan-tilt-zoom functionality in Protect is what makes this camera useful for day-to-day monitoring. Rather than relying on a physical PTZ mechanism, the G6 Pro 360 lets operators pan and zoom through the scene entirely in software, without any moving parts to maintain or fail over time. This also means you can set up multiple virtual camera views from the same physical unit, each focused on a different zone of the room simultaneously. In short, one camera can effectively act as several for monitoring purposes.

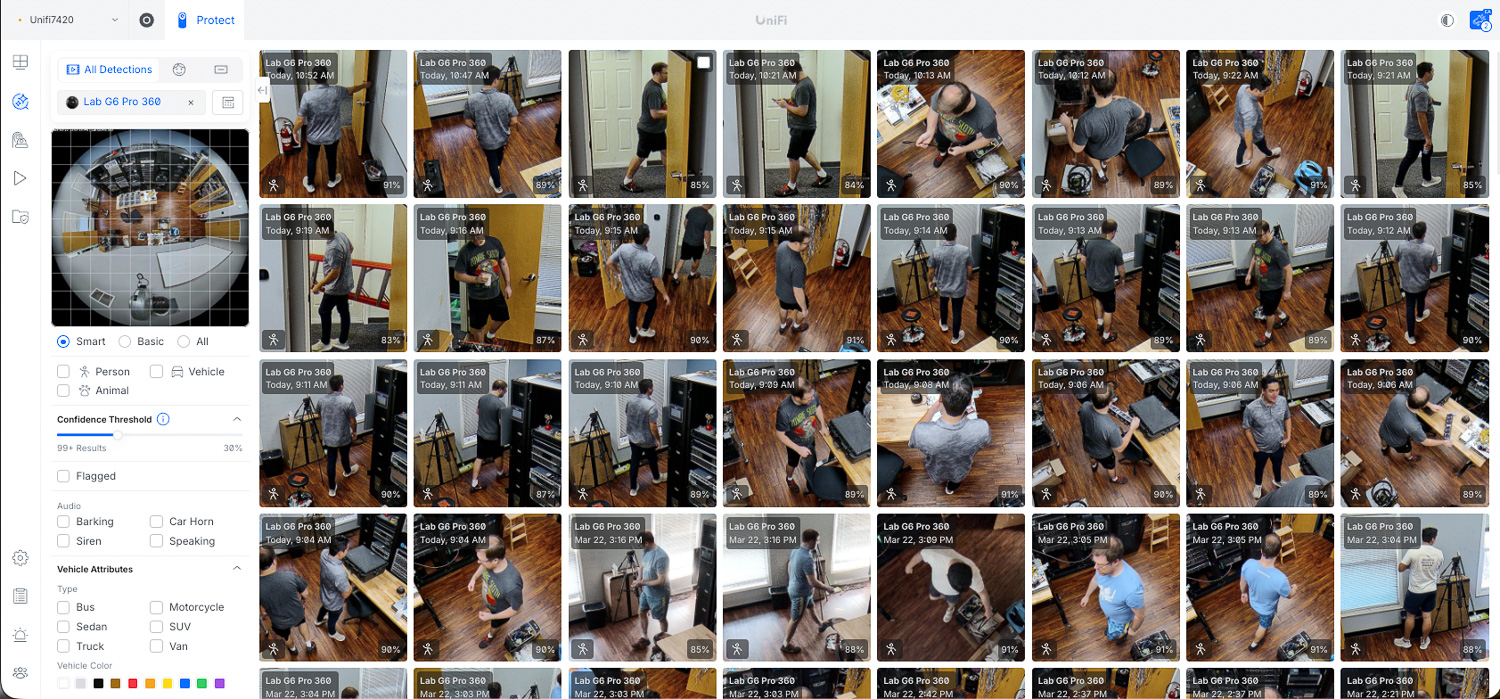
photos of face and person detection in software for ubiquiti g6 pro 360

The Smart IR implementation is also worth highlighting specifically. Rather than a single fixed IR illumination field, the G6 Pro 360 uses four independently controllable IR zones that adjust to match where activity occurs in the scene. In practice, this reduces the overexposure and hotspot issues that typically plague 360-degree cameras with uniform IR output at close range. That said, the 15-meter (50 ft) IR range is on the shorter side compared to the AI Dome’s 40-meter reach, so it’s best suited to indoor spaces or compact outdoor areas rather than large open yards or car parks.

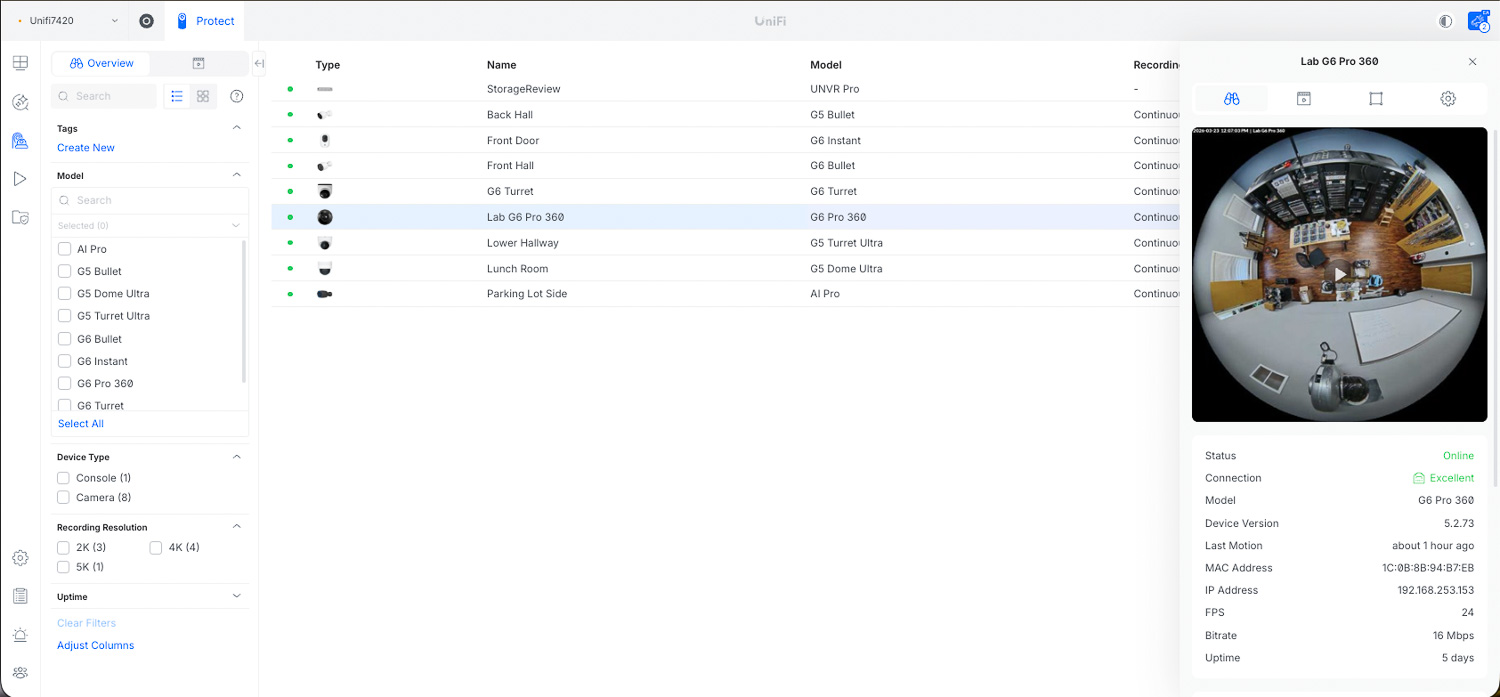
protect preview in software of ubiquiti g6 pro 360

Additionally, HDR support, along with the full image settings suite (including 2DNR, 3DNR, NR by motion, and masking), provides administrators with effective tools to optimize image quality in difficult lighting conditions. Spaces with mixed natural and artificial light, like large retail floors or warehouses with skylights, are where these controls make the most noticeable difference.

Management and Installation

Installation follows the same simple process as the rest of the UniFi camera lineup. The G6 Pro 360 runs on PoE+, which is worth noting up front, as it requires a PoE+-capable switch port rather than a standard PoE port. Despite that requirement, the camera draws only a maximum of 7.14W under full load, which is lower than several standard PoE cameras in the lineup. In other words, the PoE+ classification here is more about voltage headroom than actual power demand.

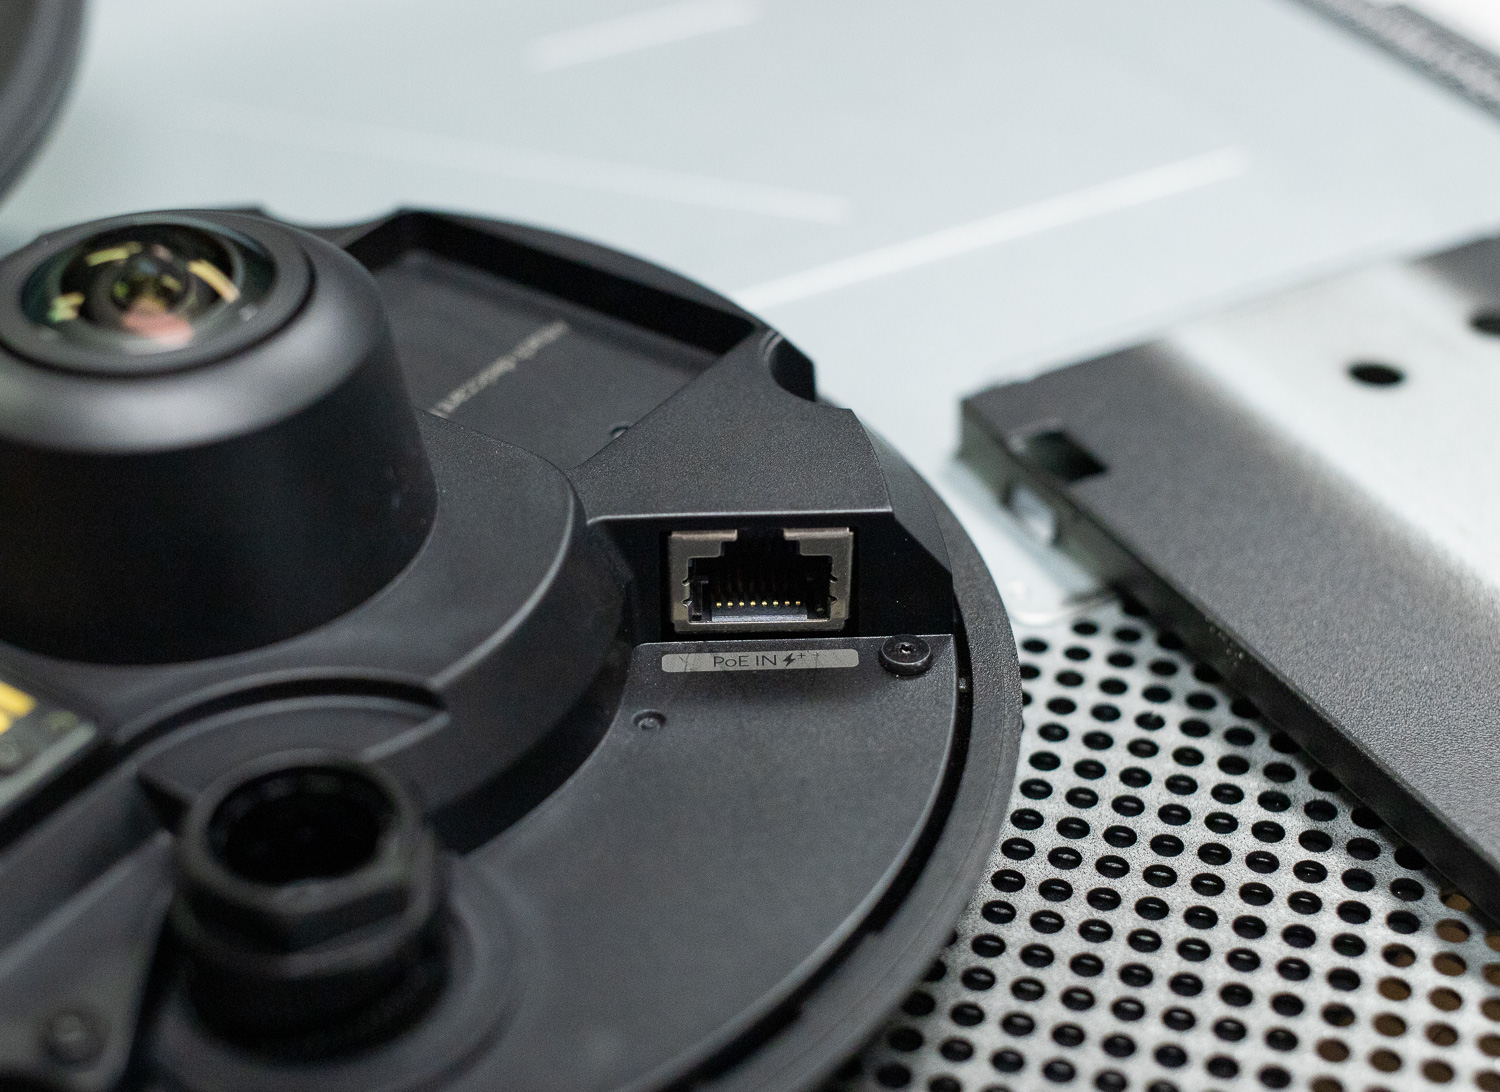
internal view of the PoE port on the ubiquiti g6 pro 360

Once plugged in, UniFi Protect detects it immediately. The G6 Pro 360 gets the complete Protect feature set, including smart detection for people, vehicles, and animals, customizable detection zones, timeline access, and multi-view layouts.

Beyond the basics, a few management features stand out, including:

  • Smart IR Zones: The four independently controllable IR zones let you tune night illumination to match the layout of the space rather than blasting uniform IR in all directions. This results in better-balanced night footage and reduces the washed-out areas you’d otherwise get from a single omnidirectional IR source at close range.
  • Digital PTZ: Operators can pan, tilt, and zoom across the full 360-degree image directly within Protect without touching the physical camera. In addition, multiple virtual viewports can run simultaneously on the same unit, enabling a single camera to serve multiple monitoring roles.
  • Storage Failover: Like the AI Dome and G6 Pro, the G6 Pro 360 includes a MicroSD expansion slot for local on-device recording. If the NVR connection drops for any reason, the camera continues capturing footage locally and syncs it back once the connection is restored. For a camera covering a large open area, that continuity is particularly important.
  • Two-Way Audio: The G6 Pro 360 includes a built-in microphone and speaker for two-way communication, which sets it apart from most of the G6 dome lineup. As a result, it’s a practical option for spaces where staff may need to communicate with people in the monitored area without a separate intercom system.
  • Mounting Options: The included surface-mount effectively supports standard ceiling installations. Additionally, the optional Flush Mount ($39.00) recesses the camera into a ceiling tile for a cleaner, lower-profile look. There are also a Dual Mount ($59.00), an Arm Mount, and an AI 360 Junction Box available for more complex installation scenarios.

Conclusion

The G6 Pro 360 is a well-executed panoramic camera that does exactly what a 360-degree unit in a managed ecosystem should do. It pairs high-resolution imaging with tight UniFi Protect integration, smart IR, two-way audio, and software-driven PTZ in a compact, ruggedized housing. At $499, it makes a strong case for deployments where a single camera needs to cover a wide open area without leaving gaps. Compared to running two or three standard domes to achieve the same coverage, it’s often the cleaner and more cost-effective solution.

Overall, it works best in environments such as open office floors, retail spaces, warehouses, gyms, and covered outdoor areas, where comprehensive area awareness matters more than precise long-distance identification. For those use cases, deploying one G6 Pro 360 is often the more practical approach. On top of that, the IP66/IK10 ratings and broad operating temperature range mean it’s equally at home in tougher outdoor environments as in controlled indoor spaces.

It’s important to note that the G6 Pro 360 doesn’t perform face recognition or license plate recognition, so it isn’t a replacement for the AI Dome or G6 Pro at access points and entry lanes. However, when used as a scene-awareness layer alongside those directional cameras, it enables a very effective deployment. For administrators developing a full UniFi Protect system, the G6 Pro 360 is a valuable addition.

Product Page – G6 Pro 360

The post Ubiquiti UniFi G6 Pro 360 Review: Full-Room Coverage from a Single Camera appeared first on StorageReview.com.

Ubiquiti UniFi Switch Flex 2.5G 8 PoE Review: The Edge Switch That Does It All for $199

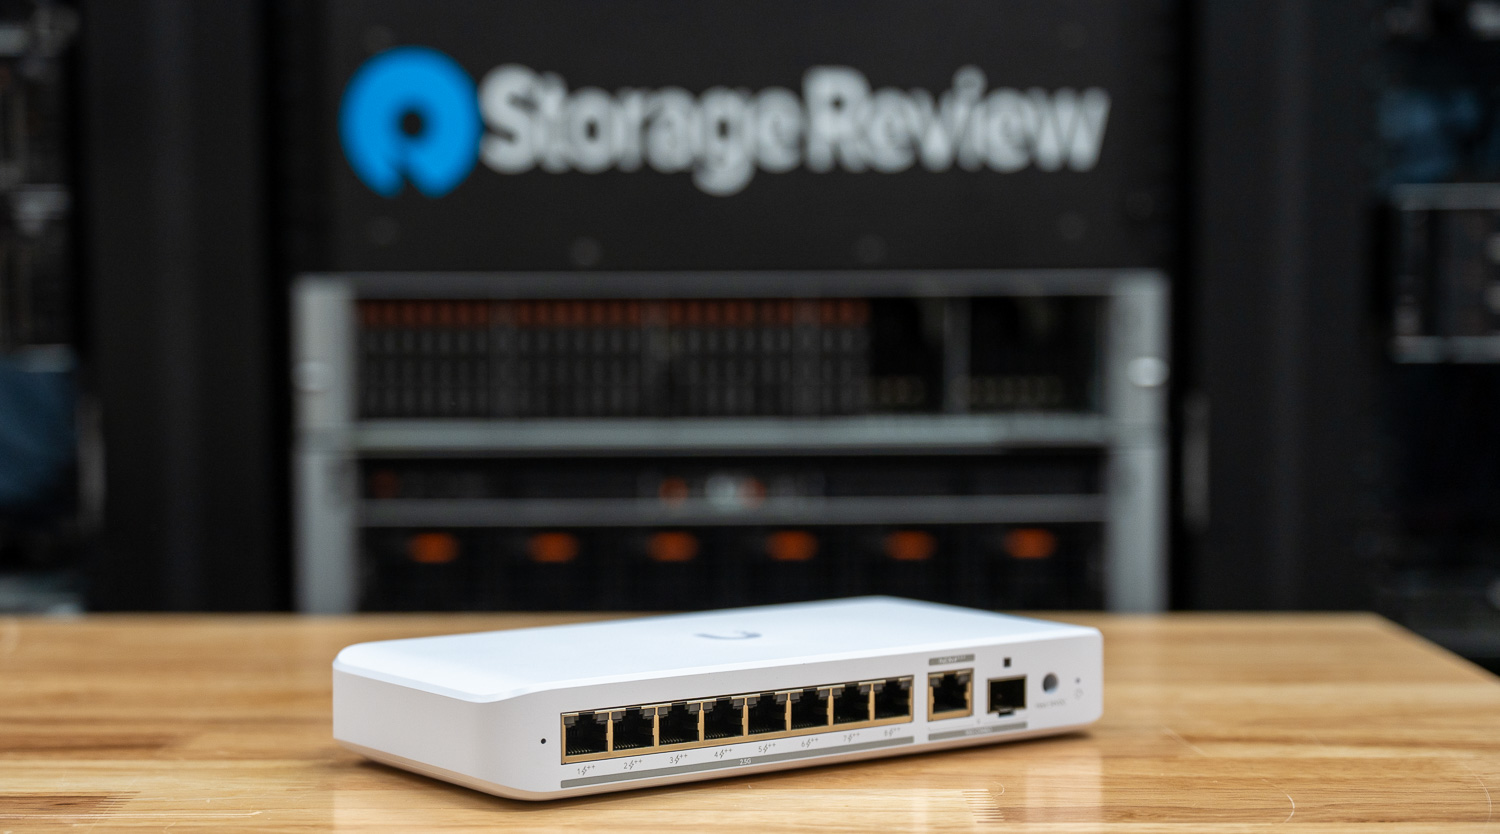
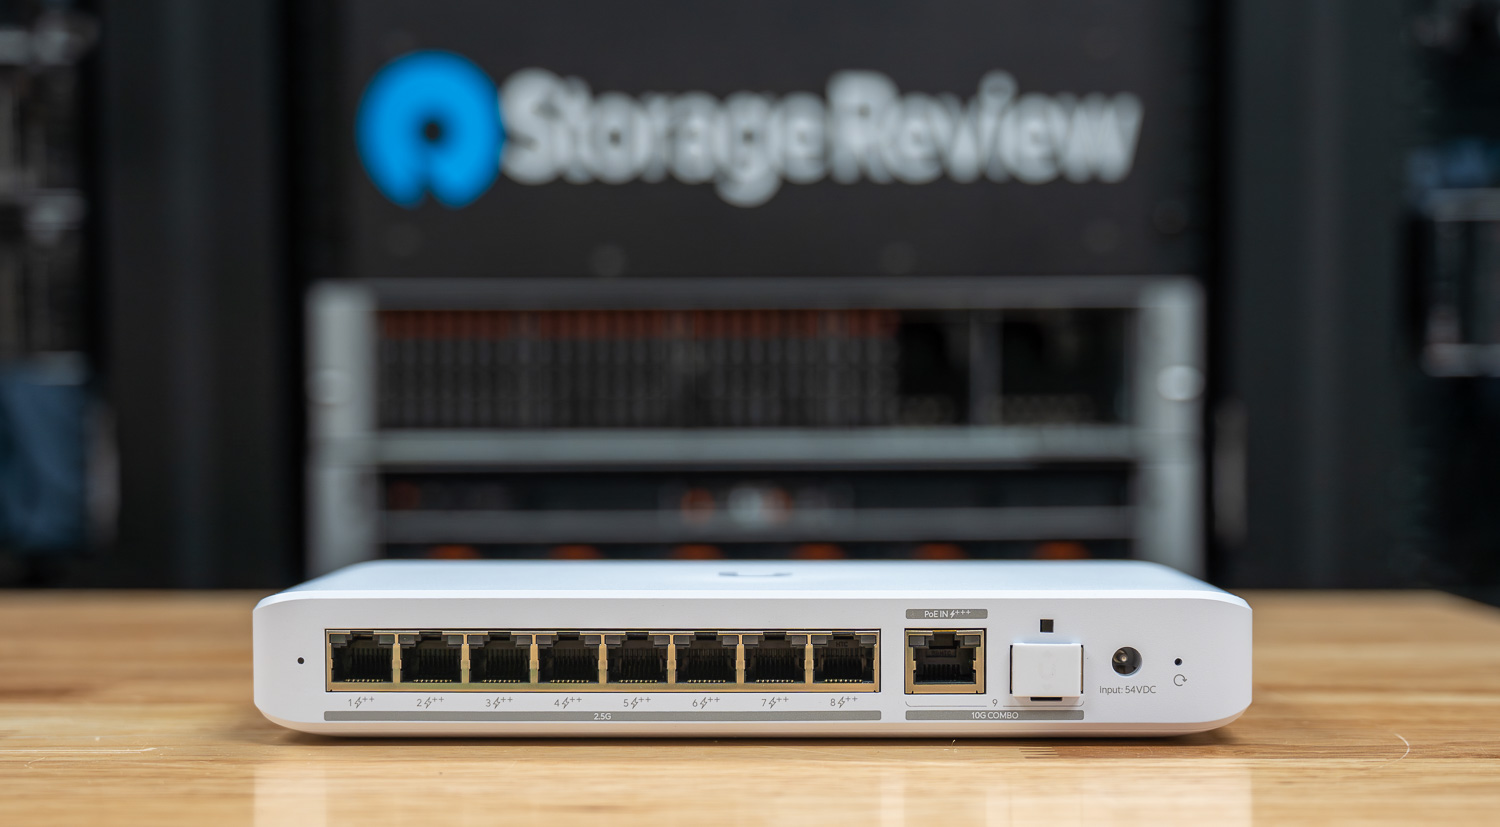
angled back view of the usw flex 2.5g angled back view of the usw flex 2.5g

As surveillance systems, enterprise WiFi deployments, and IoT infrastructure continue to evolve, network bandwidth demands are steadily increasing. Devices such as high-resolution security cameras, WiFi 7 access points, and industrial IoT sensors frequently require multi-gigabit connectivity and reliable power delivery.

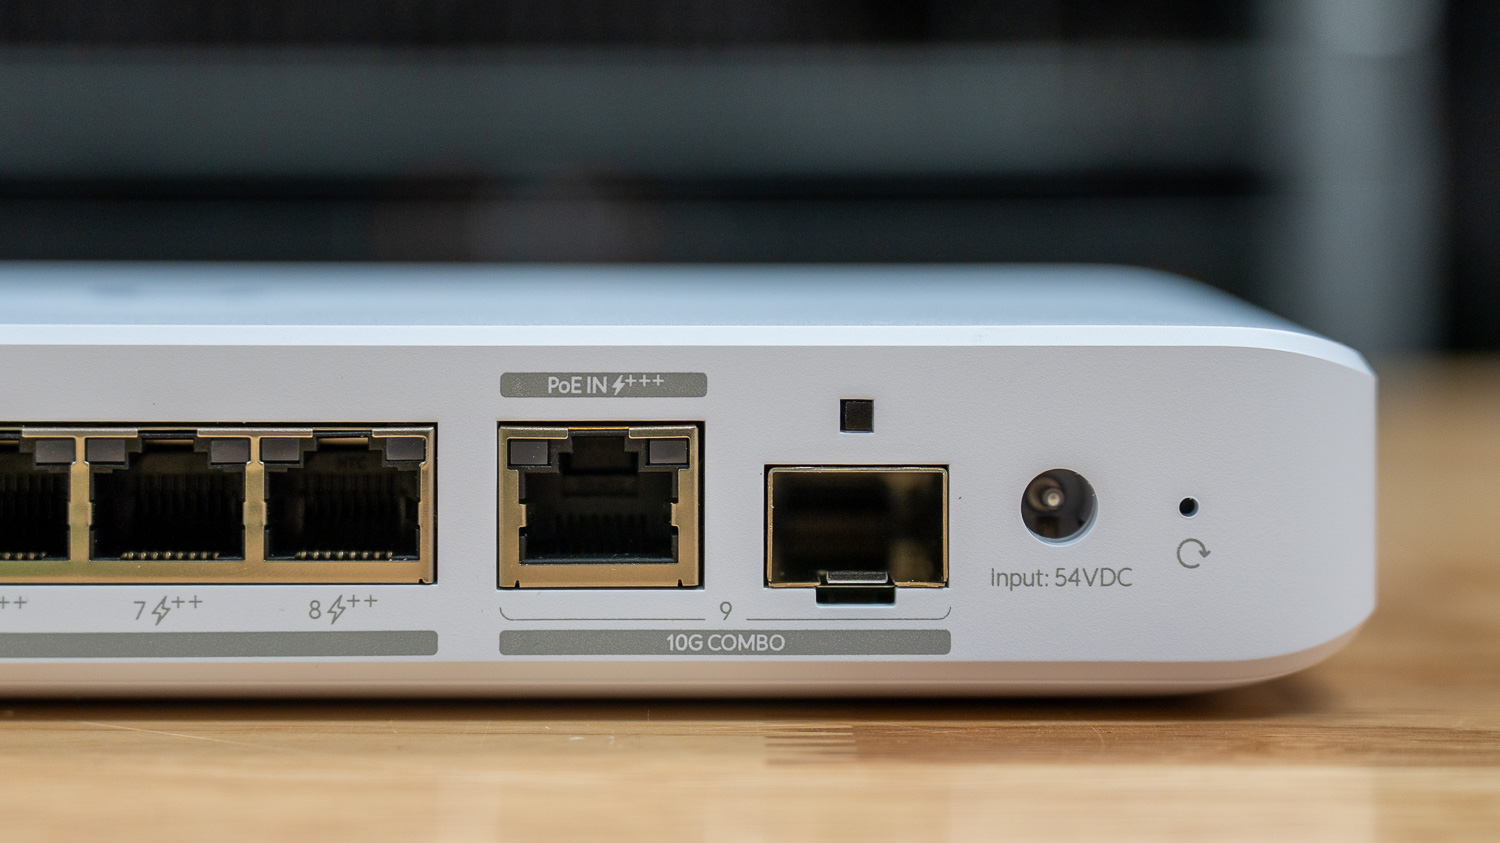
UniFi Flex 2.5G PoE hero

The UniFi Switch Flex 2.5G 8 PoE (USW-Flex-2.5G-8-PoE), available for $199.00 on the Ubiquiti Store, is designed specifically to address this challenge. Acting as a compact edge or “leaf” switch, it extends high-speed connectivity and Power over Ethernet (PoE) capabilities to remote clusters of devices while maintaining a simple uplink back to the core network. Rather than requiring each device to run a direct cable back to the central rack, this switch enables localized distribution of both data and power.

This architecture is particularly valuable in surveillance deployments, office expansions, warehouses, and outdoor installations where devices may be physically grouped but located far from the primary switching infrastructure. By combining multi-gigabit ports with a flexible power input design, the Flex 2.5G 8 PoE provides a versatile solution for environments that need both performance and deployment flexibility. One of the most distinctive aspects of the switch is its adaptable power architecture. The device can operate entirely on a high-wattage PoE+++ uplink supplied by a larger upstream switch, or draw power from a dedicated external AC adapter when additional PoE output capacity is required. This flexibility allows administrators to tailor installations based on available power sources and total PoE budget requirements.

Specification USW-Flex-2.5G-8-PoE Specifications
Overview
Dimensions 212.9 × 99.4 × 33.5 mm (8.4 × 3.9 × 1.3 in)
Weight 567 g (20 oz)
Enclosure Material Polycarbonate
Mount Material Polycarbonate
Form Factor Compact desktop, wall mount, DIN rail, or magnetic mounting
Networking & PoE
2.5 GbE RJ45 Ports 8 (All PoE++) — 2.5G / 1G / 100M / 10M
10 GbE RJ45 Port 1 (PoE+++ Input) — 10G / 5G / 2.5G / 1G / 100M
10G SFP+ Port 1 (10G / 1G)
Maximum PoE Output Up to PoE++ (64W per port)
Total PoE Availability PoE+++ Input: 76W
PoE++ Input: 46W
PoE+ Input: 16W
210W AC Adapter: 196W
Performance
Switching Capacity 60 Gbps
Total Non-Blocking Throughput 30 Gbps
Forwarding Rate 45 Mpps
Supported VLANs 256
MAC Address Table Size 4,000
Hardware & Power
Power Method (1) AC/DC Adapter (optional)(1) PoE+++
Max Power Consumption 14W (excluding PoE output) with PoE input, 17W (excluding PoE output) with AC adapter input, 210W maximum, including PoE output
Operating Temperature -20 to 45°C (-4 to 113°F)
Operating Humidity 10–90% non-condensing

Build and Design

The Flex 2.5G 8 PoE features a compact polycarbonate chassis measuring just 8.4 × 3.9 × 1.3 inches. This small form factor is intentional and reflects the switch’s intended role as a remote distribution point rather than a rack-mounted core device. Its lightweight construction allows it to be easily mounted in locations where traditional rack equipment would be impractical, such as inside media cabinets, under desks, in network boxes, or in outdoor enclosures.

angled back view of the usw flex 2.5g

Despite its small footprint, the switch is engineered for high-density connectivity. The panel houses eight 2.5GbE RJ45 ports designed for downstream devices, each capable of delivering PoE++ power. These ports support multiple Ethernet speeds, including 10 Mbps, 100 Mbps, 1 Gbps, and 2.5 Gbps, ensuring compatibility with both legacy equipment and modern multi-gigabit hardware.

rectangular shaped box the ubiquiti logo on it

For uplink connectivity, the switch includes a versatile 10-gigabit combo interface consisting of both a 10G SFP+ slot and a 10GbE RJ45 port. This design allows administrators to choose between fiber and copper uplinks based on the network infrastructure. The presence of a 10GbE backhaul is particularly important because it ensures that aggregated traffic from multiple 2.5GbE devices does not overwhelm the uplink.

UniFi Flex 2.5G PoE PoE in

Additional interface features include a system LED that provides quick status information and a recessed reset button located near the power input. These simple diagnostic tools allow administrators to quickly identify operational issues or restore the device during troubleshooting.

Power Architecture

One of the defining features of the Flex 2.5G 8 PoE is its adaptable PoE power budget. Unlike traditional switches with fixed internal power supplies, this model can operate under multiple power scenarios depending on its power source.

In environments where running a new electrical circuit is impractical, the switch can be powered directly through its 10GbE RJ45 uplink using PoE+++ (90W). When supplied with this high-power PoE input, the switch redistributes approximately 76W of usable power across its downstream ports. This configuration enables a fully cable-simplified installation in which both data and power are delivered via a single Ethernet connection from the upstream switch.

For deployments requiring greater power capacity, administrators can connect the optional 210W external AC adapter ($79.00, available on the Ubiquiti Store). This dramatically increases the available PoE budget to approximately 196W, allowing the switch to power more high-consumption devices simultaneously. In high-density installations with multiple access points or advanced surveillance cameras, this expanded power budget becomes essential.

Management & Layer 2 Features

Managing the Flex 2.5G 8 PoE integrates smoothly with the UniFi Network application (requiring Version 9.0.114 or later). Despite its edge-deployment focus, it retains a robust suite of Layer 2 features. Administrators can leverage Jumbo Frames to maximize throughput for large file transfers, while Spanning Tree Protocols (STP & RSTP) provide essential loop protection. Additional traffic management tools, such as port isolation, storm control, and egress rate limiting, give network engineers granular control over how data behaves before it travels back across the 10GbE uplink.

Use Case: Surveillance

A common deployment scenario for the Flex 2.5G 8 PoE is as a remote hub for surveillance infrastructure. Instead of routing each camera cable individually back to the central rack, administrators can deploy this switch near the camera cluster. A single 10GbE fiber or copper connection then links the remote switch back to the main network. This approach significantly reduces cabling complexity while maintaining high network performance. Cameras can be powered directly by the switch while their video streams are aggregated and transmitted back to the recording server over the high-speed uplink.

Camera Type Average Power Draw Example 76W Budget (PoE+++) Example 196W Budget (AC)
G5 Turret Ultra ~4W Up to 8 cameras (32W total) Up to 8 cameras
G5 Pro ~10W Up to 7 cameras (70W total) Up to 8 cameras
G5 PTZ ~14W Up to 5 cameras Up to 8 cameras
G4 PTZ ~43W 1 camera Up to 4 cameras

As these examples illustrate, power availability can significantly impact deployment capacity. For standard camera arrays such as the G5 Turret or G5 Bullet models, the PoE+++-powered configuration provides more than enough power for a full cluster. However, installations involving high-draw devices such as PTZ cameras benefit greatly from the larger AC-powered PoE budget.

Use Case: Creative Workspaces and Video Editing

Beyond surveillance, the shift to 2.5GbE is a massive quality-of-life upgrade for creative workflows. When performing heavy video editing, standard Gigabit Ethernet quickly becomes a severe bottleneck. The Flex 2.5G 8 PoE serves as an excellent local studio switch for connecting a high-speed multi-bay storage enclosure or NAS directly to editing workstations. Leveraging the 10GbE uplink to the core network and 2.5GbE to the machines ensures smooth timeline playback and rapid file transfers without the latency of wireless or legacy gigabit connections.

Deployment Flexibility

Ubiquiti designed the Flex 2.5G 8 PoE with versatile mounting options to accommodate a wide variety of installation environments. The switch can be placed on a desktop, mounted directly to a wall using the included bracket, or attached to a DIN rail with an optional mounting kit. Magnetic mounting is also supported, allowing the device to be secured to metal surfaces in industrial or utility installations.

side view of usw flex 2.5

For outdoor or harsh-environment deployments, the switch is compatible with the Flex Utility Pro enclosure. This optional enclosure provides an IPX6-rated weather-resistant housing that protects the switch and its power supply from environmental exposure. When combined with the enclosure and appropriate cabling, the Flex 2.5G can be deployed in locations such as building exteriors, parking structures, and remote monitoring stations.

UniFi Network Overview

During testing, the USW Flex 2.5G 8 PoE was deployed in a real-world configuration to evaluate its performance under uplink-only power conditions. The switch received a single PoE uplink from a larger upstream switch, in this case, a USW Pro 8 PoE, with no external AC adapter connected. Drawing power entirely from that uplink, the switch simultaneously powered a single wireless access point via PoE and provided wired connectivity to two workstations. As reflected in the UniFi Network dashboard, total PoE consumption was just 10.3W out of the available 76W budget, demonstrating that even without the optional AC adapter, the switch comfortably handles a modest but practical device cluster with significant power headroom to spare.

Manageability will feel immediately familiar to anyone who has worked within the UniFi ecosystem. The port manager interface provides the same port-by-port control seen across the broader lineup, including switches we have previously reviewed, such as the USW Pro XG 8 PoE, USW Pro XG 10 PoE, and USW Pro Max 16 PoE. Each port can be individually monitored for PoE mode, link speed, and traffic activity, meaning administrators already comfortable with the platform can deploy and manage the Flex 2.5G 8 PoE without any additional learning curve.

Conclusion

The UniFi Switch Flex 2.5G 8 PoE is a high-performance “Swiss Army knife” for modern edge networks, packing eight 2.5GbE ports and a 10GbE uplink into a remarkably compact frame. Its real genius lies in its power flexibility as it can run purely on a PoE+++ uplink for a clean, single-cable install or use an optional 210W AC adapter to drive power-hungry PTZ cameras and WiFi 7 access points. By moving multi-gigabit switching closer to your devices, it eliminates the “last hundred feet” bottleneck while keeping deployment logistics simple.

Priced at $199.00, this switch offers a future-proofed solution that integrates seamlessly into the UniFi ecosystem. It provides enterprise-grade Layer 2 features without the noise or footprint of traditional rack hardware, making it ideal for everything from creative studios to outdoor surveillance hubs. Ultimately, the Flex 2.5G is a strategic, low-profile powerhouse that ensures your network edge is ready for tomorrow’s high-bandwidth demands.

Product Page – Switch Flex 2.5G 8 PoE

The post Ubiquiti UniFi Switch Flex 2.5G 8 PoE Review: The Edge Switch That Does It All for $199 appeared first on StorageReview.com.

Lenovo ThinkPad P16s Gen 4 Review: RTX PRO 500 GPU With a CPU That Punches Above Its Tier

open lenovo p16s with the background of a beach sitting on a wooden tabletop open lenovo p16s with the background of a beach sitting on a wooden tabletop

Lenovo engineered the ThinkPad P16s Gen 4 for professionals who demand workstation-class reliability in a highly mobile form factor. Consequently, this device bridges the gap between a traditional laptop and a heavy-duty desk-bound machine. Powered by the latest Intel Core Ultra “Series 2” H-series processors, the laptop integrates a dedicated NPU capable of up to 13 TOPS for AI-driven productivity tasks. Although the 16-inch footprint suggests a bulky workstation, Lenovo managed to maintain a sleek profile, with a starting weight of just 4.01 pounds (1.82 kg). Furthermore, by pairing the system with NVIDIA’s RTX PRO 500 Blackwell GPU, Lenovo created a precision tool for engineers and healthcare clinicians who require a balance of power and portability without sacrificing the legendary ThinkPad durability.

lenovo thinkpad p16s open with the background of a beach sitting on a wooden tabletop
Specification Lenovo ThinkPad P16s Gen 4
Unit Configuration
Product Name Lenovo ThinkPad P16s Gen 4
Processor Intel Core Ultra 7 265H (up to 5.3 GHz)
vPro Eligibility vPro Enterprise
Graphics NVIDIA RTX PRO 500 Blackwell
Memory 64 GB RAM
Storage 2 TB SSD TCG Opal Encryption 2, NVMe, Performance
Display 16″ OLED touchscreen 3840 x 2400 (WQUXGA)
Connectivity & Security
Wireless Wi-Fi 7, Bluetooth
Keyboard English keyboard with numeric keypad and Copilot key
Security Service ThinkShield Pro Security (1 Year)
Support 1 Year Lenovo Premier Support
Pricing
Retail Price $4,218.99

Design & Build

Lenovo built the ThinkPad P16s Gen 4 for professional durability, equipping it with an aluminum chassis for the top and bottom covers. First, the device passed MIL-STD-810H military-grade testing, ensuring it can easily handle the vibrations and environmental changes typical of fieldwork. Despite its ruggedness, the workstation remains relatively portable, weighing 1.82 kg (4.01 lbs) and featuring a profile that tapers to 18.17mm at the rear.

aluminum top of lenovo p16s

Moreover, Lenovo prioritized sustainability throughout its hardware. Specifically, the manufacturer used high percentages of Post-Consumer Content (PCC) recycled plastic in the keycaps (85%), speaker enclosures (90%), batteries (90%), and 100W power adapters (90%). Similarly, the internal cooling system uses an 80% recycled-copper thermal block.

To support precision tasks, Lenovo tailored the 16-inch, 16:10 displays. For instance, the top-tier WQUXGA OLED option provides a 100,000:1 contrast ratio and 100% DCI-P3 color gamut, while lower-resolution WUXGA panels offer up to 500 nits of brightness. To maintain accuracy, models feature either AICCP or X-Rite factory-calibrated color. Additionally, the laptop features a 6-row spill-resistant keyboard with a numeric keypad and a dedicated Copilot key, along with a 115mm Mylar touchpad and the classic TrackPoint. Finally, stereo 2W speakers with Dolby Audio deliver crisp sound, supported by a 360° far-field dual-microphone array. It is worth noting that the P16s Gen 4 does not include an SD card reader; professionals who regularly offload data from cameras or field devices will need a USB adapter or dock

lenovo p16s keyboard

Integrated Sensors

The system includes specialized sensors to streamline security and power management. For example, users can pair an optional Ultrasonic Human Presence Detection sensor with the IR camera to automatically lock the workstation when stepping away and wake it upon return. Meanwhile, for biometric login, a “match-on-chip” fingerprint reader integrates directly into the power button.

p16s camera and ir with privacy shutter

Camera & Security

Regarding video conferencing, the P16s Gen 4 offers up to a 5.0 MP + IR camera with temporal noise reduction and a physical privacy shutter. Furthermore, the ThinkShield suite manages security, incorporating a discrete TPM 2.0 chip for encryption and a self-healing BIOS. Bottom cover tamper detection further protects the chassis by alerting IT if someone accesses the internal hardware. In addition, the Intel vPro platform, available on select models, provides hardware-level remote management and enhanced virtualization security for enterprise environments.

Upgradability & Internals

Because longevity is a core focus of this workstation, Lenovo included two DDR5 SODIMM/CSODIMM slots supporting up to 96GB of RAM. Therefore, users can configure memory at up to 6400 MT/s for CSODIMM modules. A single M.2 2280 slot handles storage, supporting up to a 2TB PCIe Gen 5 Performance SSD, even though it will operate at PCIe 4.0 speeds.

p16s memory and m.2 close-up

Power options include a 57Wh or 75Wh battery. Both batteries support Rapid Charge, reaching 80% in 1 hour with the 100W USB-C adapter. Connectivity-wise, the system features Wi-Fi 7 and Bluetooth 5.4. Alternatively, professionals needing constant access can opt for a 4G LTE CAT16 card with embedded eSIM functionality.

p16s internals
Specification Lenovo ThinkPad P16s Gen 4
Performance
Processor Intel Core Ultra 5 225H: 14 Cores (4P + 8E + 2LP E), 14 Threads, Max 4.9GHz, 18MB Cache, 83 Overall TOPS
Intel Core Ultra 5 235H: 14 Cores (4P + 8E + 2LP E), 14 Threads, Max 5.0GHz, 18MB Cache, 94 Overall TOPS
Intel Core Ultra 7 255H: 16 Cores (6P + 8E + 2LP E), 16 Threads, Max 5.1GHz, 24MB Cache, 96 Overall TOPS
Intel Core Ultra 7 265H: 16 Cores (6P + 8E + 2LP E), 16 Threads, Max 5.3GHz, 24MB Cache, 97 Overall TOPS
Intel Core Ultra 9 285H: 16 Cores (6P + 8E + 2LP E), 16 Threads, Max 5.4GHz, 24MB Cache, 99 Overall TOPS
Graphics (Integrated) Intel Arc 130T GPU (Integrated, Shared Memory, Share CPU TDP)
Intel Arc 140T GPU (Integrated, Shared Memory, Share CPU TDP)
Graphics (Discrete) NVIDIA RTX PRO 500 Blackwell Generation: 6GB GDDR7, 35W TGP, 294 TOPS
NVIDIA RTX PRO 1000 Blackwell Generation: 8GB GDDR7, 35W TGP, 440 TOPS
NPU Integrated Intel AI Boost, up to 13 TOPS
Operating System Windows 11 Pro
Windows 11 Home
Windows 11 Home Single Language
Ubuntu Linux
Red Hat Enterprise Linux 10 (certified)
Display & Multimedia
Display Options 16″ WUXGA (1920×1200) IPS, 400nits, Anti-glare, 16:10, 1200:1, 45% NTSC, 60Hz, Low Blue Light
16″ WUXGA (1920×1200) IPS, 500nits, Anti-glare, 16:10, 1200:1, 100% sRGB, 60Hz, Low Power, Eyesafe 2.0 Certified
16″ WQUXGA (3840×2400) OLED, 400nits, Anti-reflection/Anti-smudge, 16:10, 100,000:1, 100% DCI-P3, 60Hz, Eyesafe 2.0 Certified, X-Rite Factory Color Calibration
Touchscreen Add-on Film Touch (10-point touch on WQUXGA) or Non-touch
Audio High Definition (HD) Audio, Realtek ALC3287 codec; Stereo speakers, 2W x2, Dolby Audio; Dual-microphone array, 360° far-field, Dolby Voice
Camera 5.0MP + IR with privacy shutter and Ultrasonic Human Presence Detection
5.0MP + IR with privacy shutter
5.0MP with privacy shutter
Memory & Storage
Max Memory Up to 96GB (2x 48GB DDR5 CSODIMM)
Memory Slots Two DDR5 SODIMM / CSODIMM slots, dual-channel capable
Memory Type DDR5-5600 SODIMM (8GB/16GB/32GB modules)
DDR5-6400 CSODIMM (32GB/48GB modules)
Storage One M.2 2280 PCIe 4.0 x4 slot
Support for up to one 2TB M.2 2280 Gen 5 Performance SSD
Connectivity & Ports
WLAN + Bluetooth Intel Wi-Fi 7 BE201, 802.11be 2×2 Wi-Fi + Bluetooth 5.4 (vPro support on selected models)
WWAN Quectel EM160R-GL, 4G LTE CAT16, M.2 card with eSIM; Wireless WAN upgradable to 4G; or No support
Standard Ports 1x USB-A (USB 5Gbps / USB 3.2 Gen 1)
1x USB-A (USB 5Gbps / USB 3.2 Gen 1), Always On
2x Thunderbolt™ 4, with USB PD 3.0
1x HDMI 2.1, up to 4K/60Hz
1x Headphone/microphone combo jack (3.5mm)
1x Ethernet (GbE RJ-45)
1x Security keyhole
Optional Ports 1x Nano-SIM card slot (WWAN models)
1x Smart card reader
Physical & Power
Dimensions (WxDxH) 361.5 x 248.6 x 12.6/18.17 (front/rear) mm (14.24 x 9.79 x 0.49/0.71 inches)
Weight Starting at 1.82 kg (4.01 lbs)
Case Material Aluminium (top), Aluminium (bottom)
Battery 57Wh or 75Wh Rechargeable Li-ion Battery, supports Rapid Charge (up to 80% in 1hr)
Power Adapter 100W USB-C slim (3-pin) AC adapter, supports PD 3.0

Lenovo ThinkPad P16s Gen 4 Performance

To evaluate the ThinkPad P16s Gen 4, we ran a wide range of workstation- and AI-focused benchmarks, including Procyon AI, SPECworkstation 4, SPECviewperf, Blender, LuxMark, and several system-level tests measuring CPU, GPU, and storage performance across professional workloads.

Our review configuration was equipped with an Intel Core Ultra 7 265H processor featuring 16 cores and a boost speed of up to 5.3 GHz, paired with an NVIDIA RTX PRO 500 Blackwell Laptop GPU with 6GB of GDDR7 memory. The system was also configured with 64GB of system memory and a 2TB NVMe SSD while running Windows 11.

In these benchmarks, we compared the ThinkPad P16s Gen 4 to:

Procyon AI Computer Vision

The Procyon AI Computer Vision Benchmark measures AI inference performance across CPUs, GPUs, and dedicated accelerators using a range of state-of-the-art neural networks. It evaluates tasks such as image classification, object detection, segmentation, and super-resolution using models including MobileNet V3, Inception V4, YOLO V3, DeepLab V3, Real ESRGAN, and ResNet 50. Tests are run on multiple inference engines, including NVIDIA TensorRT, Intel OpenVINO, Qualcomm SNPE, Microsoft Windows ML, and Apple Core ML, providing a broad view of hardware and software efficiency. Results are reported for both float- and integer-optimized models, providing a consistent, practical measure of machine vision performance for professional workloads.

The ThinkPad P16s Gen 4 demonstrates slightly stronger sustained AI inference performance thanks to its larger chassis and increased thermal headroom. In CPU-based testing, the system achieved an overall score of 138, outperforming the smaller P14s Gen 6 and matching the higher-end P16v system. Latency results across common vision models remain efficient, including 1.08 ms for MobileNet V3, 9.80 ms for ResNet 50, and 28.44 ms for Inception V4. At the same time, heavier workloads, such as Real-ESRGAN, complete noticeably faster on the P14s.

GPU results are nearly identical across the two systems when using the same RTX PRO 500 GPU, with the P16s recording a GPU score of 354 compared to the P14s’ 355. However, in the optimized TensorRT tests, the P16s pulls slightly ahead with an overall score of 484, suggesting improved sustained GPU throughput. Overall, the P16s provides very similar AI acceleration to the P14s but benefits from additional cooling capacity, allowing it to maintain higher performance during extended workloads.

CPU Results (average time in ms) Lenovo ThinkPad P14s Gen 6 (Intel Ultra 7 265H)(NVIDIA RTX PRO 500) Lenovo ThinkPad P16v Gen 3  (Intel Core Ultra 9 285H)(NVIDIA RTX PRO 2000) Lenovo ThinkPad P16s Gen 4 (Intel Core Ultra 7 265H)(NVIDIA RTX PRO 500)
AI Computer Vision Overall Score 122 138 138
MobileNet V3 1.11 ms 0.98 ms 1.08 ms
ResNet 50 10.89 ms 9.57 ms 9.80 ms
Inception V4 31.91 ms 28.26 ms 28.44 ms
DeepLab V3 39.42 ms 34.59 ms 35.51 ms
YOLO V3 74.45 ms 68.85 ms 69.87 ms
REAL-ESRGAN 4,161.76 ms 3,442.98 ms 3,016.11 ms
GPU Results (average time in ms) Lenovo ThinkPad P14s Gen 6 (Intel Ultra 7 265H)(NVIDIA RTX PRO 500) Lenovo ThinkPad P16v Gen 3  (Intel Core Ultra 9 285H)(NVIDIA RTX PRO 2000) Lenovo ThinkPad P16s Gen 4 (Intel Core Ultra 7 265H)(NVIDIA RTX PRO 500)
AI Computer Vision Overall Score 355 490 354
MobileNet V3 1.05 ms 0.79 ms 1.03 ms
ResNet 50 3.77 ms 2.80 ms 3.73 ms
Inception V4 10.13 ms 8.05 ms 10.37 ms
DeepLab V3 25.40 ms 19.54 ms 24.74 ms
YOLO V3 19.16 ms 12.70 ms 20.15 ms
REAL-ESRGAN 399.21 ms 256.57 ms 395.42 ms
TensorRT  Lenovo ThinkPad P14s Gen 6 (Intel Ultra 7 265H)(NVIDIA RTX PRO 500) Lenovo ThinkPad P16v Gen 3  (Intel Core Ultra 9 285H)(NVIDIA RTX PRO 2000) Lenovo ThinkPad P16s Gen 4 (Intel Core Ultra 7 265H)(NVIDIA RTX PRO 500)
Overall Score 438 681 484
MobileNet V3 0.76 ms 0.53 ms 0.64 ms
ResNet 50 3.33 ms 2.20 ms 3.05 ms
Inception V4 9.53 ms 7.40 ms 8.67 ms
DeepLab V3 13.34 ms 7.97 ms 11.66 ms
YOLO V3 15.28 ms 7.94 ms 13.76 ms
REAL-ESRGAN 446.47 ms 289.54 ms 444.42 ms

UL Procyon: AI Text Generation

The Procyon AI Text Generation Benchmark streamlines LLM performance testing by providing a concise, consistent evaluation method. It enables repeated testing across multiple LLM models while minimizing the complexity of large models and the number of variables. Developed with AI hardware leaders, it optimizes the use of local AI accelerators to deliver more reliable, efficient performance assessments. The results measured below were tested using TensorRT.

For LLM workloads, the P16s Gen 4 performs exactly as expected for its hardware tier. It closely mirrors the output speeds and token generation of the P14s Gen 6, yielding around 47 tokens/second in the Phi test and 34 tokens/second in Mistral. It understandably trails the P16v Gen 3, as the RTX PRO 2000’s higher VRAM and compute capacity offer a distinct advantage for text generation.

UL Procyon: AI Text Generation  Lenovo ThinkPad P14s Gen 6 (Intel Ultra 7 265H)(NVIDIA RTX PRO 500) Lenovo ThinkPad P16v Gen 3  (Intel Core Ultra 9 285H)(NVIDIA RTX PRO 2000) Lenovo ThinkPad P16s Gen 4 (Intel Core Ultra 7 265H)(NVIDIA RTX PRO 500)
Phi
Phi Overall Score 1,307 1,952 1,339
Phi Output Time To First Token 0.685 s 0.456 s 0.672 s
Phi Output Tokens Per Second 45.671 tokens/s 67.803 tokens/s 47.070 tokens/s
Phi Overall Duration 64.004 s 43.235 s 62.210 s
Mistral
Mistral Overall Score 1,137 1,745 1,113
Mistral Output Time To First Token 1.196 s 0.751 s 1.292 s
Mistral Output Tokens Per Second 33.960 tokens/s 50.213 tokens/s 34.884 tokens/s
Mistral Overall Duration 87.809 s 59.136 s 86.295 s
Llama3
Llama3 Overall Score 1,552
Llama3 Output Time To First Token 0.732 s
Llama3 Output Tokens Per Second 43.409 tokens/s
Llama3 Overall Duration 67.892 s
Llama2
Llama2 Overall Score
Llama2 Output Time To First Token
Llama2 Output Tokens Per Second
Llama2 Overall Duration

UL Procyon: AI Image Generation

The Procyon AI Image Generation Benchmark provides a consistent and accurate method for measuring AI inference performance across a range of hardware, from low-power NPUs to high-end GPUs. It includes three tests: Stable Diffusion XL (FP16) for high-end GPUs, Stable Diffusion 1.5 (FP16) for moderately powerful GPUs, and Stable Diffusion 1.5 (INT8) for low-power devices. The benchmark uses the optimal inference engine for each system, ensuring fair and comparable results.

Image generation heavily taxes the GPU, and the P16s Gen 4’s RTX PRO 500 shows its limitations here compared to the RTX PRO 2000. While it efficiently handles the low-power INT8 Stable Diffusion 1.5 test (scoring 8,840 and outputting images in roughly 3.5 seconds), it falls behind the P16v Gen 3 by about 34% in the FP16 test. However, it still edges out the P14s Gen 6 slightly, reinforcing the benefit of the larger thermal envelope.

UL Procyon: AI Image Generation  Lenovo ThinkPad P14s Gen 6 (Intel Ultra 7 265H)(NVIDIA RTX PRO 500) Lenovo ThinkPad P16v Gen 3  (Intel Core Ultra 9 285H)(NVIDIA RTX PRO 2000) Lenovo ThinkPad P16s Gen 4 (Intel Core Ultra 7 265H)(NVIDIA RTX PRO 500)
Stable Diffusion 1.5 (FP16)
Stable Diffusion 1.5 (FP16) – Overall Score 697 1,084 708
Stable Diffusion 1.5 (FP16) – Overall Time 143.447 s 92.235 s 141.136 s
Stable Diffusion 1.5 (FP16) – Image Generation Speed 8.965 s/image 5.765 s/image 8.821 s/image
Stable Diffusion 1.5 (INT8)
Stable Diffusion 1.5 (INT8) – Overall Score 8,440 13,402 8,840
Stable Diffusion 1.5 (INT8) – Overall Time 29.619 s 18.653 s 28.278 s
Stable Diffusion 1.5 (INT8) – Image Generation Speed 3.702 s/image 2.332 s/image 3.535 s/image
Stable Diffusion XL (FP16)
Stable Diffusion XL (FP16) – Overall Score 847
Stable Diffusion XL (FP16) – Overall Time 707.623 s
Stable Diffusion XL (FP16) – Image Generation Speed 44.226 s/image

SPECworkstation 4

The SPECworkstation 4.0 benchmark is a comprehensive tool for evaluating all key aspects of workstation performance. It offers a real-world measure of CPU, graphics, accelerator, and disk performance, ensuring professionals have the data to make informed decisions about their hardware investments. The benchmark includes a dedicated set of tests focusing on AI and ML workloads, including data science tasks and ONNX runtime-based inference tests, reflecting the growing importance of AI/ML in workstation environments. It encompasses seven industry verticals and four hardware subsystems, providing a detailed, relevant measure of today’s workstation performance.

The P16s Gen 4 holds its own exceptionally well across industry verticals, particularly in CPU-bound workloads. It leads all three systems in Energy (1.28), Financial Services (1.10), Life Sciences (1.68), and Product Design (1.32), outpacing even the higher-tier P16v Gen 3 in those categories. AI & Machine Learning (1.60) and Media & Entertainment (1.60) come in just behind the P16v, while Productivity & Development (1.07) trails it slightly. Overall, the P16s presents a strong case for professionals in scientific, engineering, and financial workloads where CPU throughput matters more than GPU horsepower.

SPECworkstation 4.0.0 (higher is better)  Lenovo ThinkPad P14s Gen 6 (Intel Ultra 7 265H)(NVIDIA RTX PRO 500) Lenovo ThinkPad P16v Gen 3  (Intel Core Ultra 9 285H)(NVIDIA RTX PRO 2000) Lenovo ThinkPad P16s Gen 4 (Intel Core Ultra 7 265H)(NVIDIA RTX PRO 500)
Industry Verticals
AI & Machine Learning 1.45 1.63 1.60
Energy 1.13 1.12 1.28
Financial Services 0.95 0.98 1.10
Life Sciences 1.51 1.62 1.68
Media & Entertainment 1.53 1.60 1.60
Product Design 1.16 1.27 1.32
Productivity & Development 0.87 1.09 1.07

SPECviewperf 15

SPECviewperf 15 is the industry-standard benchmark for evaluating 3D graphics performance across OpenGL, DirectX, and Vulkan APIs. It introduces new workloads, including blender-01 (Blender 3.6), unreal_engine-01 (Unreal Engine 5.4, DirectX 12), and enscape-01 (Enscape 4.0, Vulkan ray tracing), along with updated traces for 3ds Max, CATIA, Creo, Maya, and SolidWorks. With its redesigned GUI, modern application support, and advanced rendering workloads, SPECviewperf 15 provides consistent, real-world insights into professional graphics performance.

Interestingly, the P16s Gen 4 exhibits some unexpected behavior in SPECviewperf 15. Despite having the same Ultra 7 265H and RTX PRO 500 as the P14s Gen 6, it notably underperforms in viewsets such as 3dsmax, Blender, and medical. This discrepancy likely points to early driver optimizations or a highly conservative thermal management profile prioritizing quiet operation over burst graphics performance in this specific chassis.

SPECviewperf (higher is better)  Lenovo ThinkPad P14s Gen 6 (Intel Ultra 7 265H)(NVIDIA RTX PRO 500) Lenovo ThinkPad P16v Gen 3  (Intel Core Ultra 9 285H)(NVIDIA RTX PRO 2000) Lenovo ThinkPad P16s Gen 4 (Intel Core Ultra 7 265H)(NVIDIA RTX PRO 500)
3dsmax-08 18.26 30.54 8.98
blender-01 30.19 47.62 13.83
catia-07 32.65 49.64
creo-04 87.59 133.91 62.24
energy-04 34.95 57.13 11.90
enscape-01 19.64 27.82
maya-07 86.42 122.09 37.79
medical-04 74.06 105.90 26.81
solidworks-08 39.26 65.69 35.65
unreal_engine-01 40.99 57.02 31.12

LuxMark

LuxMark is a GPU benchmark that uses LuxRender, an open-source ray-tracing renderer, to evaluate a system’s performance with highly detailed 3D scenes. This benchmark is relevant for assessing the graphical rendering capabilities of servers and workstations, especially for visual effects and architectural visualization applications, where accurate light simulation is crucial.

In OpenCL ray-tracing performance, the P16s Gen 4 posts solid results for its class. It scored 10,449 in Hallbench, about 11.8% ahead of the P14s Gen 6 at 9,344, while still trailing the P16v Gen 3 and its RTX PRO 2000 at 14,583. The same pattern appears in the Food scene, where the P16s reached 3,892 compared to 3,543 on the P14s and 5,536 on the P16v. Overall, the P16s benefits from its larger chassis when paired with the same RTX PRO 500 GPU, allowing it to maintain a modest but consistent lead over the P14s in sustained ray-tracing workloads.

LuxMark (higher is better)  Lenovo ThinkPad P14s Gen 6 (Intel Ultra 7 265H)(NVIDIA RTX PRO 500) Lenovo ThinkPad P16v Gen 3  (Intel Core Ultra 9 285H)(NVIDIA RTX PRO 2000) Lenovo ThinkPad P16s Gen 4 (Intel Core Ultra 7 265H)(NVIDIA RTX PRO 500)
Hallbench 9,344 14,583 10,449
Food 3,543 5,536 3,892

7-Zip Compression

The 7-Zip Compression Benchmark evaluates CPU performance during compression and decompression tasks, measuring ratings in GIPS (Giga Instructions Per Second) and CPU usage. Higher GIPS and efficient CPU usage indicate superior performance.

This is where the ThinkPad P16s Gen 4 truly shines. In a surprising upset, it outperforms not only the P14s Gen 6 but also the Ultra 9 285H-equipped P16v Gen 3 in the Total Rating (96.484 GIPS vs 92.891 GIPS). The combination of the Ultra 7 265H and the 16-inch cooling solution results in phenomenal sustained multi-core efficiency for heavy compression and decompression tasks.

7-Zip Compression Benchmark (higher is Better)  Lenovo ThinkPad P14s Gen 6 (Intel Ultra 7 265H)(NVIDIA RTX PRO 500) Lenovo ThinkPad P16v Gen 3  (Intel Core Ultra 9 285H)(NVIDIA RTX PRO 2000) Lenovo ThinkPad P16s Gen 4 (Intel Core Ultra 7 265H)(NVIDIA RTX PRO 500)
Compression
Current CPU Usage 1,272% 1,221% 1,340%
Current Rating/Usage 6.148 GIPS 7.143 GIPS 7.727 GIPS
Current Rating 78.199 GIPS 87.232 GIPS 103.552 GIPS
Resulting CPU Usage 1,290% 1,260% 1,198%
Resulting Rating/Usage 6.217 GIPS 7.210 GIPS 7.768 GIPS
Resulting Rating 80.191 GIPS 90.840 GIPS 101.986 GIPS
Decompression
Current CPU Usage 1,255% 1,252% 1,198%
Current Rating/Usage 7.375 GIPS 7.701 GIPS 7.313 GIPS
Current Rating 92.580 GIPS 96.410 GIPS 87.601 GIPS
Resulting CPU Usage 1,254% 1,217% 1,236%
Resulting Rating/Usage 7.416 GIPS 7.798 GIPS 7.362 GIPS
Resulting Rating 92.953 GIPS 94.943 GIPS 90.982 GIPS
Total Rating
Total CPU Usage 1,272% 1,238% 1,275%
Total Rating/Usage 6.816 GIPS 7.504 GIPS 7.565 GIPS
Total Rating 86.572 GIPS 92.891 GIPS 96.484 GIPS

Blackmagic RAW Speed Test

The Blackmagic RAW Speed Test is a performance benchmark that measures a system’s capabilities for video playback and editing with the Blackmagic RAW codec. It evaluates how well a system can decode and playback high-resolution video files, reporting frame rates for both CPU- and GPU-based processing.

The P16s Gen 4 delivers strong CPU decoding performance, achieving 74 FPS in the 8K CPU test. This places it ahead of the P14s Gen 6 at 65 FPS, though slightly behind the P16v Gen 3 at 76 FPS. On the GPU side, the P16s posted the strongest OpenCL result in this group at 86 FPS, narrowly edging out the P16v at 84 FPS and clearly leading the P14s at 63 FPS. These results make the P16s a highly capable platform for mobile RAW video playback and editing workflows.

Blackmagic RAW Speed Test  Lenovo ThinkPad P14s Gen 6 (Intel Ultra 7 265H)(NVIDIA RTX PRO 500) Lenovo ThinkPad P16v Gen 3  (Intel Core Ultra 9 285H)(NVIDIA RTX PRO 2000) Lenovo ThinkPad P16s Gen 4 (Intel Core Ultra 7 265H)(NVIDIA RTX PRO 500)
8K CPU 65 76 74
8K OPENCL 63 84 86

Blackmagic Disk Speed Test

The Blackmagic Disk Speed Test evaluates storage performance by measuring read and write speeds, providing insights into a system’s ability to handle data-intensive tasks, such as video editing and large file transfers.

Storage performance is highly consistent across the board. The P16s Gen 4’s PCIe Gen 5 Performance SSD, running at PCIe 4.0 speeds due to the slot limitation, delivers a solid 5,169 MB/s read and 4,624 MB/s write, comfortably within expected margins for modern enterprise workstations, ensuring rapid file transfers and quick application load times.

Blackmagic Disk Speed Test  Lenovo ThinkPad P14s Gen 6 (Intel Ultra 7 265H)(NVIDIA RTX PRO 500) Lenovo ThinkPad P16v Gen 3  (Intel Core Ultra 9 285H)(NVIDIA RTX PRO 2000) Lenovo ThinkPad P16s Gen 4 (Intel Core Ultra 7 265H)(NVIDIA RTX PRO 500)
Read 5,159.6 MB/s 5,023.4 MB/s 5,169.3 MB/s
Write 4,794.1 MB/s 4,675.3 MB/s 4,624.5 MB/s

Blender 4.5

Blender is an open-source 3D modeling application. This benchmark was run using the Blender Benchmark utility. The score is measured in samples per minute, with higher values indicating better performance.

In CPU rendering, the P16s Gen 4 remains highly competitive across the Blender suite. In Monster, it scored 120.23 samples per minute, placing it between the P16v Gen 3 at 128.24 and the P14s Gen 6 at 118.71. In Junkshop, the P16s again landed in the middle at 77.99, narrowly behind the P16v at 79.18 while staying ahead of the P14s at 73.68. In Classroom, the P16s moved into the lead with 61.04 samples per minute, outperforming both the P14s at 58.11 and the P16v at 57.62. Overall, the P16s shows very balanced CPU rendering behavior, with enough thermal headroom to stay consistently strong across varied scene complexity.

Blender CPU (samples per minute, higher is better) Lenovo ThinkPad P14s Gen 6 (Intel Ultra 7 265H)(NVIDIA RTX PRO 500) Lenovo ThinkPad P16v Gen 3  (Intel Core Ultra 9 285H)(NVIDIA RTX PRO 2000) Lenovo ThinkPad P16s Gen 4 (Intel Core Ultra 7 265H)(NVIDIA RTX PRO 500)
Monster 118.71 128.24 120.23
Junkshop 73.68 79.18 77.99
Classroom 58.11 57.62 61.04

On the GPU side, the P16s Gen 4 performs almost identically to the P14s Gen 6, which is expected given that both systems use the same RTX PRO 500 GPU. It scored 917.81 in Monster versus 903.13 for the P14s, 628.51 in Junkshop versus 620.11, and 538.79 in Classroom versus 527.76. The P16v Gen 3 remains clearly ahead in all three scenes thanks to its more powerful RTX PRO 2000, but the P16s still delivers solid GPU rendering performance within its hardware class.

Blender GPU (samples per minute, higher is better) Lenovo ThinkPad P14s Gen 6 (Intel Ultra 7 265H)(NVIDIA RTX PRO 500) Lenovo ThinkPad P16v Gen 3  (Intel Core Ultra 9 285H)(NVIDIA RTX PRO 2000) Lenovo ThinkPad P16s Gen 4 (Intel Core Ultra 7 265H)(NVIDIA RTX PRO 500)
Monster 903.13 1,300.29 917.81
Junkshop 620.11 643.87 628.51
Classroom 527.76 607.69 538.79

y-cruncher

y-cruncher is a multithreaded and scalable program that can compute Pi and other mathematical constants to trillions of digits. Since its launch in 2009, it has become a popular benchmarking and stress-testing application for overclockers and hardware enthusiasts.

The P16s Gen 4 turns in the strongest y-cruncher results of the group across every completed workload. It finished the 1-billion-digit test in 27.472 seconds, ahead of the P16v Gen 3 at 32.690 seconds and the P14s Gen 6 at 34.056 seconds. That advantage continues at 2.5 billion digits, where the P16s recorded 81.702 seconds, compared to 92.203 on the P16v and 96.273 on the P14s, and again at 5 billion digits, with a result of 186.141 seconds compared to 207.729 and 216.487 seconds, respectively. It was also the only system in this set to complete the 10-billion-digit run, finishing in 405.978 seconds. These results show that the P16s combines the Ultra 7 265H with enough thermal headroom to sustain exceptionally strong long-duration compute performance.

Y-Cruncher (Lower time is better) Lenovo ThinkPad P14s Gen 6 (Intel Ultra 7 265H)(NVIDIA RTX PRO 500) Lenovo ThinkPad P16v Gen 3  (Intel Core Ultra 9 285H)(NVIDIA RTX PRO 2000) Lenovo ThinkPad P16s Gen 4 (Intel Core Ultra 7 265H)(NVIDIA RTX PRO 500)
1 Billion 34.056 s 32.690 s 27.472 s
2.5 Billion 96.273 s 92.203 s 81.702 s
5 Billion 216.487 s 207.729 s 186.141 s
10 Billion 405.978 s

Geekbench 6

Geekbench 6 is a cross-platform benchmark that measures overall system performance.

In Geekbench 6, the P16s Gen 4 posted the strongest CPU multi-core score in this group at 15,823, edging out the P16v Gen 3 at 15,185 despite the latter’s higher-tier Ultra 9 processor. Single-core performance remained close across all three systems, with the P16s scoring 2,826. On the GPU side, its OpenCL score of 67,453 closely matches the P14s Gen 6 at 66,784, which is expected given their shared RTX PRO 500 graphics. Overall, the P16s stands out most in sustained CPU throughput rather than GPU compute.

Geekbench 6 (higher is better) Lenovo ThinkPad P14s Gen 6 (Intel Ultra 7 265H)(NVIDIA RTX PRO 500) Lenovo ThinkPad P16v Gen 3  (Intel Core Ultra 9 285H)(NVIDIA RTX PRO 2000) Lenovo ThinkPad P16s Gen 4 (Intel Core Ultra 7 265H)(NVIDIA RTX PRO 500)
CPU
CPU Single-Core 2,713 2,921 2,826
CPU Multi-Core 12,781 15,185 15,823
GPU
GPU OpenCL 66,784 104,861 67,453

V-Ray

The V-Ray Benchmark measures rendering performance for CPUs, NVIDIA GPUs, or both using advanced V-Ray 6 engines. It uses quick tests and a simple scoring system to let users evaluate and compare their systems’ rendering capabilities. It’s an essential tool for professionals seeking efficient performance insights.

As a purely GPU-accelerated rendering benchmark, the V-Ray results align exactly with expectations. The P16s Gen 4 (2,114) performs nearly identically to the P14s Gen 6, trailing the beefier RTX PRO 2000 in the P16v.

Vray (higher is better) Lenovo ThinkPad P14s Gen 6 (Intel Ultra 7 265H)(NVIDIA RTX PRO 500) Lenovo ThinkPad P16v Gen 3  (Intel Core Ultra 9 285H)(NVIDIA RTX PRO 2000) Lenovo ThinkPad P16s Gen 4 (Intel Core Ultra 7 265H)(NVIDIA RTX PRO 500)
Score 2,122 3,233 2,114

PCMark 10

PCMark 10 is an industry-standard benchmark designed to measure complete system performance for modern office environments. It features updated workloads for Windows 10 and evaluates everyday tasks, including productivity, web browsing, video conferencing, and content creation. The benchmark is easy to run, delivers multi-level scoring (from high-level overall to detailed workload scores), and includes dedicated battery life and storage tests. While UL Solutions now recommends Procyon for newer, application-based testing, PCMark 10 remains a reliable and widely-used tool for assessing general PC performance.

The P16s Gen 4 scores a solid 8,667, sitting perfectly between the ultra-mobile P14s and the P16v. This confirms excellent overall system responsiveness for day-to-day productivity, web browsing, and complex office applications.

PCMark 10 (higher is better) Lenovo ThinkPad P14s Gen 6 (Intel Ultra 7 265H)(NVIDIA RTX PRO 500) Lenovo ThinkPad P16v Gen 3  (Intel Core Ultra 9 285H)(NVIDIA RTX PRO 2000) Lenovo ThinkPad P16s Gen 4 (Intel Core Ultra 7 265H)(NVIDIA RTX PRO 500)
Score 8,382 9,007 8,667

3DMark CPU

The 3DMark CPU Profile evaluates processor performance across six threading levels: 1, 2, 4, 8, 16, and max threads. Each test runs the same boid-based simulation workload to assess how well the CPU scales under different thread counts, with minimal GPU involvement. The benchmark helps identify single-threaded efficiency and multithreaded potential for tasks such as gaming, content creation, and rendering. Scores across eight threads often align with modern DirectX 12 gaming performance, while 1–4-thread results reflect older or esports game scenarios.

The CPU Profile reveals some interesting scaling behavior across thread counts. At max and 16 threads, the P16s Gen 4 (10,448 and 10,423) sits just behind the P16v Gen 3 (11,218 and 10,882) as expected, given the latter’s higher-tier Ultra 9 processor. However, at 8 threads and below, the P16s pulls ahead of the P16v, scoring 7,403 vs 7,049 at 8 threads and 4,595 vs 4,039 at 4 threads. Single-thread performance is effectively identical across all three systems, reflecting the shared Meteor Lake architecture.

3DMark CPU (Higher Score is Better) Lenovo ThinkPad P14s Gen 6 (Intel Ultra 7 265H)(NVIDIA RTX PRO 500) Lenovo ThinkPad P16v Gen 3  (Intel Core Ultra 9 285H)(NVIDIA RTX PRO 2000) Lenovo ThinkPad P16s Gen 4 (Intel Core Ultra 7 265H)(NVIDIA RTX PRO 500)
Max Threads 10,377 11,218 10,448
16 Threads 10,294 10,882 10,423
8 Threads 7,525 7,049 7,403
4 threads 4,400 4,039 4,595
2 threads 2,389 2,349 2,416
1 threads 1,222 1,224 1,227

3DMark Storage

The 3DMark Storage Benchmark tests your SSD’s gaming performance by measuring tasks like loading games, saving progress, installing game files, and recording gameplay. It evaluates how well your storage performs in real-world gaming scenarios and supports the latest storage technologies, providing accurate performance insights.

The storage subsystem handles game-style loading, saving, and installation tasks smoothly, scoring 1,797. This further validates the drive’s ability to handle random read/write operations efficiently under heavy multitasking.

3DMark Storage (higher is better) Lenovo ThinkPad P14s Gen 6 (Intel Ultra 7 265H)(NVIDIA RTX PRO 500) Lenovo ThinkPad P16v Gen 3  (Intel Core Ultra 9 285H)(NVIDIA RTX PRO 2000) Lenovo ThinkPad P16s Gen 4 (Intel Core Ultra 7 265H)(NVIDIA RTX PRO 500)
Score 1,700 1,895 1,797

PCMark battery

To measure battery life on mobile systems, we use PCMark 10. It includes a Modern Office benchmark that provides a realistic assessment of battery life during typical workday tasks. It simulates everyday office activities, such as writing documents, browsing the web, and participating in video conferences, with built-in periods of inactivity to mirror how people use their laptops. This isn’t just about peak performance; it focuses on sustained usage under a moderate workload. It is helpful for understanding how long you can expect a laptop to last through a day of office work.

The test operates in 10-minute cycles, balancing active tasks with periods of inactivity. Specifically, the Writing and Web Browsing workloads involve roughly 4.5 minutes of activity followed by 5.5 minutes of inactivity, while Video Conferencing is lighter, at 2 minutes of busy time and 8 minutes of idle time. This approach aims to provide a more accurate representation of real-world battery drain than running demanding tasks continuously, giving you a better idea of longevity for everyday productivity.

Battery life is where the P16s Gen 4’s powerful internals show their cost. Clocking in at 6 hours and 51 minutes in the Modern Office benchmark, it falls a few hours short of the smaller P14s Gen 6 (11 hr 48 minutes). This is the inevitable trade-off of housing a high-wattage Core Ultra 7 265H processor and a vibrant 16-inch display within a slim chassis. While the system supports Rapid Charge to get you back up to 80% quickly, professionals planning a full day of fieldwork, long labs, or back-to-back meetings will absolutely need to keep the 100W adapter close at hand.

PCMark Battery (higher is better) Lenovo ThinkPad P14s Gen 6 (Intel Ultra 7 265H)(NVIDIA RTX PRO 500) Lenovo ThinkPad P16v Gen 3  (Intel Core Ultra 9 285H)(NVIDIA RTX PRO 2000) Lenovo ThinkPad P16s Gen 4 (Intel Core Ultra 7 265H)(NVIDIA RTX PRO 500)
Time Elapsed 11 Hr 48 Min 12 Hr 6 Hr 51 Min

Conclusion

The ThinkPad P16s Gen 4 aims to bridge the gap between portability and workstation-class power, and the data proves it largely succeeds, with a few distinct caveats.

p16s half closed side angle

On the compute side, this machine is an unexpected powerhouse. In CPU-bound workloads such as 7-Zip compression, y-cruncher, and Geekbench 6 multi-core testing, the Core Ultra 7 265H in the P16s didn’t just perform well; it actively outperformed the higher-tier Core Ultra 9 285H in the ThinkPad P16v Gen 3. The 16-inch chassis provides exactly the thermal headroom this silicon needs to stretch its legs, delivering phenomenal sustained multithreaded performance. Paired with Lenovo’s legendary tactile keyboard and trackpad design, it is a remarkably efficient daily driver for developers, data scientists, and engineers running heavy local calculations, provided they stay within reach of a power outlet.

However, the system’s graphical performance and battery life reveal its limits. The inclusion of the 35W NVIDIA RTX PRO 500 is strictly tuned for efficiency and light acceleration. While it handles AI inference tasks and low-power image generation well, it struggles under heavier 3D rendering and complex viewport navigation. Furthermore, the 5-hour and 43-minute battery life means this is not an all-day road warrior; the impressive compute power drains the battery much faster than ultra-mobile alternatives.

p16s closed, rear

Ultimately, the ThinkPad P16s Gen 4 is not a desktop replacement for intensive 3D animation or heavy CAD simulation. Instead, it is a highly targeted precision tool. For IT professionals, network security analysts, and engineers who need massive CPU compute, robust AI acceleration, and tactile reliability in a form factor that won’t break their back, the P16s Gen 4 hits a sweet spot for a mobile workstation. Just remember to pack the charger.

ThinkPad P16s Gen 4 (16″ Intel) Mobile Workstation

The post Lenovo ThinkPad P16s Gen 4 Review: RTX PRO 500 GPU With a CPU That Punches Above Its Tier appeared first on StorageReview.com.

Lenovo ThinkPad P16v Gen 3 Review: RTX PRO 2000 Benchmarked in a 4.6 lb Workstation

An open laptop with a beach lock screen image An open laptop with a beach lock screen image

The ThinkPad P16v Gen 3 is positioned as a versatile, mid-tier powerhouse in Lenovo’s workstation lineup, bridging the gap between the ultra-portable P1 and the desktop-replacement P16. Built for engineers, data scientists, and power users who prioritize sustained performance and hardware longevity, this “AI Ready” machine leverages Intel’s latest Core Ultra “Series 2” architecture. Our review unit, equipped with the flagship Intel Core Ultra 9 285H, harnesses a dedicated NPU for localized AI workloads while calling upon NVIDIA’s RTX PRO 2000 Blackwell GPU for heavy-duty 3D rendering and simulation. While it carries more heft than its P1 sibling, the P16v offers superior thermal headroom and more accessible internal expansion.

ThinkPad P16v Gen 3 full screen
Specification  Lenovo ThinkPad P16v Gen 3
OVERVIEW & PRICING
Product Lenovo ThinkPad P16v Gen 3 – AI Ready – 16″
Model 21RS
Price $3,997.99
PROCESSOR & AI
Processor Intel Core Ultra 9 285H (Series 2)
16-core, 2.9 GHz base, 5.4 GHz Max Turbo
Platform Technology Intel vPro Enterprise
NPU Performance Intel AI Boost (13 TOPS)
GRAPHICS & MEMORY
Discrete Graphics NVIDIA RTX PRO 2000 Blackwell (8 GB GDDR7)
Integrated Graphics Intel Arc 140T
RAM Installed 32 GB (1 x 32 GB) DDR5 SDRAM
Max Memory Supported 96 GB (2 slots total, 1 available)
STORAGE & DISPLAY
Storage 1 TB SSD M.2 2280 PCIe 4.0 x4
NVMe, Performance, TCG Opal Encryption 2
RAID Support RAID 0, RAID 1
Display 16″ IPS LED (1920 x 1200) WUXGA
400 nits, 16:10 aspect ratio, Anti-glare
Screen Features 87.7% screen-to-body ratio, AICCP color calibration, DC dimming, Low Blue Light
CONNECTIVITY & INPUT
Interfaces 2 x Thunderbolt 4 (Power Delivery 3.1)
1 x HDMI 2.1 (up to 8K support)
2 x USB 3.0 (1 Always On)
1 x LAN (RJ-45)
1 x Headphone/microphone combo jack
Networking Wi-Fi 7 (Intel BE201), Bluetooth 5.4, Gigabit Ethernet
Input Devices Backlit Keyboard (English) with Numeric Pad
TrackPoint, UltraNav, Copilot key
PHYSICAL & SECURITY
Dimensions 14.2 x 9.8 x 1 inch
Weight 4.63 lbs
Security Discrete TPM 2.0, Fingerprint reader, IR Camera
Privacy shutter, Ultrasonic Human Presence Detection
Durability MIL-STD-810H tested

Design & Build

The P16v Gen 3 maintains the iconic, professional aesthetic common to the ThinkPad family but opts for a slightly more robust “Thunder Black” chassis. Unlike the carbon fiber and magnesium found in the P1, the P16v uses aluminum for the top cover and a durable polycarbonate-ABS blend for the bottom. This results in a slightly thicker profile (approximately 1 inch) but ensures the device meets the rigorous MIL-STD-810H durability standards. At a starting weight of 4.63 lbs (2.1 kg), it remains portable for a 16-inch machine, though it is noticeably heavier than an ultrabook.
lenovo ThinkPad P16v Gen 3 keyboard close-up

The keyboard remains one of the strongest aspects of the ThinkPad design. The 6-row, spill-resistant keyboard provides deep travel and tactile feedback, now featuring the dedicated Copilot key for immediate AI assistance. The dual-input UltraNav system includes the classic red TrackPoint and a spacious, smooth-surface touchpad. Audio is handled by front-facing stereo speakers with Dolby Atmos, providing clear mids for video conferencing, though it lacks the low-end punch required for media production.
lenovo ThinkPad P16v Gen 3 trackpad close-up

Connectivity is a standout feature, particularly for those in networking or industrial environments. Unlike slimmer workstations that require dongles, the P16v includes a dedicated Gigabit Ethernet (RJ-45) port. This is complemented by two Thunderbolt 4 ports (supporting Power Delivery 3.1), two USB-A 3.2 Gen 1 ports, and an SD Express 7.0 card reader for rapid data offloading. This port array ensures that whether you are in a server room or a field office, the P16v remains self-sufficient.

Camera & Security

A 5.0MP IR camera enables remote collaboration and Windows Hello and includes a privacy shutter and Ultrasonic Human Presence Detection. The camera utilizes fixed focus and temporal noise reduction (TNR) to ensure high-fidelity video even in suboptimal lighting conditions. Beyond the visual hardware, the P16v Gen 3 implements a sophisticated, multi-layered security architecture. At the foundation is a discrete TPM 2.0 chip, certified to TCG and FIPS 140-2 standards, which works in tandem with the touch-style fingerprint reader integrated into the power button. This reader utilizes match-on-chip technology to prevent biometric spoofing.
ThinkPad P16v Gen 3 left side i/o

Firmware-level protection is equally robust, featuring a self-healing BIOS and a comprehensive suite of access controls, including NVMe, Power-on, and Supervisor passwords. For physical security in the field, the chassis includes a Kensington Nano Security Slot and a bottom-cover tamper-detection system that alerts IT administrators when the hardware has been accessed. For corporate fleets, select models also support Intel vPro Enterprise, providing the remote manageability and stability features required for modern enterprise environments.
ThinkPad P16v Gen 3 right side i/o

Upgradability & Internals

Maintenance is a key differentiator for the P16v, offering a level of modularity that favors long-term professional use. Internally, the system features two DDR5 slots (supporting both SODIMM and CSODIMM) that support a maximum memory capacity of 96GB. The system can use high-speed DDR5-6400 CSODIMM modules, ensuring that data-intensive AI and simulation tasks are never memory-bandwidth limited.
lenovo ThinkPad P16v Gen 3 internals

Storage potential is equally impressive, with two M.2 2280 PCIe 4.0 x4 slots that support up to 4TB of total storage. These slots also support RAID 0/1 configurations, allowing users to choose between maximum performance and critical data redundancy. Even the build materials reflect a balance of durability and sustainability; the top cover is crafted from 75% recycled aluminum, while the PC-ABS bottom cover and internal C-cover utilize 30% Post-Consumer Content (PCC) plastic. Powering these internals is a substantial 90Wh Li-ion battery that supports Rapid Charge, capable of reaching 80% capacity in just one hour when used with the provided 140W USB-C GaN adapter.
lenovo ThinkPad P16v Gen 3 internal close-up of two m.2 2280 slots and sodimm ram with one occupied

Lenovo ThinkPad P16v Gen 3 Performance

To evaluate the ThinkPad P16v Gen 3, we ran a wide range of workstation- and AI-focused benchmarks, including Procyon AI, SPECworkstation 4, SPECviewperf, Blender, LuxMark, and several system-level tests measuring CPU, GPU, and storage performance across professional workloads.

Our review configuration was equipped with an Intel Core Ultra 9 285H processor featuring 16 cores and a boost speed of up to 5.38 GHz, paired with an NVIDIA RTX PRO 2000 Blackwell Laptop GPU with 8GB of GDDR7 memory. The system was also configured with 32GB of system memory and a 1TB Samsung NVMe SSD while running Windows 11.

In these benchmarks, we compared the ThinkPad P16v Gen 3 to:

Procyon AI Computer Vision

The Procyon AI Computer Vision Benchmark measures AI inference performance across CPUs, GPUs, and dedicated accelerators using a range of state-of-the-art neural networks. It evaluates tasks such as image classification, object detection, segmentation, and super-resolution using models including MobileNet V3, Inception V4, YOLO V3, DeepLab V3, Real ESRGAN, and ResNet 50. Tests are run on multiple inference engines, including NVIDIA TensorRT, Intel OpenVINO, Qualcomm SNPE, Microsoft Windows ML, and Apple Core ML, providing a broad view of hardware and software efficiency. Results are reported for both float- and integer-optimized models, providing a consistent, practical measure of machine vision performance for professional workloads.

The ThinkPad P16v Gen 3 delivers the strongest AI inference performance among the three systems tested, largely due to its more powerful RTX PRO 2000 GPU and higher-end Core Ultra 9 285H processor. In the Procyon AI Computer Vision benchmark, the system achieved a CPU overall score of 138, matching the P16s Gen 4 while outperforming the smaller P14s Gen 6. Individual model latency results remain consistently fast, with 0.98 ms for MobileNet V3, 9.57 ms for ResNet 50, and 28.26 ms for Inception V4, while heavier workloads, such as Real-ESRGAN, complete noticeably faster than on the RTX PRO 500 systems.

The system’s greatest advantage is evident in GPU inference workloads. Powered by the RTX PRO 2000, the P16v reached a GPU overall score of 490, significantly ahead of the P14s and P16s, which both score around 355 with the RTX PRO 500. This gap widens further in TensorRT testing, where the P16v recorded an overall score of 681 and delivered substantially faster results in models such as YOLO V3 and DeepLab V3. As a result, the P16v stands out as the most capable option for professionals running heavier AI vision workloads or large-scale inference pipelines on a mobile workstation.

CPU Results (average time in ms) Lenovo ThinkPad P14s Gen 6 (Intel Ultra 7 265H)(NVIDIA RTX PRO 500) Lenovo ThinkPad P16v Gen 3  (Intel Core Ultra 9 285H)(NVIDIA RTX PRO 2000) Lenovo ThinkPad P16s Gen 4 (Intel Core Ultra 7 265H)(NVIDIA RTX PRO 500)
AI Computer Vision Overall Score 122 138 138
MobileNet V3 1.11 ms 0.98 ms 1.08 ms
ResNet 50 10.89 ms 9.57 ms 9.80 ms
Inception V4 31.91 ms 28.26 ms 28.44 ms
DeepLab V3 39.42 ms 34.59 ms 35.51 ms
YOLO V3 74.45 ms 68.85 ms 69.87 ms
REAL-ESRGAN 4,161.76 ms 3,442.98 ms 3,016.11 ms
GPU Results (average time in ms) Lenovo ThinkPad P14s Gen 6 (Intel Ultra 7 265H)(NVIDIA RTX PRO 500) Lenovo ThinkPad P16v Gen 3  (Intel Core Ultra 9 285H)(NVIDIA RTX PRO 2000) Lenovo ThinkPad P16s Gen 4 (Intel Core Ultra 7 265H)(NVIDIA RTX PRO 500)
AI Computer Vision Overall Score 355 490 354
MobileNet V3 1.05 ms 0.79 ms 1.03 ms
ResNet 50 3.77 ms 2.80 ms 3.73 ms
Inception V4 10.13 ms 8.05 ms 10.37 ms
DeepLab V3 25.40 ms 19.54 ms 24.74 ms
YOLO V3 19.16 ms 12.70 ms 20.15 ms
REAL-ESRGAN 399.21 ms 256.57 ms 395.42 ms
TensorRT  Lenovo ThinkPad P14s Gen 6 (Intel Ultra 7 265H)(NVIDIA RTX PRO 500) Lenovo ThinkPad P16v Gen 3  (Intel Core Ultra 9 285H)(NVIDIA RTX PRO 2000) Lenovo ThinkPad P16s Gen 4 (Intel Core Ultra 7 265H)(NVIDIA RTX PRO 500)
Overall Score 438 681 484
MobileNet V3 0.76 ms 0.53 ms 0.64 ms
ResNet 50 3.33 ms 2.20 ms 3.05 ms
Inception V4 9.53 ms 7.40 ms 8.67 ms
DeepLab V3 13.34 ms 7.97 ms 11.66 ms
YOLO V3 15.28 ms 7.94 ms 13.76 ms
REAL-ESRGAN 446.47 ms 289.54 ms 444.42 ms

UL Procyon: AI Text Generation

The Procyon AI Text Generation Benchmark streamlines LLM performance testing by providing a concise, consistent evaluation method. It enables repeated testing across multiple LLM models while minimizing the complexity of large models and the number of variables. Developed with AI hardware leaders, it optimizes the use of local AI accelerators to deliver more reliable, efficient performance assessments. The results measured below were tested using TensorRT.

AI text-generation workloads show a clear separation among the three systems. The ThinkPad P16v Gen 3 leads decisively thanks to its RTX PRO 2000 GPU and higher-tier Core Ultra 9 processor. In the Phi model test, the P16v reached an overall score of 1,952, significantly ahead of the P14s Gen 6 (1,307) and P16s Gen 4 (1,339). It also delivered the fastest response times, generating tokens at 67.8 tokens per second with a time-to-first-token of 0.456 seconds, noticeably faster than the roughly 0.67-second response times on the RTX PRO 500 systems.

The same trend continues in the Mistral model benchmark, where the P16v scored 1,745, compared with 1,137 on the P14s and 1,113 on the P16s. Token generation speeds again highlight the GPU advantage, with the P16v producing over 50 tokens per second, while the other two systems remain in the mid-30 range. The P16v was also the only system capable of running the larger Llama3 test configuration, reinforcing its position as the most capable platform for local LLM experimentation and AI-assisted development workflows.

UL Procyon: AI Text Generation  Lenovo ThinkPad P14s Gen 6 (Intel Ultra 7 265H)(NVIDIA RTX PRO 500) Lenovo ThinkPad P16v Gen 3  (Intel Core Ultra 9 285H)(NVIDIA RTX PRO 2000) Lenovo ThinkPad P16s Gen 4 (Intel Core Ultra 7 265H)(NVIDIA RTX PRO 500)
Phi
Phi Overall Score 1,307 1,952 1,339
Phi Output Time To First Token 0.685 s 0.456 s 0.672 s
Phi Output Tokens Per Second 45.671 tokens/s 67.803 tokens/s 47.070 tokens/s
Phi Overall Duration 64.004 s 43.235 s 62.210 s
Mistral
Mistral Overall Score 1,137 1,745 1,113
Mistral Output Time To First Token 1.196 s 0.751 s 1.292 s
Mistral Output Tokens Per Second 33.960 tokens/s 50.213 tokens/s 34.884 tokens/s
Mistral Overall Duration 87.809 s 59.136 s 86.295 s
Llama3
Llama3 Overall Score 1,552
Llama3 Output Time To First Token 0.732 s
Llama3 Output Tokens Per Second 43.409 tokens/s
Llama3 Overall Duration 67.892 s
Llama2
Llama2 Overall Score
Llama2 Output Time To First Token
Llama2 Output Tokens Per Second
Llama2 Overall Duration

UL Procyon: AI Image Generation

The Procyon AI Image Generation Benchmark provides a consistent and accurate method for measuring AI inference performance across a range of hardware, from low-power NPUs to high-end GPUs. It includes three tests: Stable Diffusion XL (FP16) for high-end GPUs, Stable Diffusion 1.5 (FP16) for moderately powerful GPUs, and Stable Diffusion 1.5 (INT8) for low-power devices. The benchmark uses the optimal inference engine for each system, ensuring fair and comparable results.

In AI image generation workloads, GPU performance becomes even more critical. The P16v Gen 3 again leads by a substantial margin, producing a Stable Diffusion 1.5 (FP16) score of 1,084, compared to 697 on the P14s and 708 on the P16s. In practical terms, the P16v generated images at 5.77 seconds per image, while the RTX PRO 500 systems required roughly 9 seconds per image.

The INT8 optimized test shows a similar pattern. The P16v achieved a score of 13,402, significantly outperforming the P14s (8,440) and P16s (8,840). Additionally, the P16v was the only machine capable of running the heavier Stable Diffusion XL workload in this configuration, completing renders at approximately 44 seconds per image. These results make the P16v the strongest option for AI image generation, while the RTX PRO 500 systems remain better suited to lighter generative workloads.

UL Procyon: AI Image Generation  Lenovo ThinkPad P14s Gen 6 (Intel Ultra 7 265H)(NVIDIA RTX PRO 500) Lenovo ThinkPad P16v Gen 3  (Intel Core Ultra 9 285H)(NVIDIA RTX PRO 2000) Lenovo ThinkPad P16s Gen 4 (Intel Core Ultra 7 265H)(NVIDIA RTX PRO 500)
Stable Diffusion 1.5 (FP16)
Stable Diffusion 1.5 (FP16) – Overall Score 697 1,084 708
Stable Diffusion 1.5 (FP16) – Overall Time 143.447 s 92.235 s 141.136 s
Stable Diffusion 1.5 (FP16) – Image Generation Speed 8.965 s/image 5.765 s/image 8.821 s/image
Stable Diffusion 1.5 (INT8)
Stable Diffusion 1.5 (INT8) – Overall Score 8,440 13,402 8,840
Stable Diffusion 1.5 (INT8) – Overall Time 29.619 s 18.653 s 28.278 s
Stable Diffusion 1.5 (INT8) – Image Generation Speed 3.702 s/image 2.332 s/image 3.535 s/image
Stable Diffusion XL (FP16)
Stable Diffusion XL (FP16) – Overall Score 847
Stable Diffusion XL (FP16) – Overall Time 707.623 s
Stable Diffusion XL (FP16) – Image Generation Speed 44.226 s/image

SPECworkstation 4

The SPECworkstation 4.0 benchmark is a comprehensive tool for evaluating all key aspects of workstation performance. It offers a real-world measure of CPU, graphics, accelerator, and disk performance, ensuring professionals have the data to make informed decisions about their hardware investments. The benchmark includes a dedicated set of tests focusing on AI and ML workloads, including data science tasks and ONNX runtime-based inference tests, reflecting the growing importance of AI/ML in workstation environments. It encompasses seven industry verticals and four hardware subsystems, providing a detailed, relevant measure of today’s workstation performance.

SPECworkstation results demonstrate how each system performs across industry-specific workloads. The P16v performs strongly in compute-heavy areas such as AI & Machine Learning (1.63) and Productivity & Development (1.09), slightly outperforming both the P14s and P16s. However, the P16s occasionally pulls ahead in areas like Life Sciences (1.68) and Energy (1.28), likely benefiting from a similar CPU architecture paired with slightly different tuning.

The P14s generally trails the larger systems in most categories, though its results remain competitive considering its smaller chassis and more portable design. Overall, the results suggest the P16v offers the most balanced workstation performance across professional workloads, while the P16s remains close behind in CPU-driven scientific and engineering tasks.

SPECworkstation 4.0.0 (higher is better)  Lenovo ThinkPad P14s Gen 6 (Intel Ultra 7 265H)(NVIDIA RTX PRO 500) Lenovo ThinkPad P16v Gen 3  (Intel Core Ultra 9 285H)(NVIDIA RTX PRO 2000) Lenovo ThinkPad P16s Gen 4 (Intel Core Ultra 7 265H)(NVIDIA RTX PRO 500)
Industry Verticals
AI & Machine Learning 1.45 1.63 1.60
Energy 1.13 1.12 1.28
Financial Services 0.95 0.98 1.101
Life Sciences 1.51 1.62 1.68
Media & Entertainment 1.53 1.60 1.60
Product Design 1.16 1.27 1.32
Productivity & Development 0.87 1.09 1.07

SPECviewperf 15

SPECviewperf 15 is the industry-standard benchmark for evaluating 3D graphics performance across OpenGL, DirectX, and Vulkan APIs. It introduces new workloads, including blender-01 (Blender 3.6), unreal_engine-01 (Unreal Engine 5.4, DirectX 12), and enscape-01 (Enscape 4.0, Vulkan ray tracing), along with updated traces for 3ds Max, CATIA, Creo, Maya, and SolidWorks. With its redesigned GUI, modern application support, and advanced rendering workloads, SPECviewperf 15 provides consistent, real-world insights into professional graphics performance.

SPECviewperf 15 results demonstrate how each system handles professional 3D graphics workloads across OpenGL, DirectX, and Vulkan APIs. The P16v performs strongly across the board, leading in compute-intensive rendering tasks such as creo-04 (133.91), maya-07 (122.09), and medical-04 (105.90), while also topping the field in newer workloads like blender-01 (47.62) and unreal_engine-01 (57.02). The P14s trails in most categories, though it remains reasonably competitive given its portable form factor and shared GPU tier with the P16s. The P16s, despite carrying the same RTX PRO 500 as the P14s, did not submit results for catia-07 or enscape-01, limiting direct comparison in those workloads. Overall, the P16v offers the most consistent and highest graphics performance across all tested viewsets, driven primarily by its RTX PRO 2000 GPU, while the P14s and P16s occupy a similar performance tier notably behind it.

SPECviewperf (higher is better)  Lenovo ThinkPad P14s Gen 6 (Intel Ultra 7 265H)(NVIDIA RTX PRO 500) Lenovo ThinkPad P16v Gen 3  (Intel Core Ultra 9 285H)(NVIDIA RTX PRO 2000) Lenovo ThinkPad P16s Gen 4 (Intel Core Ultra 7 265H)(NVIDIA RTX PRO 500)
3dsmax-08 18.26 30.54 8.98
blender-01 30.19 47.62 13.83
catia-07 32.65 49.64
creo-04 87.59 133.91 62.24
energy-04 34.95 57.13 11.90
enscape-01 19.64 27.82
maya-07 86.42 122.09 37.79
medical-04 74.06 105.90 26.81
solidworks-08 39.26 65.69 35.65
unreal_engine-01 40.99 57.02 31.12

LuxMark

LuxMark is a GPU benchmark that uses LuxRender, an open-source ray-tracing renderer, to evaluate a system’s performance with highly detailed 3D scenes. This benchmark is relevant for assessing the graphical rendering capabilities of servers and workstations, especially for visual effects and architectural visualization applications, where accurate light simulation is crucial.

Ray-tracing performance further reinforces the P16v’s GPU advantage. In the Hallbench scene, the P16v scores 14,583, compared to 9,344 on the P14s and 10,449 on the P16s. The Food scene follows the same pattern, with the P16v reaching 5,536, up from 3,543 and 3,892, respectively.

While both RTX PRO 500 systems remain capable for moderate rendering workloads, the RTX PRO 2000 delivers a noticeable performance uplift in ray-traced rendering. For professionals working in visualization or lighting simulation, the difference can translate directly into faster render previews and shorter iteration cycles.

LuxMark (higher is better)  Lenovo ThinkPad P14s Gen 6 (Intel Ultra 7 265H)(NVIDIA RTX PRO 500) Lenovo ThinkPad P16v Gen 3  (Intel Core Ultra 9 285H)(NVIDIA RTX PRO 2000) Lenovo ThinkPad P16s Gen 4 (Intel Core Ultra 7 265H)(NVIDIA RTX PRO 500)
Hallbench 9,344 14,583 10,449
Food 3,543 5,536 3,892

7-Zip Compression

The 7-Zip Compression Benchmark evaluates CPU performance during compression and decompression tasks, measuring ratings in GIPS (Giga Instructions Per Second) and CPU usage. Higher GIPS and efficient CPU usage indicate superior performance.

CPU-focused workloads show a more balanced comparison between the systems. The P16s Gen 4 leads the 7-Zip benchmark with a total rating of 96.48 GIPS, followed by the P16v at 92.89 GIPS and the P14s at 86.57 GIPS. These results highlight how similar CPU architectures can produce competitive results even in thinner systems.

However, the P16v maintains strong consistency across both compression and decompression workloads, benefiting from its higher-end processor configuration and sustained thermal headroom. For users running heavy compile jobs or large archive operations, both 16-inch systems provide slightly stronger performance than the P14s.

7-Zip Compression Benchmark (higher is Better)  Lenovo ThinkPad P14s Gen 6 (Intel Ultra 7 265H)(NVIDIA RTX PRO 500) Lenovo ThinkPad P16v Gen 3  (Intel Core Ultra 9 285H)(NVIDIA RTX PRO 2000) Lenovo ThinkPad P16s Gen 4 (Intel Core Ultra 7 265H)(NVIDIA RTX PRO 500)
Compression
Current CPU Usage 1,272% 1,221% 1,340%
Current Rating/Usage 6.148 GIPS 7.143 GIPS 7.727 GIPS
Current Rating 78.199 GIPS 87.232 GIPS 103.552 GIPS
Resulting CPU Usage 1,290% 1,260% 1,198%
Resulting Rating/Usage 6.217 GIPS 7.210 GIPS 7.768 GIPS
Resulting Rating 80.191 GIPS 90.840 GIPS 101.986 GIPS
Decompression
Current CPU Usage 1,255% 1,252% 1,198%
Current Rating/Usage 7.375 GIPS 7.701 GIPS 7.313 GIPS
Current Rating 92.580 GIPS 96.410 GIPS 87.601 GIPS
Resulting CPU Usage 1,254% 1,217% 1,236%
Resulting Rating/Usage 7.416 GIPS 7.798 GIPS 7.362 GIPS
Resulting Rating 92.953 GIPS 94.943 GIPS 90.982 GIPS
Total Rating
Total CPU Usage 1,272% 1,238% 1,275%
Total Rating/Usage 6.816 GIPS 7.504 GIPS 7.565 GIPS
Total Rating 86.572 GIPS 92.891 GIPS 96.484 GIPS

Blackmagic RAW Speed Test

The Blackmagic RAW Speed Test is a performance benchmark that measures a system’s capabilities for video playback and editing with the Blackmagic RAW codec. It evaluates how well a system can decode and playback high-resolution video files, reporting frame rates for both CPU- and GPU-based processing.

Video decoding workloads show a modest advantage for the larger systems. In the 8K CPU test, the P16v leads with 76 fps, followed closely by the P16s at 74 fps, while the P14s trails slightly at 65 fps. GPU acceleration narrows the gap further, with the P16s slightly edging out the P16v in the OpenCL test, 86 fps to 84 fps. Overall, both 16-inch systems are stronger choices for high-resolution media workflows, with the P16v holding a small lead in CPU decoding and the P16s posting the top GPU-assisted playback result.

Blackmagic RAW Speed Test  Lenovo ThinkPad P14s Gen 6 (Intel Ultra 7 265H)(NVIDIA RTX PRO 500) Lenovo ThinkPad P16v Gen 3  (Intel Core Ultra 9 285H)(NVIDIA RTX PRO 2000) Lenovo ThinkPad P16s Gen 4 (Intel Core Ultra 7 265H)(NVIDIA RTX PRO 500)
8K CPU 65 76 74
8K OPENCL 63 84 86

Blackmagic Disk Speed Test

The Blackmagic Disk Speed Test evaluates storage performance by measuring read and write speeds, providing insights into a system’s ability to handle data-intensive tasks, such as video editing and large file transfers.

Storage performance is tightly grouped across all three systems, as each configuration uses a high-speed PCIe NVMe drive. The P16s posts the fastest read result at 5,169.3 MB/s, while the P14s records the fastest write speed at 4,794.1 MB/s. The P16v remains close behind in both measures, with 5,023.4 MB/s read and 4,675.3 MB/s write. In practice, storage is not a major differentiator among these systems, as all three provide sufficient bandwidth for demanding professional workloads, including media editing, large-file transfers, and local dataset handling.

Blackmagic Disk Speed Test  Lenovo ThinkPad P14s Gen 6 (Intel Ultra 7 265H)(NVIDIA RTX PRO 500) Lenovo ThinkPad P16v Gen 3  (Intel Core Ultra 9 285H)(NVIDIA RTX PRO 2000) Lenovo ThinkPad P16s Gen 4 (Intel Core Ultra 7 265H)(NVIDIA RTX PRO 500)
Read 5,159.6 MB/s 5,023.4 MB/s 5,169.3 MB/s
Write 4,794.1 MB/s 4,675.3 MB/s 4,624.5 MB/s

Blender 4.5

Blender is an open-source 3D modeling application. This benchmark was run using the Blender Benchmark utility. The score is measured in samples per minute, with higher values indicating better performance.

Blender results show relatively similar CPU rendering performance across the systems, reflecting their closely related processor architectures. The ThinkPad P16v Gen 3 performs best in the Monster (128.24 samples/min) and Junkshop (79.18) scenes, slightly ahead of the P16s Gen 4, while the P16s takes the lead in the Classroom scene (61.04). The differences are modest overall, suggesting that CPU-based rendering workloads scale similarly across these modern Intel platforms.

Blender CPU (samples per minute, higher is better) Lenovo ThinkPad P14s Gen 6 (Intel Ultra 7 265H)(NVIDIA RTX PRO 500) Lenovo ThinkPad P16v Gen 3  (Intel Core Ultra 9 285H)(NVIDIA RTX PRO 2000) Lenovo ThinkPad P16s Gen 4 (Intel Core Ultra 7 265H)(NVIDIA RTX PRO 500)
Monster 118.71 128.24 120.23
Junkshop 73.68 79.18 77.99
Classroom 58.11 57.62 61.04

GPU rendering highlights a larger gap due to the P16v’s stronger RTX PRO 2000 GPU. In the Monster scene, the P16v reaches 1,300 samples per minute, significantly ahead of the P14s (903) and P16s (918) with their RTX PRO 500 GPUs. Similar advantages appear in the Junkshop and Classroom scenes, confirming that the P16v is the clear leader for GPU-accelerated rendering workloads.

Blender GPU (samples per minute, higher is better) Lenovo ThinkPad P14s Gen 6 (Intel Ultra 7 265H)(NVIDIA RTX PRO 500) Lenovo ThinkPad P16v Gen 3  (Intel Core Ultra 9 285H)(NVIDIA RTX PRO 2000) Lenovo ThinkPad P16s Gen 4 (Intel Core Ultra 7 265H)(NVIDIA RTX PRO 500)
Monster 903.13 1,300.29 917.81
Junkshop 620.11 643.87 628.51
Classroom 527.76 607.69 538.79

y-cruncher

y-cruncher is a multithreaded and scalable program that can compute Pi and other mathematical constants to trillions of digits. Since its launch in 2009, it has become a popular benchmarking and stress-testing application for overclockers and hardware enthusiasts.

The y-cruncher benchmark stresses raw CPU compute performance by performing large-scale mathematical calculations. Here, the P16s Gen 4 delivers the fastest results, completing the 1-billion-digit test in 27.47 seconds, ahead of the P16v at 32.69 seconds and the P14s at 34.06 seconds. The same pattern holds at 2.5 billion digits, where the P16s finished in 81.70 seconds versus 92.20 seconds on the P16v, and again at 5 billion digits with 186.14 seconds versus 207.73 seconds. The P16s was also the only system to complete the 10-billion-digit run in this test set. While the P16v still performs well, the P16s shows the strongest sustained scaling under heavy CPU stress workloads.

Y-Cruncher (Lower time is better) Lenovo ThinkPad P14s Gen 6 (Intel Ultra 7 265H)(NVIDIA RTX PRO 500) Lenovo ThinkPad P16v Gen 3  (Intel Core Ultra 9 285H)(NVIDIA RTX PRO 2000) Lenovo ThinkPad P16s Gen 4 (Intel Core Ultra 7 265H)(NVIDIA RTX PRO 500)
1 Billion 34.056 s 32.690 s 27.472 s
2.5 Billion 96.273 s 92.203 s 81.702 s
5 Billion 216.487 s 207.729 s 186.141 s
10 Billion 405.978 s

Geekbench 6

Geekbench 6 is a cross-platform benchmark that measures overall system performance.

Geekbench 6 provides a quick snapshot of overall system performance. The P16v Gen 3 leads in single-core performance, scoring 2,921, while the P16s posts the strongest multi-core score at 15,823, slightly ahead of the P16v’s 15,185. The P14s trails both systems but remains competitive for a smaller workstation-class device.

GPU compute results show the largest gap. The P16v achieves a significantly higher OpenCL score of 104,861, far ahead of the P14s (66,784) and P16s (67,453). This again reflects the advantage of the RTX PRO 2000 GPU in compute-heavy workloads.

Geekbench 6 (higher is better) Lenovo ThinkPad P14s Gen 6 (Intel Ultra 7 265H)(NVIDIA RTX PRO 500) Lenovo ThinkPad P16v Gen 3  (Intel Core Ultra 9 285H)(NVIDIA RTX PRO 2000) Lenovo ThinkPad P16s Gen 4 (Intel Core Ultra 7 265H)(NVIDIA RTX PRO 500)
CPU
CPU Single-Core 2,713 2,921 2,826
CPU Multi-Core 12,781 15,185 15,823
GPU
GPU OpenCL 66,784 104,861 67,453

V-Ray

The V-Ray Benchmark measures rendering performance for CPUs, NVIDIA GPUs, or both using advanced V-Ray 6 engines. It uses quick tests and a simple scoring system to let users evaluate and compare their systems’ rendering capabilities. It’s an essential tool for professionals seeking efficient performance insights.

The V-Ray benchmark highlights GPU rendering capability using the V-Ray 6 engine. The P16v Gen 3 clearly leads, achieving a score of 3,233, compared to 2,122 on the P14s and 2,114 on the P16s. This roughly 50% performance advantage reflects the additional rendering horsepower provided by the RTX PRO 2000.

For professionals working with V-Ray in applications such as architectural visualization or product rendering, the P16v offers a noticeable performance improvement over RTX PRO 500 configurations.

Vray (higher is better) Lenovo ThinkPad P14s Gen 6 (Intel Ultra 7 265H)(NVIDIA RTX PRO 500) Lenovo ThinkPad P16v Gen 3  (Intel Core Ultra 9 285H)(NVIDIA RTX PRO 2000) Lenovo ThinkPad P16s Gen 4 (Intel Core Ultra 7 265H)(NVIDIA RTX PRO 500)
Score 2,122 3,233 2,114

PCMark 10

PCMark 10 is an industry-standard benchmark designed to measure complete system performance for modern office environments. It features updated workloads for Windows 10 and evaluates everyday tasks, including productivity, web browsing, video conferencing, and content creation. The benchmark is easy to run, delivers multi-level scoring (from high-level overall to detailed workload scores), and includes dedicated battery life and storage tests. While UL Solutions now recommends Procyon for newer, application-based testing, PCMark 10 remains a reliable and widely-used tool for assessing general PC performance.

PCMark 10 measures general system performance across common productivity workloads such as web browsing, office tasks, and light content creation. The P16v again leads the group with a score of 9,007, followed by the P16s at 8,667 and the P14s at 8,382.

While the differences are relatively small, they indicate that all three systems deliver strong everyday performance. Even the smaller P14s provides more than enough power for modern productivity workloads.

PCMark 10 (higher is better) Lenovo ThinkPad P14s Gen 6 (Intel Ultra 7 265H)(NVIDIA RTX PRO 500) Lenovo ThinkPad P16v Gen 3  (Intel Core Ultra 9 285H)(NVIDIA RTX PRO 2000) Lenovo ThinkPad P16s Gen 4 (Intel Core Ultra 7 265H)(NVIDIA RTX PRO 500)
Score 8,382 9,007 8,667

3DMark CPU

The 3DMark CPU Profile evaluates processor performance across six threading levels: 1, 2, 4, 8, 16, and max threads. Each test runs the same boid-based simulation workload to assess how well the CPU scales under different thread counts, with minimal GPU involvement. The benchmark helps identify single-thread efficiency as well as multithreaded potential for tasks like gaming, content creation, and rendering. Scores across eight threads often align with modern DirectX 12 gaming performance, while 1–4-thread results reflect older or esports game scenarios.

The 3DMark CPU Profile evaluates how well each processor scales across different thread counts. The P16v posts the highest maximum thread score at 11,218, slightly ahead of the P16s (10,448) and P14s (10,377). However, the P16s performs well in lower thread scenarios, leading the 4-thread and 2-thread tests, which can reflect performance in lightly threaded workloads.

Overall, results across all systems remain very close, suggesting similar CPU architectures and strong multithreaded scaling across the lineup.

3DMark CPU (Higher Score is Better) Lenovo ThinkPad P14s Gen 6 (Intel Ultra 7 265H)(NVIDIA RTX PRO 500) Lenovo ThinkPad P16v Gen 3  (Intel Core Ultra 9 285H)(NVIDIA RTX PRO 2000) Lenovo ThinkPad P16s Gen 4 (Intel Core Ultra 7 265H)(NVIDIA RTX PRO 500)
Max Threads 10,377 11,218 10,448
16 Threads 10,294 10,882 10,423
8 Threads 7,525 7,049 7,403
4 threads 4,400 4,039 4,595
2 threads 2,389 2,349 2,416
1 threads 1,222 1,224 1,227

3DMark Storage

The 3DMark Storage Benchmark tests your SSD’s gaming performance by measuring tasks like loading games, saving progress, installing game files, and recording gameplay. It evaluates how well your storage performs in real-world gaming scenarios and supports the latest storage technologies to provide accurate performance insights.

Storage performance is very similar across all three systems. The P16v achieves the highest score at 1,895, followed by the P16s at 1,797 and the P14s at 1,700. These results indicate fast NVMe SSD performance capable of handling tasks like large game installs, file transfers, and heavy application loading.

In practical use, the differences between the systems are unlikely to be noticeable, as all three deliver strong PCIe NVMe storage performance.

3DMark Storage (higher is better) Lenovo ThinkPad P14s Gen 6 (Intel Ultra 7 265H)(NVIDIA RTX PRO 500) Lenovo ThinkPad P16v Gen 3  (Intel Core Ultra 9 285H)(NVIDIA RTX PRO 2000) Lenovo ThinkPad P16s Gen 4 (Intel Core Ultra 7 265H)(NVIDIA RTX PRO 500)
Score 1,700 1,895 1,797

PCMark Battery

To measure battery life on mobile systems, we use PCMark 10. It includes a Modern Office benchmark that provides a realistic assessment of battery life during typical workday tasks. It simulates everyday office activities, such as writing documents, browsing the web, and participating in video conferences, with built-in periods of inactivity to mirror how people use their laptops. This isn’t just about peak performance; it focuses on sustained usage under a moderate workload. It is helpful for understanding how long you can expect a laptop to last through a day of office work.

The test operates in 10-minute cycles, balancing active tasks with periods of inactivity. Specifically, the Writing and Web Browsing workloads involve roughly 4.5 minutes of activity followed by 5.5 minutes of inactivity, while Video Conferencing is lighter, at 2 minutes of busy time and 8 minutes of idle time. This approach aims to provide a more accurate representation of real-world battery drain than running demanding tasks continuously, giving you a better idea of longevity for everyday productivity.

The ThinkPad P16s Gen 4 trails the other systems with 6 hours and 51 minutes, which is largely attributable to its smaller 75Wh battery. In contrast, the ThinkPad P16v Gen 3 benefits from a larger 90Wh pack, helping it reach the longest runtime in the test at 12 hours, while the P14s Gen 6 closely follows with 11 hours and 48 minutes using the same 75Wh capacity as the P16s.

PCMark Battery (higher is better) Lenovo ThinkPad P14s Gen 6 (Intel Ultra 7 265H)(NVIDIA RTX PRO 500) Lenovo ThinkPad P16v Gen 3  (Intel Core Ultra 9 285H)(NVIDIA RTX PRO 2000) Lenovo ThinkPad P16s Gen 4 (Intel Core Ultra 7 265H)(NVIDIA RTX PRO 500)
Time Elapsed 11 Hr 48 Min 12 Hr 6 Hr 51 Min

Conclusion

The ThinkPad P16v Gen 3 successfully fills an important role in Lenovo’s mobile workstation lineup. It delivers significantly more GPU and AI performance than thinner systems like the P14s, while remaining more portable and accessible than the larger P16 desktop-replacement models. For many professional workloads, this balance makes it one of the most practical configurations in the series.
top detail photo p16v aluminum

Across nearly every graphics and AI benchmark, the RTX PRO 2000 GPU provides a clear advantage. Tests such as SPECviewperf, LuxMark, and the Procyon AI suites consistently show meaningful performance gains over systems equipped with the RTX PRO 500. These differences become especially apparent in GPU-accelerated tasks such as ray tracing, generative AI inference, and real-time visualization workloads. Professionals working in CAD, 3D modeling, machine-learning experimentation, or AI-assisted development will benefit from additional compute headroom.

CPU performance is more evenly matched across the systems tested. The Core Ultra 9 285H delivers strong multithreaded performance, but SPECworkstation and compression results indicate that similar Intel architectures in the P16s remain competitive in CPU-heavy scenarios. The P16v’s advantage, therefore, comes primarily from its stronger graphics hardware and slightly larger thermal envelope, which allows it to sustain higher GPU performance during longer workloads.

Beyond raw performance, the P16v retains the strengths traditionally associated with ThinkPad workstations. The system offers excellent keyboard ergonomics, robust enterprise security features, and a wide selection of ports, including Ethernet and Thunderbolt 4. Internal expansion remains a highlight, with upgradeable memory and dual M.2 storage slots providing flexibility for long-term professional use.

Overall, the ThinkPad P16v Gen 3 stands out as a balanced mobile workstation that prioritizes real performance without sacrificing portability. For users who need stronger GPU acceleration and local AI capabilities than ultrathin workstations can deliver but do not want the size and weight of a full desktop replacement, the P16v represents a compelling middle ground.

ThinkPad P16v Gen 3 (16″ Intel) Mobile Workstation

The post Lenovo ThinkPad P16v Gen 3 Review: RTX PRO 2000 Benchmarked in a 4.6 lb Workstation appeared first on StorageReview.com.

Micron 3610 Review: A Focused Entry Into Gen5 QLC

The Micron 3610 SSD targets the evolving needs of mainstream computing and is widely positioned as one of the first PCIe Gen5 client SSDs built on QLC NAND. By pairing Micron’s latest 9th-generation (G9) QLC with a DRAMless, power-conscious design, the 3610 aims to bridge the gap between notebook efficiency and the burst performance expected from a modern Gen5 interface. Available in capacities from 1TB to 4TB and multiple M.2 form factors, this review focuses on the 2TB 2280 single-sided model to see how well that balance holds up in real-world testing.

Micron 3610

Examining the performance specs reveals that sequential reads hit a staggering 11,000 MB/s across all capacities, with writes reaching 9,300 MB/s for the 2TB and 4TB models. Random IOPS have also seen a massive uplift, reaching up to 1,500K for reads and 1,600K for writes. Despite this performance, the drive maintains a focus on efficiency for notebook deployments, boasting up to 43% better performance per watt than previous Gen4 TLC solutions.

Micron 3610 back

Micron 3610 Features and Market Positioning

Micron leverages its G9 QLC NAND with a Phison E31 controller on the 3610, featuring the industry’s first 2TB QLC NAND die. This density enables high capacity in small form factors, while the ONFI 5.0 interface supports internal speeds up to 3.6 GT/s. By moving to a DRAM-less architecture that utilizes a Host Memory Buffer (HMB), Micron keeps the physical footprint and power consumption low, making it ideal for thin-and-light laptops that still require workstation-class burst speeds.

Endurance ratings are solid for QLC, ranging from 400 TBW for the 1TB model to 1600 TBW for the 4TB version. The drive also emphasizes security, featuring DICE (Device Identifier Composition Engine) and DOE (Data Object Exchange) protocols to ensure firmware integrity.

In terms of positioning, the Micron 3610 is a niche disruptor. It competes directly with entry-level Gen5 drives and high-end Gen4 TLC drives, offering a compelling alternative for users who prioritize burst speed and modern interface support over sustained heavy write endurance or low-latency daily tasks.

Specification 1TB 2TB 4TB
General Information
Category Mainstream PCs and notebooks
Model Micron 3610 SSD
Form factor M.2 (22mm x 30mm, 22mm x 42mm, 22mm x 80mm)
Interface PCIe Gen5, NVMe 2.0d
Performance
Sequential read (MB/s) 11,000 11,000 11,000
Sequential write (MB/s) 7,200 9,300 9,300
Random read (KIOPS) 850 1,500 1,500
Random write (KIOPS) 1,500 1,600 1,600
Read latency (TYP) (µs) 50 50 50
Write latency (TYP) (µs) 12 12 12
Reliability & Endurance
Endurance (TBW) 400 800 1600
MTTF (million hours) 2 2 2
Power Consumption
Sleep/PS4 power (mW) <2.5 <2.5 <2.5
Active idle power (mW) <150 <150 <150
Active read power (mW) <6,500 <6,500 <6,500
Advanced Features
Feature List Micron G9 QLC NAND
Hardware-based AES 256-bit encryption
Power-loss protection (data at rest)
Host-controlled thermal management (HCTM)
Performance-enhancing Micron AWT
Thermal S.M.A.R.T. via SMBus
Basic management commands (BMC)
FW activate without reset
Sanitize block and crypto erase
Power-loss signal support
TCG Opal 2.02, TCG Pyrite 2.01, DOE, DICE
Micron Storage Executive SSD management tool

Peak Synthetic Performance

The FIO test is a flexible and powerful benchmarking tool for measuring the performance of storage devices, including SSDs and HDDs. It evaluates metrics such as bandwidth, IOPS, and latency under different workloads, like sequential and random read/write operations. This test helps to assess the peak performance of storage systems, making it useful for comparing different devices or configurations. We measured the peak burst performance for this test, limiting the workload to a 10GB footprint on both SSDs.

In the FIO synthetic benchmarks, the Micron 3610 displays a very unusual performance profile compared to other QLC drives. While most drives prioritize read speeds, the 3610 actually performs better in sequential writes than in reads.

The 3610’s sequential read speed (6,839 MB/s) is the lowest in the QLC stack, trailing the Crucial P510 (8,835 MB/s) and PNY CS2150 (10,400 MB/s). However, its sequential write speed (9,673 MB/s) is significantly higher than the Micron 2600 (6,612 MB/s) and Crucial P310 (6,376 MB/s). It also punches well above its weight in random 4K writes (1.871M IOPS), outperforming all other QLC competitors, including the PNY CS2150 and Crucial P310.

FIO Test (higher MB/s/IOPS is better) Sequential 128K Read (1T/64Q) Sequential 128K Write (1T/64Q) Random 4K Read (16T/32Q) Random 4K Write (16T/32Q)
SanDisk SN8100 15,000 MB/s (0.56ms avg latency) 14,100 MB/s (0.59ms avg latency) 2.312M IOPS (0.22ms avg latency) 2.144M IOPS (0.24ms avg latency)
Kingston FURY Renegade G5 14,600 MB/s (0.57ms avg latency) 14,100 MB/s (0.59ms avg latency) 2.028M IOPS (0.25ms avg latency) 2.028M IOPS (0.25ms avg latency)
Samsung 9100 Pro 14,600 MB/s (0.57ms avg latency) 13,300 MB/s (0.63ms avg latency) 2.734M IOPS (0.18ms avg latency) 2.734M IOPS (0.19ms avg latency)
SK hynix Platinum P51 14,500 MB/s (0.58ms avg latency) 13,500 MB/s (0.62ms avg latency) 2.369M IOPS (0.22ms avg latency) 2.669M IOPS (0.19ms avg latency)
Crucial T705 14,400 MB/s (0.58ms avg latency) 12,300 MB/s (0.68ms avg latency) 1.585M IOPS (0.32ms avg latency) 2.703M IOPS (0.19ms avg latency)
TEAMGROUP GE Pro 2TB 13,900 MB/s (0.60ms avg latency) 12,800 MB/s (0.65ms avg latency) 2.585M IOPS (0.23ms avg latency) 1.818M IOPS (0.28ms avg latency)
Lexar Professional NM1090 PRO 13,800GB/s (0.61ms avg latency) 13,600 MB/s (0.62ms avg latency) 2.251M IOPS (0.23ms avg latency) 1.818M IOPS (0.28ms avg latency)
TEAMGROUP GC Pro 2TB 13,600 MB/s (0.62ms avg latency) 12,700 MB/s (0.66ms avg latency) 2.110M IOPS (0.24ms avg latency) 1.686M IOPS (0.28ms avg latency)
PNY CS2150 10,400GB/s (0.80ms avg latency) 8,801MB/s (0.95ms avg latency) 1.379M IOPS (0.371ms avg latency) 1.623 IOPS (0.32ms avg latency)
Crucial P510 8,835 MiB/s (0.90 ms avg latency) 9,961 MB/s (0.80 ms avg latency) 1.163M IOPS (0.44ms avg latency) 1.196M IOPS (0.51ms avg latency)
Micron 3610 2TB 6,839 MB/s (1.23ms avg latency) 9,673 MB/s (0.87ms avg latency) 1.523M IOPS (0.34ms avg latency) 1.871M IOPS (0.27ms avg latency)
Samsung 990 Pro 7,483 MB/s (1.12ms avg latency) 7,197 MB/s (1.16ms avg latency) 1.400M IOPS (0.36ms avg latency) 1.403M IOPS (0.36ms avg latency)
Crucial P310 2TB 7,197 MB/s (1.16ms avg latency) 6,376 MB/s (1.31ms avg latency) 1.163M IOPS (0.44ms avg latency) 1.196M IOPS (0.43ms avg latency)
WD SN850X 2TB 6,632 MB/s (0.76ms avg latency) 7,235 MB/s (0.92ms avg latency) 1.2M IOPS (0.43ms avg latency) 825K IOPS (0.62ms avg latency)
Micron 2600 2TB 5,702 MB/s (1.47ms avg latency) 6,612 MB/s (1.27ms avg latency) 1.11M IOPS (0.46ms avg latency) 1.36M IOPS (0.38ms avg latency)

Average LLM Load Time

The Average LLM Load Time test evaluated the load times of three different LLMs: DeepSeek R1 7B, Meta Llama 3.2 11B, and DeepSeek R1 32B. Each model was tested 10 times, and the average load time was calculated. This test measures the drive’s ability to quickly load large language models (LLMs) into memory. LLM load times are critical for AI-related tasks, especially for real-time inference and processing large datasets. Faster loading enables the model to process data more quickly, thereby improving AI responsiveness and reducing wait times.

When it comes to loading Large Language Models into memory, the Micron 3610 ranks last among QLC drives. Because LLM loading is a read-intensive task, the 3610’s lower sequential read ceiling becomes a bottleneck. For the DeepSeek R1 32B model, the 3610 takes 5.57 seconds, which is nearly a full second slower than the PNY CS2150 (4.89s). Across all three models (7B, 11B, and 32B), the 3610 consistently trails the Crucial P510 and Micron 2600, making it less suitable for users who frequently swap large AI models in and out of VRAM.

Average LLM Load Time (lower is better) DeepSeek R1 7B Meta Llama 3.2 11B Vision DeepSeek R1 32B
SK hynix Platinum P51 2.5481s 3.5809s 4.1790s
SanDisk SN8100 2.5702s 3.5856s 4.2870s
Samsung 9100 Pro 4TB 2.6173s 3.6017s 4.3735s
PNY CS2150 2.8107s 3.6820s 4.8962s
Crucial T705 2TB 2.8758s 3.6312s 5.1080s
Samsung 990 Pro 2TB 2.8758s 3.6312s 5.1080s
Crucial P510 1TB 2.8817s 3.6631s 5.0594s
TEAMGROUP GE Pro 2TB 2.9092s 3.9136s 4.8974s
TEAMGROUP GC Pro 2TB 2.9379s 3.9267s 4.8188s
WD SN850X 2TB 3.0082s 3.6543s 5.4844s
Kingston FURY Renegade G5 3.1843s 4.8009s 4.6523s
Crucial P310 2TB 3.1889s 3.7083s 5.4844s
Lexar Professional NM1090 PRO 3.2135s 4.9504s 7.2108s
Micron 2600 2TB 3.3178s 3.9174s 5.9060s
Micron 3610 2TB 3.5348s 5.3853s 5.5731s

3DMark Direct Storage

The 3DMark DirectStorage Feature Test evaluates how Microsoft’s DirectStorage optimizes game asset loading on PCIe SSDs. By reducing CPU overhead and improving data transfer speeds, DirectStorage enhances loading times, especially when paired with GDeflate compression and Windows 11’s BypassIO. This test isolates storage performance to highlight the potential bandwidth improvements when DirectStorage is enabled.

The Micron 3610 finds its redemption in DirectStorage scenarios. Despite its lower synthetic read speeds, it handles compressed game assets surprisingly well. In the Storage to VRAM (GDeflate) test, the 3610 reached 20.29 GB/s, beating out the Crucial P510 (19.63 GB/s) and the PNY CS2150 (19.49 GB/s). It significantly outperforms the Micron 2600 (14.11 GB/s) and Crucial P310 (14.81 GB/s) in this category, suggesting that its controller or firmware is better optimized for the high-bandwidth, multi-request nature of DirectStorage.

3DMark Direct Storage, (GB/s, higher is better) Storage to VRAM (GDeflate Compression) Storage to VRAM (DirectStorage on, Uncompressed) Storage to VRAM (DirectStorage off, Uncompressed) Storage to RAM (DirectStorage on, Uncompressed) Storage to RAM (DirectStorage off, Uncompressed) GDeflate Decompression Bandwidth
SK hynix Platinum P51 26.32 11.20 7.75 12.85 9.46 64.68
SanDisk SN8100 26.11 12.94 7.63 12.94 9.78 64.51
Crucial T705 2TB 25.75 10.71 8.79 12.03 8.83 66.36
TEAMGROUP GE Pro 2TB 24.70 10.19 7.49 11.33 9.35 65.05
Lexar Professional NM1090 PRO 24.03 11.23 7.57 12.18 8.72 63.15
Samsung 9100 Pro 4TB 23.77 11.26 8.92 11.62 9.48 66.61
Kingston FURY Renegade G5 23.29 10.03 7.44 11.81 9.63 65.79
TEAMGROUP GC Pro 2TB 22.94 9.46 7.13 10.71 8.14 63.80
Micron 3610 2TB 20.29 9.42 6.94 7.93 8.48 65.46
Crucial P510 1TB 19.63 8.33 6.92 9.06 7.49 66.22
PNY CS2150 19.49 8.60 6.98 9.22 7.70 62.43
WD SN850X 2TB 15.28 11.11 8.93 6.78 6.27 64.96
Crucial P310 2TB 14.81 10.75 8.56 6.46 5.87 65.43
Samsung 990 Pro 2TB 14.18 11.28 8.84 6.57 6.20 65.71
Micron 2600 2TB 14.11 5.93 5.27 6.34 5.50 64.09

PCMark 10 Storage Benchmark

PCMark 10 Storage Benchmarks evaluate real-world storage performance using application-based traces. It tests the system and data drives, measuring bandwidth, access times, and consistency under load. These benchmarks offer practical insights beyond synthetic tests, enabling users to compare modern storage solutions effectively.

In real-world application traces, the Micron 3610 struggles to keep pace with the rest of the QLC stack. With a score of 5,635, it is the lowest-performing QLC drive in this specific test. It lags the Micron 2600 (5,885) and trails the Crucial P310 (6,436) by a significant margin. This indicates that for general “daily driver” tasks like booting Windows, launching apps, or moving small files, the 3610’s latency and overhead result in a less responsive experience than its peers.
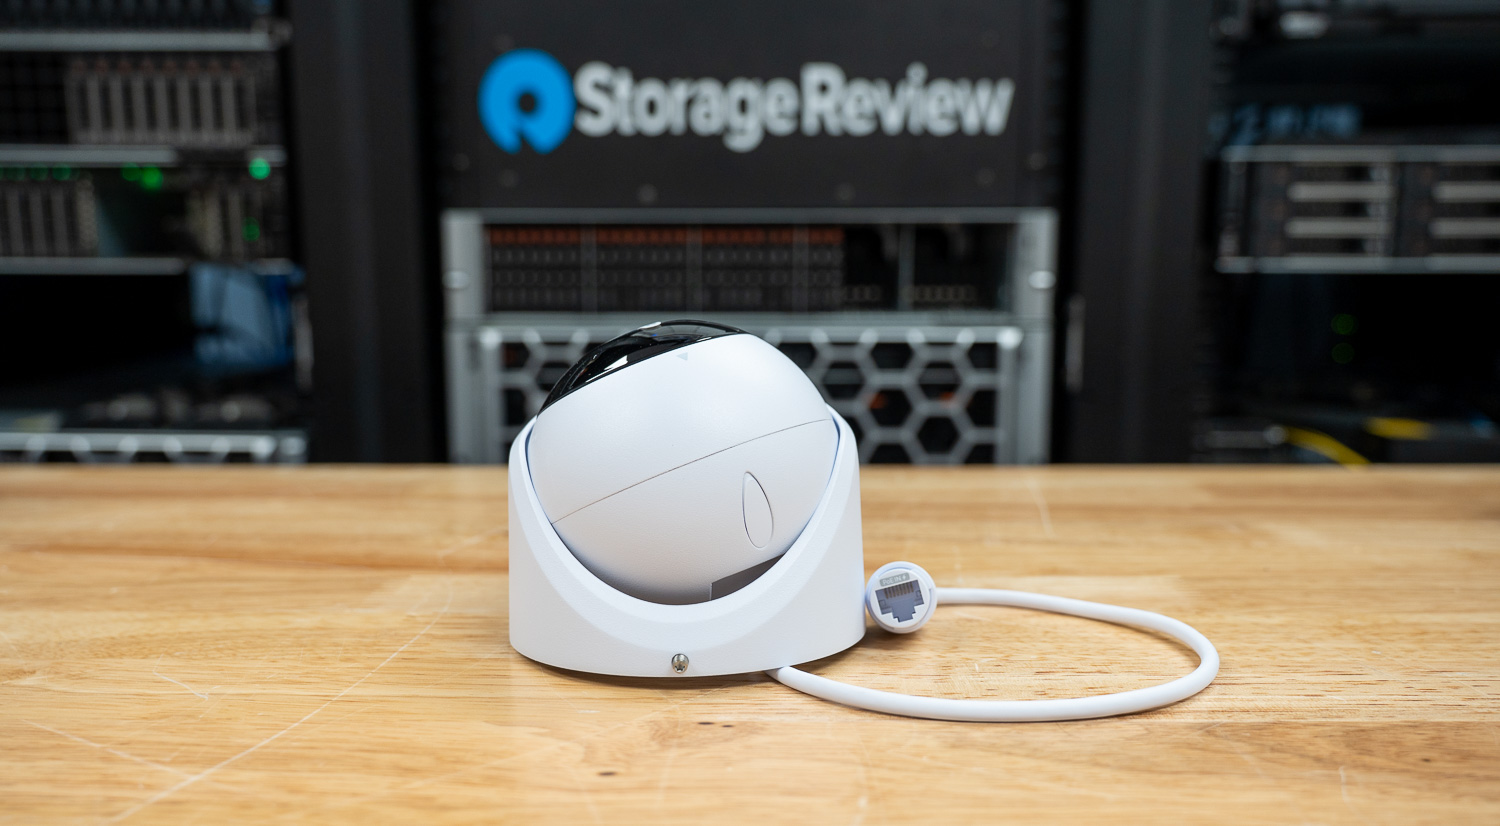
PCMark 10 Data Drive (higher is better) Overall Score
Crucial T705 2TB 8,783
SK hynix Platinum P51 8,665
SanDisk SN8100 8,644
Lexar Professional NM1090 PRO 8,247
Kingston FURY Renegade G5 8,062
TEAMGROUP GC Pro 2TB 7,648
Samsung 9100 Pro 4TB 7,552
Samsung 990 Pro 2TB 7,173
TEAMGROUP GE Pro 2TB 6,957
Crucial P310 2TB 6,436
PNY CS2150 6,070
Micron 2600 2TB 5,885
Micron 3610 2TB 5,635
WD SN850X 2TB 4,988

BlackMagic Disk Speed Test

The BlackMagic Disk Speed Test benchmarks a drive’s read and write speeds to estimate its performance, especially for video editing tasks. It helps users ensure their storage is fast enough for high-resolution content, like 4K or 8K video.

In the BlackMagic test, we see the trade-offs of 4-bit NAND. While most TLC drives are pushing 9,000+ MB/s, the QLC models sit at the bottom, but with one major surprise. Despite being QLC, it achieves an 8,519 MB/s write speed, outperforming TLC competitor drives like the Samsung 990 Pro and WD SN850X in this specific burst test. This is likely due to Micron’s aggressive SLC caching.
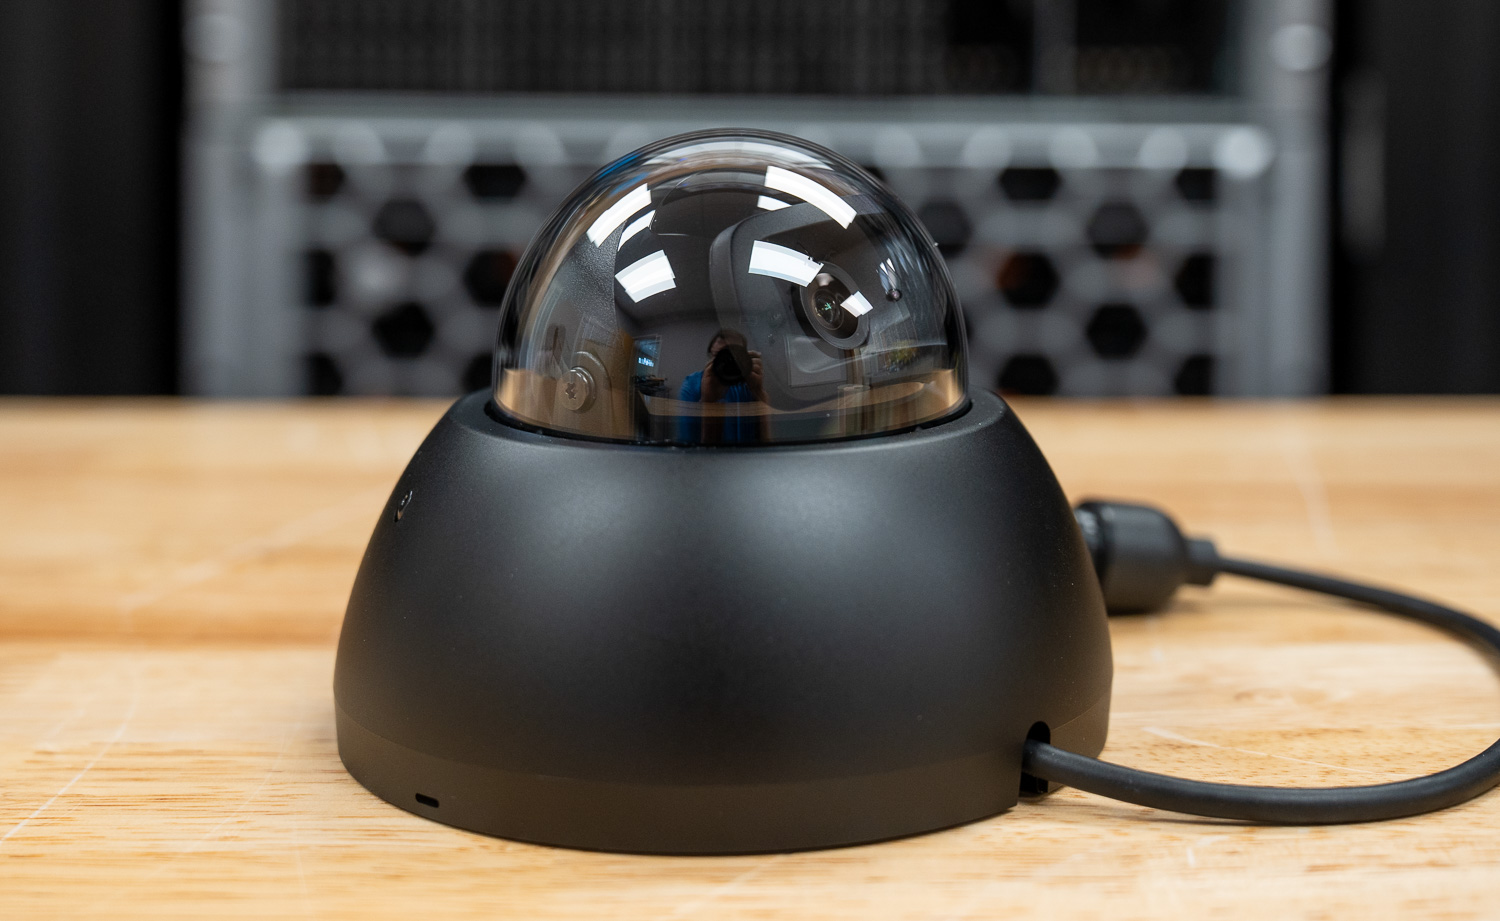
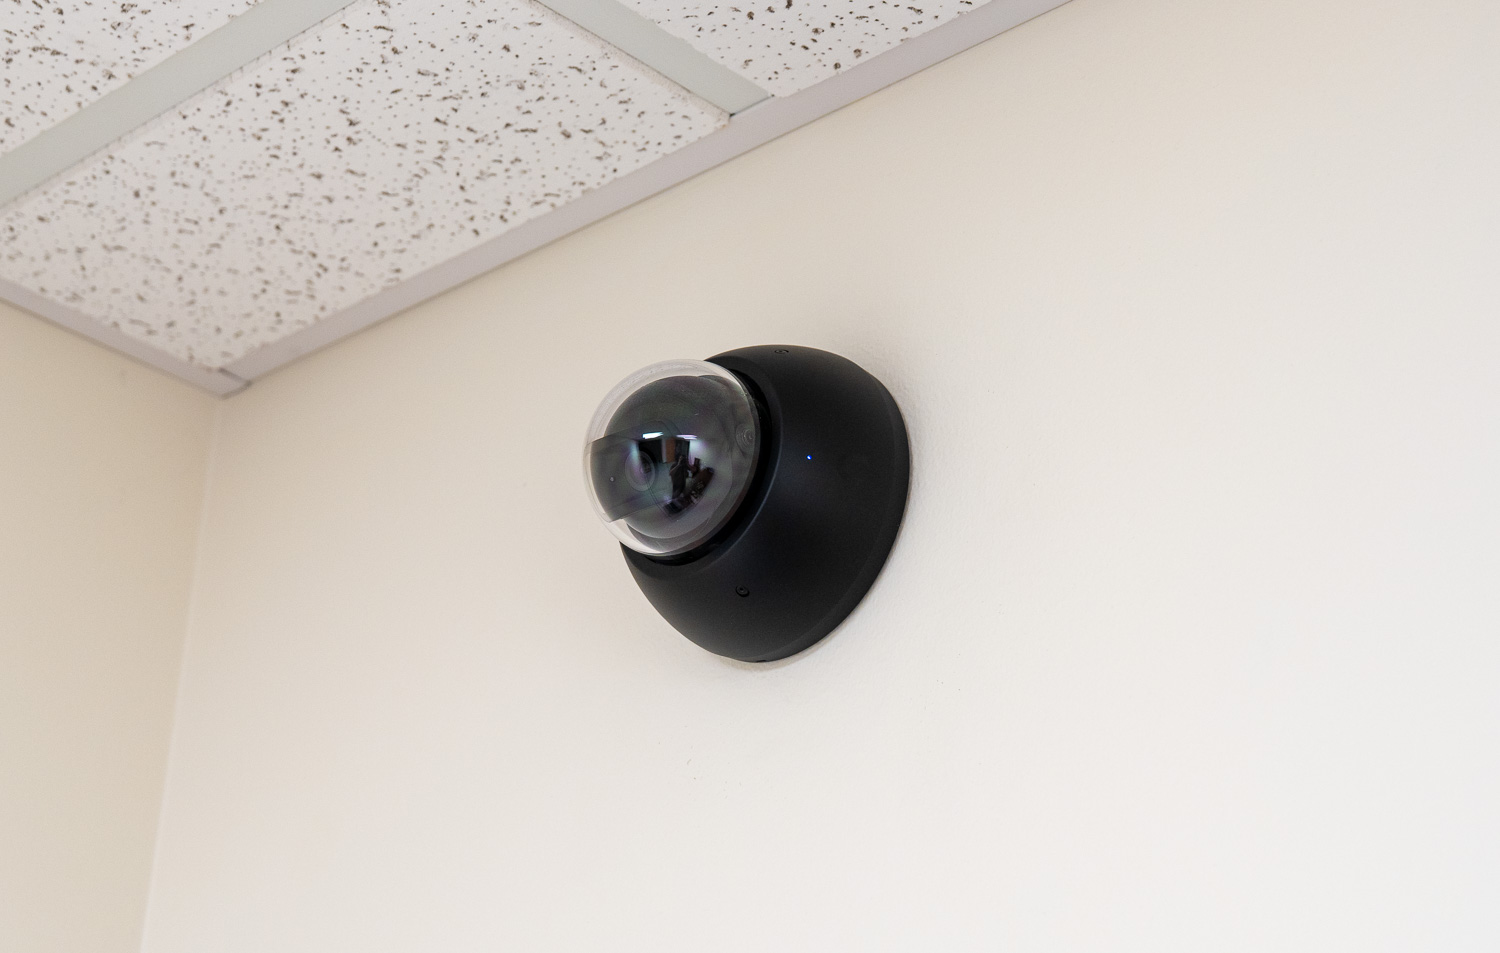
BlackMagic Disk Speed (MB/s, higher is better) Read MB/s Write MB/s
SanDisk SN8100 10,005.2 10,581.0
Kingston FURY Renegade G5 9,665.0 10,831.0
Samsung 9100 Pro 4TB 9,542.3 9,907.9
SK hynix Platinum P51 9,241.0 9,109.0
Lexar Professional NM1090 PRO 9,149.2 10,466.6
Crucial T705 2TB 8,464.2 10,256.4
Crucial P510 1TB 7,853.9 7,939.6
TEAMGROUP GE Pro 2TB 6933.6 8700.6
PNY CS2150 6,625.5 7,299.5
TEAMGROUP GC Pro 2TB 6,476.8 7,796.8
WD SN850X 2TB 5,862.6 5,894.8
Micron 3610 2TB 5,834,9 8,519.1
Samsung 990 Pro 2TB 5,769.5 5,842.9
Crucial P310 2TB 5,282.4 5,458.9
Micron 2600 2TB 4,663.3 5,607.4

GPU Direct Storage

One of the tests we conducted on this testbench was the Magnum IO GPU Direct Storage (GDS) test. GDS is a feature developed by NVIDIA that allows GPUs to bypass the CPU when accessing data stored on NVMe drives or other high-speed storage devices. Instead of routing data through the CPU and system memory, GDS enables direct communication between the GPU and the storage device, significantly reducing latency and improving data throughput.

How GPU Direct Storage Works

Traditionally, when a GPU processes data stored on an NVMe drive, the data must first travel through the CPU and system memory before reaching the GPU. This process introduces bottlenecks because the CPU acts as a middleman, adding latency and consuming valuable system resources. GPU Direct Storage eliminates this inefficiency by enabling the GPU to access data directly from the storage device via the PCIe bus. This direct path reduces data-movement overhead, enabling faster, more efficient data transfers.

AI workloads, especially those involving deep learning, are highly data-intensive. Training large neural networks requires processing terabytes of data, and any delay in data transfer can lead to underutilized GPUs and longer training times. GPU Direct Storage addresses this challenge by ensuring that data is delivered to the GPU as quickly as possible, minimizing idle time and maximizing computational efficiency.

In addition, GDS is particularly beneficial for workloads that involve streaming large datasets, such as video processing, natural language processing, or real-time inference. By reducing the reliance on the CPU, GDS accelerates data movement and frees up CPU resources for other tasks, further enhancing overall system performance.

The data truly gets “spicy” when analyzing GPU Direct Storage (GDS) performance, particularly where the Micron 3610 starts to show cracks in QLC performance. While GDS is engineered to bypass the CPU and feed data directly to the GPU to reduce latency, the 3610 sees its 16K Block Average Write speed plummet to a measly 307.7 MiB/s, which is a sharp decline compared to the 1.5–2.4 GiB/s seen by Gen 5 TLC drives. This performance crater is essentially the “QLC Tax” in action: the drive’s DRAMless architecture, paired with the slower nature of QLC NAND, struggles with small-block random writes, causing it to effectively “stutter” when handling tiny data chunks directly from the GPU. Paradoxically, the Crucial P310 and Micron 2600, which are both older Gen 4 QLC designs, show far greater consistency at this 16K block size, with speeds reaching 2.1–2.2 GiB/s. This suggests that for AI or gaming workloads involving massive quantities of small files, the more mature Gen 4 QLC architecture is actually more stable and reliable than the early, “speed-focused” Gen 5 QLC implementation found in the 3610.

GDSIO Chart (16K,128K,1M Block Size Averages) (16K Block Size 128 IO Depth) Average Read (16K Block Size 128 IO Depth) Average Write (128K Block Size 128 IO Depth) Average Read (128K Block Size 128 IO Depth) Average Write (1M Block Size 128 IO Depth) Average Read (1M Block Size 128 IO Depth) Average Write
Kingston FURY Renegade G5 3.7 GiB/s (0.526ms) IOPS: 242.1K 2.4 GiB/s (0.824ms) IOPS: 154.7K 5.9 GiB/s (2.704ms) IOPS: 48.5K 5.8 GiB/s (0.564ms) IOPS: 47.3K 6.5 GiB/s (19.356ms) IOPS: 6.6K 6.3 GiB/s (19.690ms) IOPS: 6.5K
Lexar Professional NM1090 PRO 3.6 GiB/s (0.533ms) IOPS: 238.7K 2.3 GiB/s (0.845ms) IOPS: 150.8K 5.9 GiB/s (2.639ms) IOPS: 48.4K 4.2 GiB/s (3.714ms) IOPS: 34.4K 6.5 GiB/s (19.274ms) IOPS: 6.6K 6.2 GiB/s (20.127ms) IOPS: 6.4K
SanDisk SN8100 3.4 GiB/s (0.564ms) IOPS: 225.9K 2.1 GiB/s (0.907ms) IOPS: 140.6K 5.9 GiB/s (2.626ms) IOPS: 48.7K 5.8 GiB/s (2.668ms) IOPS: 47.9K 6.5 GiB/s (19.264ms) IOPS: 6.6K 5.9 GiB/s (21.063ms) IOPS: 6.1K
Samsung 9100 Pro 4TB 3.4 GiB/s (0.565ms) IOPS: 226.4K 2.3 GiB/s (0.839ms) IOPS: 161.7K 5.2 GiB/s (3.001ms) IOPS: 44.9K 5.9 GiB/s (2.662ms) IOPS: 47.3K 6.3 GiB/s (19.877ms) IOPS: 6.4K 6.1 GiB/s (20.579ms) IOPS: 6.2K
Crucial T705 2TB 3.3 GiB/s (0.587ms) IOPS: 217.0K 2.3 GiB/s (0.836ms) IOPS: 152.6K 5.5 GiB/s (2.863ms) IOPS: 44.7K 5.6 GiB/s (2.799ms) IOPS: 45.7K 6.0 GiB/s (20.738ms) IOPS: 6.2K 6.0 GiB/s (20.855ms) IOPS: 6.1K
SK hynix Platinum P51 3.1 GiB/s (0.634ms) IOPS: 200.9K 1.5 GiB/s (1.314ms) IOPS: 97.2K 5.6 GiB/s (2.781ms) IOPS: 46.0K 3.9 GiB/s (4.014ms) IOPS: 31.9K 6.2 GiB/s (20.126ms) IOPS: 6.4K 4.2 GiB/s (29.576ms) IOPS: 4.3K
Crucial P310 2TB 3.1 GiB/s (0.627ms) IOPS: 203.2K 2.2 GiB/s (0.902ms) IOPS: 141.4K 4.1 GiB/s (3.845ms) IOPS: 33.3K 3.9 GiB/s (3.992ms) IOPS: 32.0K 4.4 GiB/s (28.462ms) IOPS: 4.5K 4.1 GiB/s (30.964ms) IOPS: 4.2K
Micron 2600 2TB 3.1 GiB/s (0.629ms) IOPS: 202.4K 2.1 GiB/s (0.906ms) IOPS: 140.8K 4.0 GiB/s (3.889ms) IOPS: 32.9K 3.9 GiB/s (3.960ms) IOPS: 32.3K 4.4 GiB/s (28.535ms) IOPS: 4.5K 4.2 GiB/s (30.053ms) IOPS: 4.3K
Samsung 990 Pro 2TB 2.7 GiB/s (0.731ms) IOPS: 174.4K 2.2 GiB/s (0.903ms) IOPS: 141.2K 4.0 GiB/s (3.944ms) IOPS: 32.4K 4.1 GiB/s (3.849ms) IOPS: 33.2K 3.9 GiB/s (32.415ms) IOPS: 3.9K 4.2 GiB/s (29.520ms) IOPS: 4.3K
PNY CS2150 2.5 GiB/s (0.779ms) IOPS: 163.5K 1.8 GiB/s 1.107ms) IOPS: 115.3K 4.5 GiB/s (3.473ms) IOPS: 36.8K 4.7 GiB/s (3.357ms) IOPS: 38.1K 4.6 GiB/s (27.157ms) IOPS: 174.4K 4.9 GiB/s (25.682ms) IOPS: 5.0K
Crucial P510 2.3 GiB/s (0.837ms) IOPS: 152.2K 2.3 GiB/s (0.842ms) IOPS: 151.5K 4.5 GiB/s (3.450ms) IOPS: 37.1K 4.8 GiB/s (3.262ms) IOPS: 39.2K 4.8 GiB/s (26.218ms) IOPS: 4.9K 5.0 GiB/s (25.121ms) IOPS: 5.1K
WD SN850X 2.3 GiB/s (0.736ms) IOPS: 173.2K 2.0 GiB/s (0.989ms) IOPS: 129.0K 4.1 GiB/s (3.878ms) IOPS: 33.3K 4.0 GiB/s (3.958ms) IOPS: 33.0K 4.4 GiB/s (30.501ms) IOPS: 4.5K 4.1 GiB/s (30.782ms) IOPS: 4.2K
Micron 3610 2TB 2.2 GiB/s (0.884ms) IOPS: 144.3K 307.7 MiB/s (6.5ms) IOPS: 19.7K 2.9 GiB/s (5.4ms) IOPS: 23.7K 2.1 GiB/s (7.6ms) IOPS: 16.8K 3.8 GiB/s (33.1ms) IOPS: 3.9K 4.9 GiB/s (25.5ms) IOPS: 5.0K
TEAMGROUP GE PRO 2TB 0.8 GiB/s (2.464ms) IOPS: 51.8K 1.0 GiB/s (1.913ms) IOPS: 68.8K 2.8 GiB/s (5.627ms) IOPS: 22.7K 2.1 GiB/s (7.309ms) IOPS: 17.5K 4.2 GiB/s (29.599ms) IOPS: 4.3K 2.7 GiB/s (49.915ms) IOPS: 2.7K
TEAMGROUP GC PRO 2TB 0.8 GiB/s (2.589ms) IOPS: 49.3K 1.0 GiB/s (1.899ms) IOPS: 67.3K 2.7 GiB/s (5.860ms) IOPS: 21.8K 2.4 GiB/s (6.636ms) IOPS: 19.3K 3.7 GiB/s (34.007ms) IOPS: 3.8K 3.7 GiB/s (33.414ms) IOPS: 3.8K

Conclusion

The Micron 3610 marks an important step in bringing QLC NAND into the PCIe Gen5 client space, but its performance profile is clearly specialized. It delivers impressive burst write speeds and shows strong behavior in DirectStorage workloads, making it a reasonable fit for modern gaming systems and thin-and-light notebooks that value power efficiency and cost.

Outside of those scenarios, however, the tradeoffs are evident. Read-heavy workloads, such as AI model loading, expose the lower sequential ceiling, and small-block GPU Direct Storage writes reveal the limitations of a DRAMless Gen5 QLC design. In broader application testing, it trails even older Gen4 QLC drives in responsiveness.

The Micron 3610 is neither a performance leader nor a universal upgrade over established TLC or mature Gen4 QLC options. Instead, it serves a specific purpose: delivering strong burst performance and modern platform compatibility in an efficient form factor. For buyers who understand those boundaries, it can make sense, especially if pricing aligns with those expectations.


The post Micron 3610 Review: A Focused Entry Into Gen5 QLC appeared first on StorageReview.com.

❌